Balance sheets of the Fed, ECB, BOJ, BOE, and central banks of China, Canada, Australia, Switzerland, and India as % of GDP.
By Wolf Richter for WOLF STREET.
The major central banks around the world have been unwinding their balance sheets for the past few years, even the Bank of Japan, which got a late start in 2024. Their balance sheets had swollen to grotesque proportions during the global QE frenzy that started in 2008, and QE-mania during and after the pandemic. But that has been getting unwound.
The Bank for International Settlements (BIS), an umbrella organization owned by its member central banks, released its latest quarterly data on central bank balance sheets today. We’ll look at the decline of the balance sheets of nine major central banks: Federal Reserve, European Central Bank, Bank of Japan, People’s Bank of China, Bank of England, Reserve Bank of India, Bank of Canada, Reserve Bank of Australia, and the Swiss National Bank.
In normal times, central-bank balance sheets, including the Fed’s balance sheet, grew with the economy, as measured by GDP; and the ratio of total assets as a percentage of GDP back then was low and roughly stable over the years. Years of QE then caused the ratios to explode. And years of QT have now caused the ratios to shrink dramatically.
The ratio of total assets (in local currency) to GDP (in local currency) allows us to compare the relative size of the balance sheets of different central banks. The ratio eliminates issues associated with exchange-rate fluctuations (since the underlying data is in local currency) and inflation (since the inflation factors are both in the numerator and in the denominator and thereby cancel each other out).
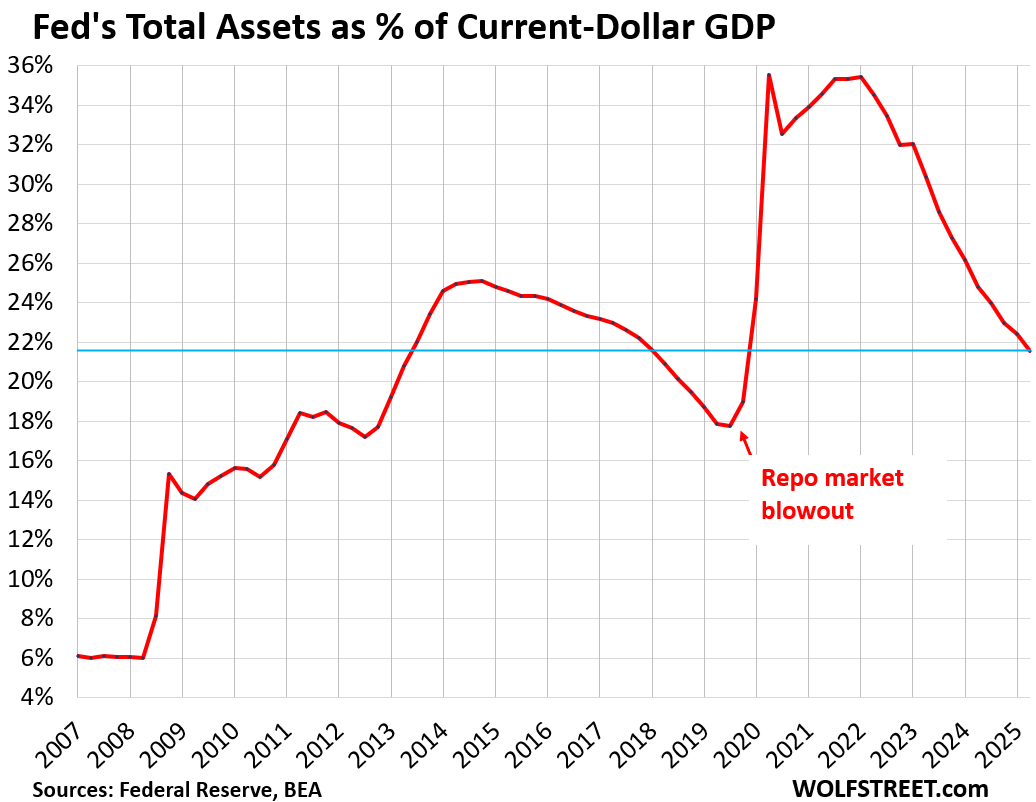
Federal Reserve chair Powell talked about this ratio at the last press conference to demonstrate by how much the Fed’s three-plus years of QT has shrunk the balance sheet. Even if the balance sheet remains flat going forward, while the economy grows, the ratio will continue to shrink – a soft form of QT. I’ve been discussing this ratio for over a year, most recently in my Fed balance sheet analysis for October.
By October, the Fed’s QT had shed $2.4 trillion in assets, and the assets-to-GDP ratio dropped to 21.6%, where it had first been in Q3 2013:
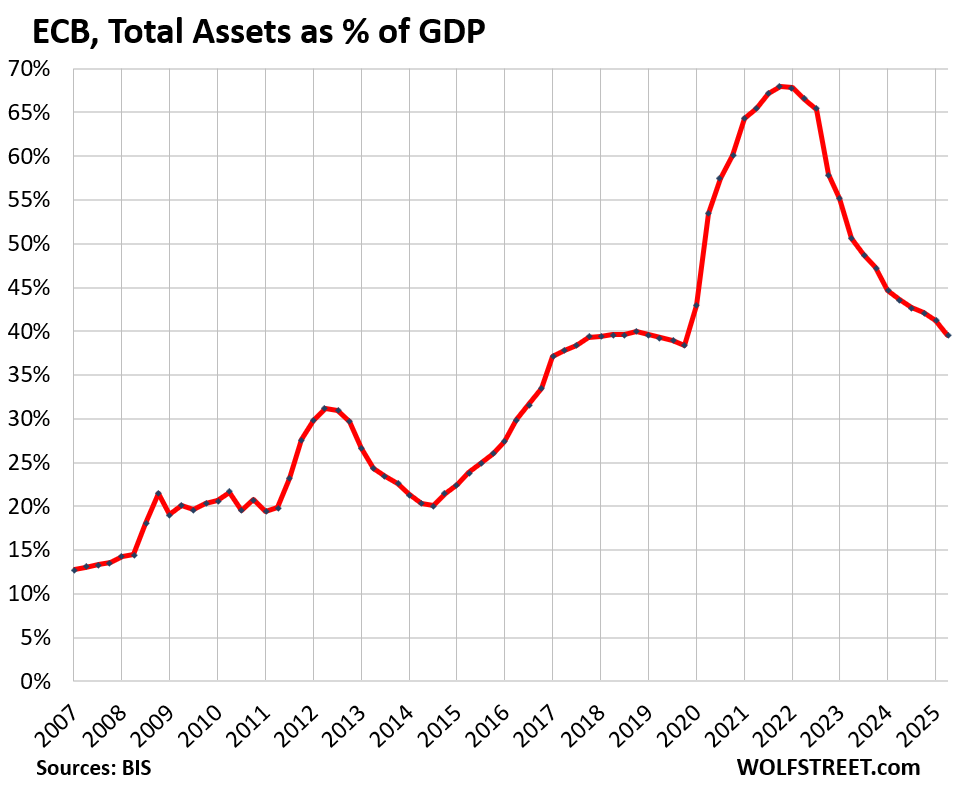
The European Central Bank shed €3.3 trillion ($3.8 trillion) of its QE assets, and QT continues at the pace that was accelerated for 2025. Here is my detailed discussion of the ECB’s balance sheet through Q3, including its gold holdings which are marked to market quarterly.
The ECB’s total-asset-to-GDP ratio has dropped to 39.5%, according to BIS data today. While this removed the entire pandemic QE spike, and is way down from the crazed money-printing peak in Q4 2021 when the ratio had hit 68%, it remains very high. (By comparison, the Fed’s assets-to-GDP ratio had maxed out at just under 36% in early 2022 and is now at 21.6%.)
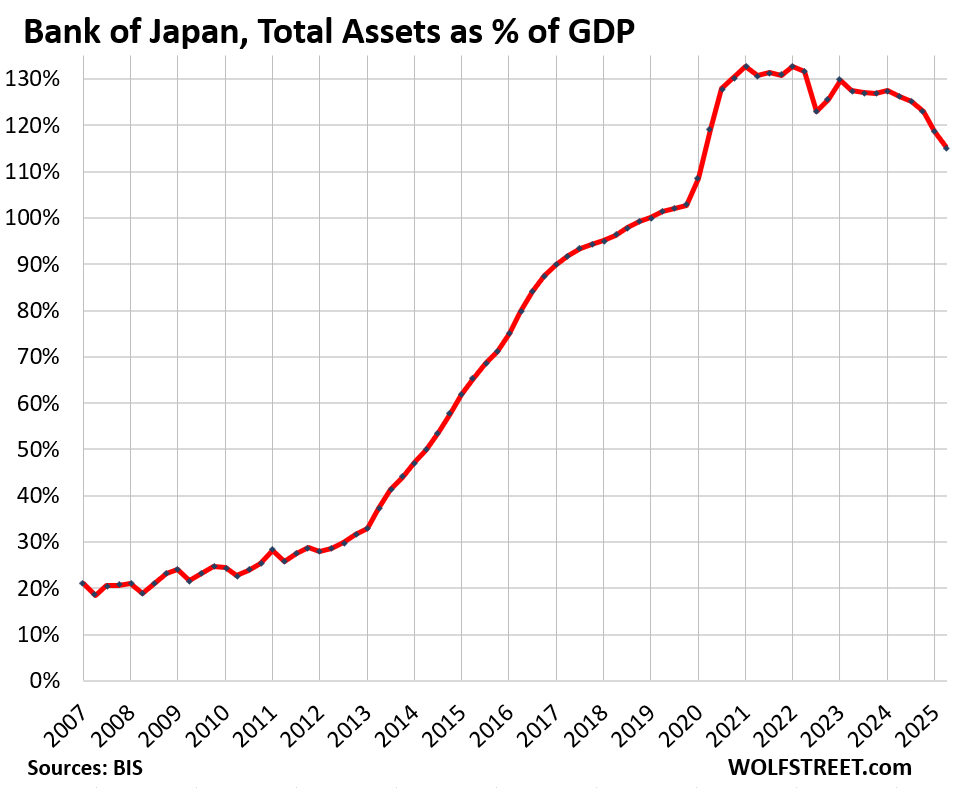
The Bank of Japan is in a category of its own, along with the Swiss National Bank (SNB), in terms of money printing craziness. But even it flipped to QT in early 2024, and has since then accelerated the pace. At the end of the quarter through September, total assets had fallen by ¥61.2 trillion ($407 billion), or by 8.1%, back to where they’d first been at the end of 2020. My discussion of the details of the BOJ’s balance sheet is here.
The BOJ’s assets-to-GDP ratio dwarfs the ratios of the other central banks, except for the SNB’s. At the peaks in Q1 2021 and Q1 2022, the ratio had hit 132.7%, nearly double the ECB’s crazed money-printing peak ratio of 68%, and nearly four times the Fed’s money-printing peak ratio of 36%.
The ratio has now dropped to a still gigantic 115%:
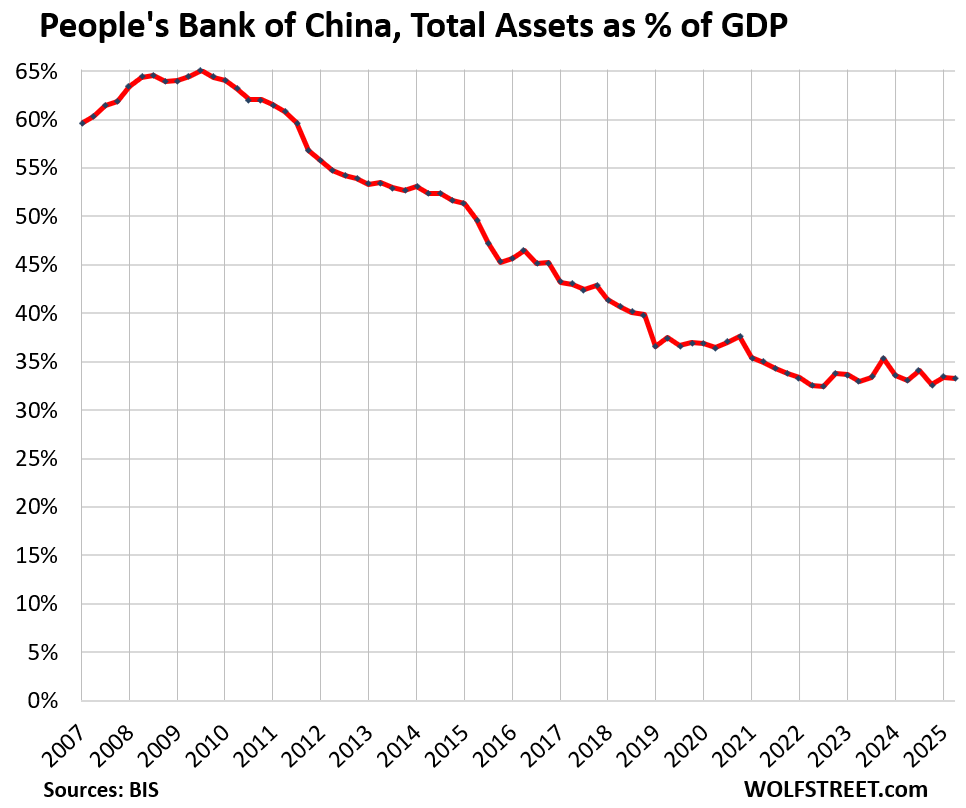
The People’s Bank of China is part of the government, and its Governor is a member of the cabinet. The PBOC has changed a lot over the past 30 years, during which it became an actual central bank. Some of its activities are outside of what normal central banks do, but it has shed many of them, such as by spinning off China’s sovereign wealth fund, which is now the CIC.
The PBOC’s assets-to-GDP ratio has been roughly stable at 33% for the past three years, down by half since 2009, according to BIS data today:
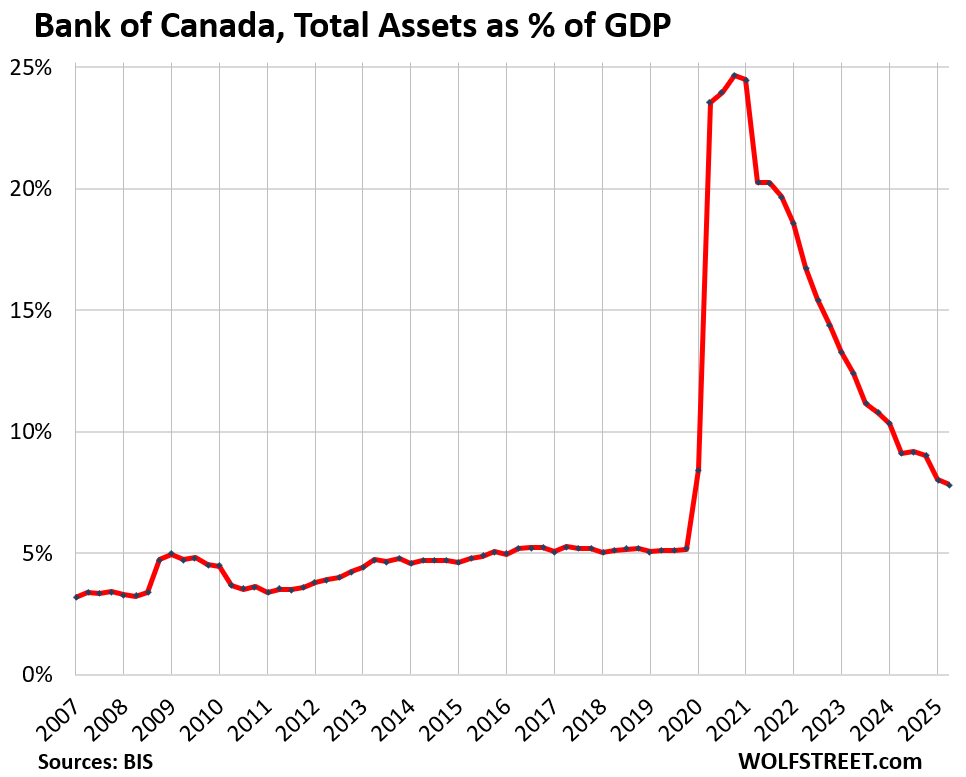
The Bank of Canada maxed out its assets-to-GDP ratio in Q4 2020 at 24.7%, after short but massive QE. It ended QE at relatively low levels and then shed assets fast and furious (details here).
The BOC’s assets-to-GDP ratio has now dropped to 7.8%, according to BIS data today, which is where the Fed was before 2008.
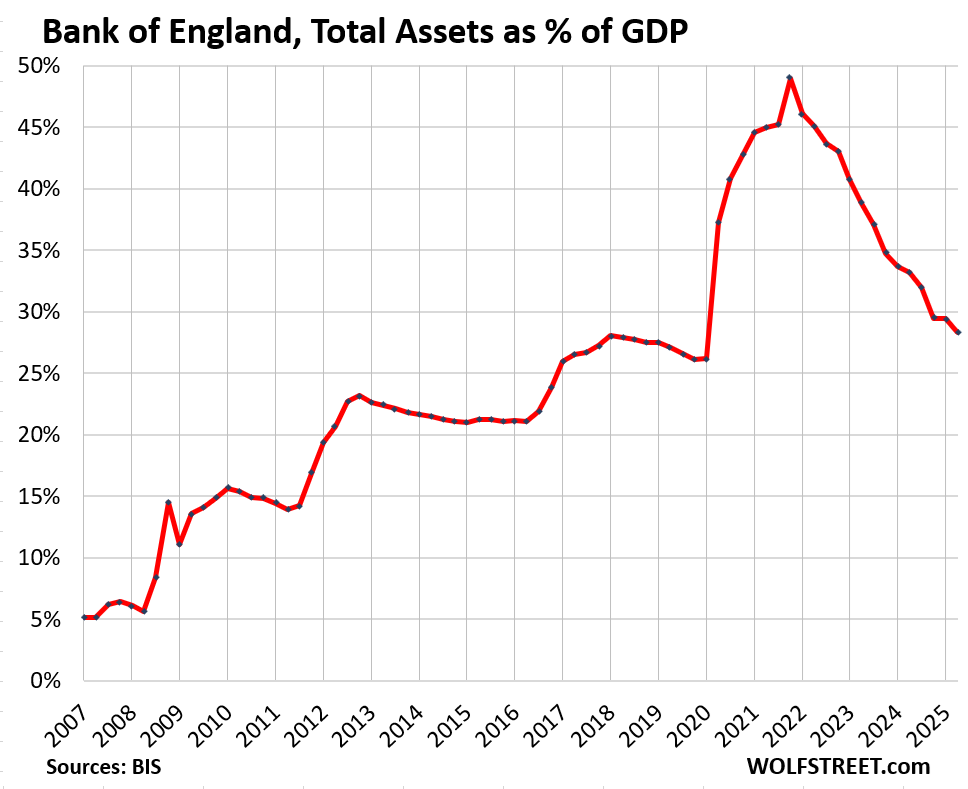
The Bank of England, which loaded up on very long-term bonds with terms out to 2070, has been selling outright its bond holdings. In May this year, the BOE said it would sell all its bonds and address any liquidity issues with repos, which is the classic pre-QE way of balance sheet management.
Its assets-to-GDP ratio had peaked at 49% in Q4 2021, and has now dropped to 28.3%, according to BIS data today:
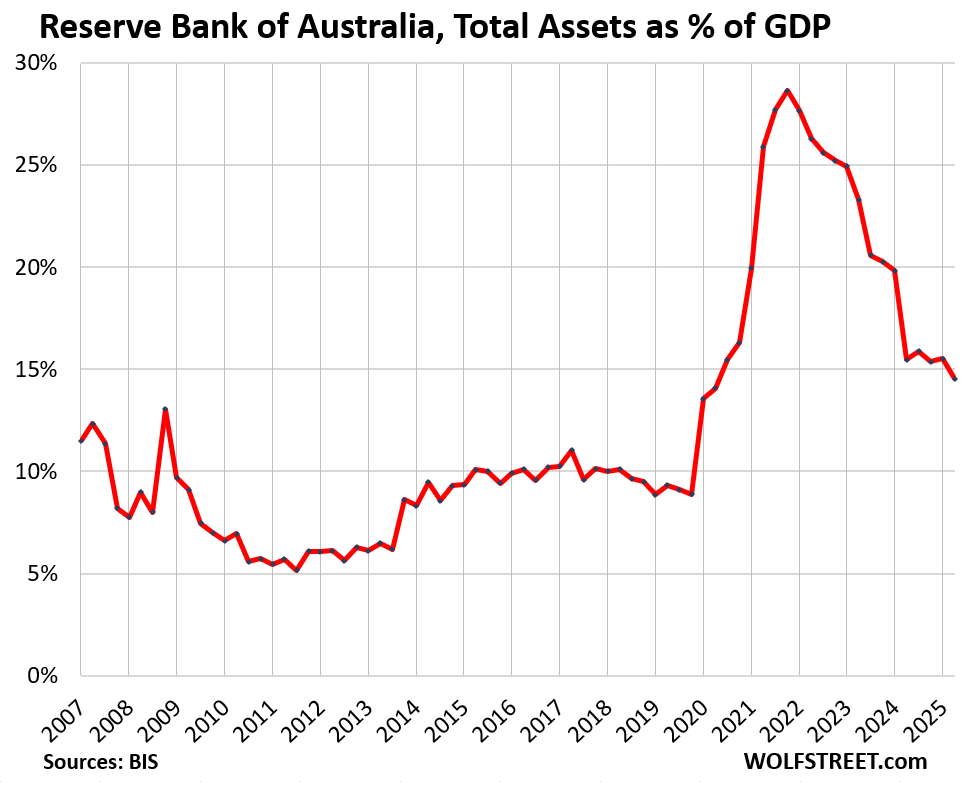
The Reserve Bank of Australia ended QE in 2021 when its assets-to-GDP ratio peaked at 28.6%. The ratio has now dropped to 14.6%:
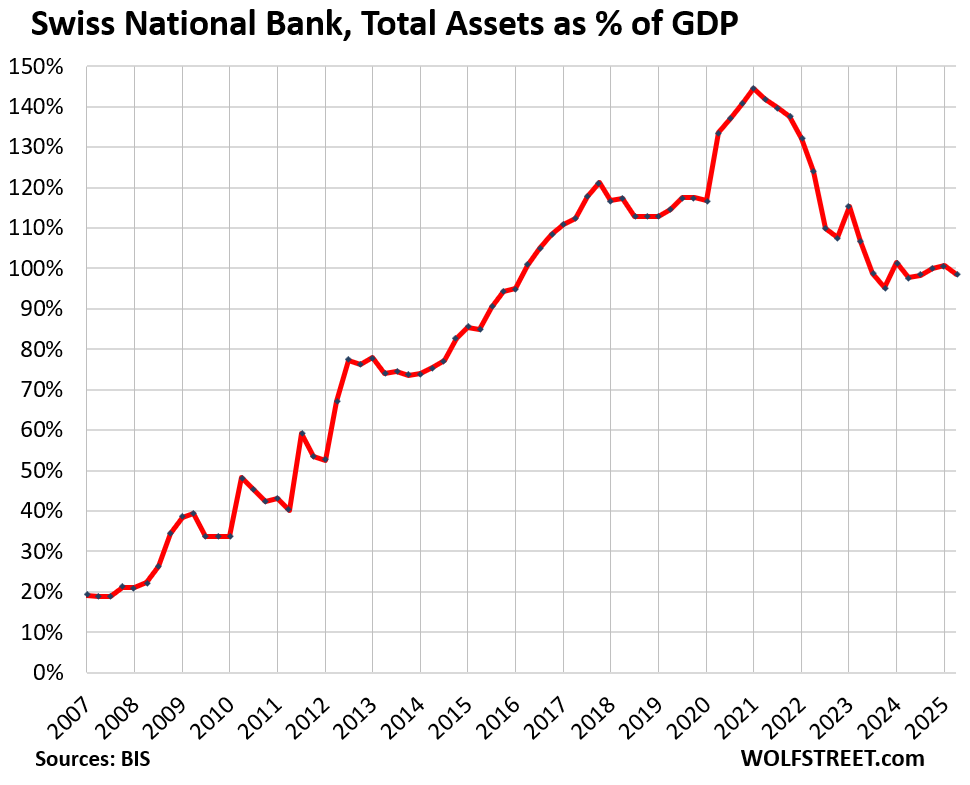
The Swiss National Bank is onto a different scheme rather than QE. It prints Swiss francs (CHF), but instead of buying CHF-denominated assets, as you’d do for QE, it sells the francs in the foreign exchange markets into ravenous demand, and with the dollars, euros, etc., that it obtains this way, buys assets denominated in those currencies. Under US law, it has to disclose in quarterly SEC filings its holdings of US stocks, so we can follow those. But the details of its other holdings are not disclosed. So this is not really a QE-inflated balance sheet; this is the balance sheet of a hedge fund that can print its own money. It only works as long as there is ravenous demand for Swiss francs.
The asset to GDP ratio has been around 100% for the past two years, down from 145% in Q1 2021:
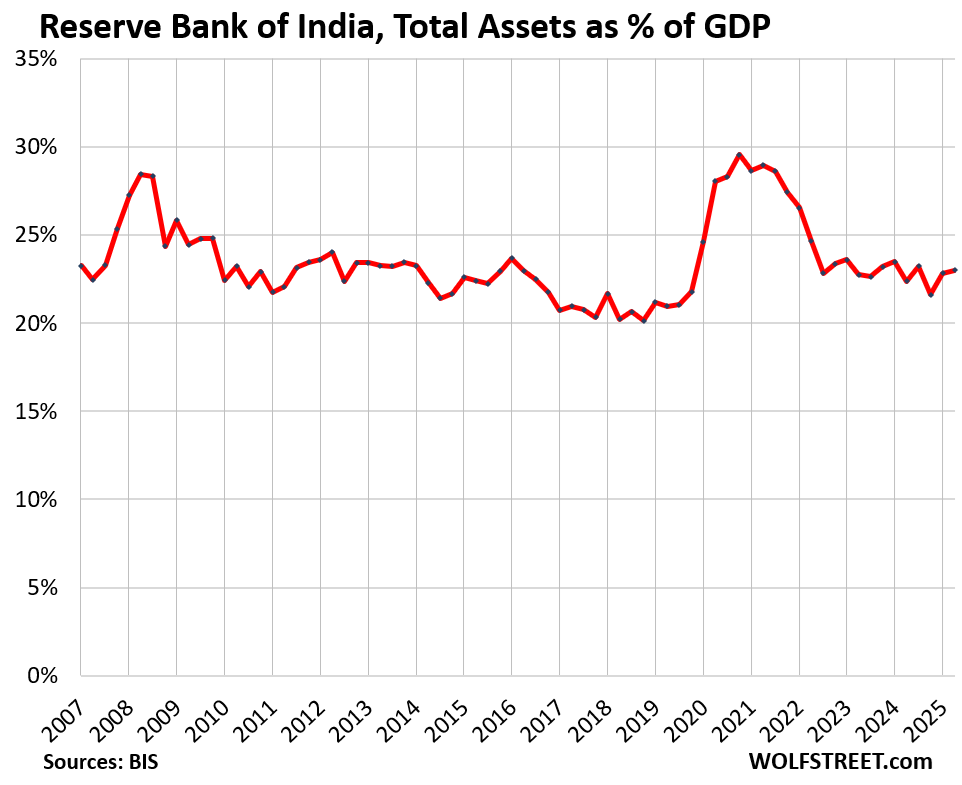
The Reserve Bank of India, which has to keep an eye on its continuously devaluing currency (against the USD), used QE briefly during the last two crises, but reverted quickly to its relatively high normal assets-to-GDP ratio, which was 23% in the last quarter.
They’re all seeing the same thing: A continued threat of inflation and massive distortions and risks in asset prices, including dangerous housing bubbles that are now deflating in some markets. So they’ve been removing some of the fuel, to walk back from those risks.
Enjoy reading WOLF STREET and want to support it? You can donate. I appreciate it immensely. Click on the mug to find out how:

![]()
Happy Thanksgiving everyone!!!
Happy Thanksgiving Good Sir snd Commentors. 🍻
🙂🦃 🍷 🥳🎈 🍰 😴
Happy Thanksgiving, Wolf!! 🎉🦃🎉🦃
Happy gobble gobble!
Drunk Sailors everywhere are ready to shop tomorrow!
I saw prob about 500 TVs in boxes in the aisles of Best Buy. Wild!
Happy Thanksgiving! 🦃
Happy Thanksgiving!
.
Thx for finding me and putting me back on the email list.
.
What are the implications of all these shrinking balance sheets on world markets?
I think there is a situation developing that is part economic but also part the morality of our society.
The rise of housing prices is correlated with QE, an inflationary monetarist, untested theory held by the steward of QE, Ben Bernanke.
Removing excess liquidity from the system is like Buffet’s anology of the tide going out.
Ever the cynic, my immediate thought on all these graphs is that they are making headroom for war expenditure.
Would be interested to see an update on what the Swiss National Bank now owns for US Stocks since Feb 2023 (last publishing). They unloaded a bunch during the 2022 market sell off…would be curious how/if they’ve reloaded since then.
Central banks should not be allowed balance sheets. On it is mere crap the market won’t accept, at those prices.
It like buying up your kids lemonade at their lemonade stands and then bragging there’s demand for it.
They are facilitating poor governance.
That’s one of the key purposes of a central bank. Banks like to lend against recoverable assets like real estate and stocks because they can take over those assets if the borrower defaults. But the act of lending against them causes them to increase in value. Eventually prices get too high and folks stop buying them and the prices begin to decline. At that point, people stop making payments on depreciating assets, banks can’t pay their own bills, the economy freezes up and millions of innocent people are thrown out of work. So the Fed has to step in and buy assets at inflated prices. They should be regulating banks in a way that they don’t get in this kind of trouble in the first place, but they’re obviously haven’t found a great way to do that.
“But the act of lending against them causes them to increase in value.”
and
“So the Fed has to step in”
Hmm…perhaps there is a point to be made here.
If “regular bank” lending (or just plain old crapola financing in general) feeds price inflation…perhaps the exact same is true when the central bank does it…
We have never had ‘good’ governance, and likely will not. The Central banks do a decent job of covering up or ameliorating ‘poor’ governance, perhaps…
It’s basically a half naked politician trying to hang onto a rocket. 🚀 👨🏻💼
That’s good imagery for our system.
“covering up or ameliorating ‘poor’ governance, perhaps…”
Papering over failed governance (with paper money) never helped anything…all it does is insulate (temporarily) – and therefore perpetuate – failed governance.
Deluding the nation into thinking it is more internationally competitive and economically wealthy than it *really is* is not some sort of public service.
Brett
Indeed.
The notion that the central bank was only there to defuse banking issues and expand the money supply to meet an expanding economy has been displaced by a nanny monetary state where the Fed’s main concern seems to keep asset prices inflated. That takes a balance sheet used to hide government debt from the discipline of a free market.
Down day in stocks and one can anticipate the Fed marching out a governor with some rate cut talk.
You sir are obviously have a point of view that is ignorant about the valuable contribution that the invention of accounting has served mankind.
Best wishes
The Fed and accounting?
Curious that the Fed has “special” accounting principles unique to them…not GAAP
Yes, by definition, the Fed cannot use GAPP because the Fed does not have a “cash” account, unlike all other companies. It does not need one because it creates money when it pays for something and destroys money when it gets paid for something, every second of every day.
GAAP is for companies. Companies have a cash account and have to take money out of their cash account to pay for something and put money into their cash account when they get paid for something. GAAP is not for central banks that create and destroy money instead of taking it out of or putting it into a cash account.
Swiss balance sheet. I wouldn’t trust the swiss nor their banking system as far as I could throw em. Sorry, I lost any respect for the Swiss gov/banks because of their actions during/after WW2. Some of you may know why.
The world has turned and generations have diluted the memory of the social Democracy of FDR’s America.
My dad was shot in the face in Germany and came home and worked at union jobs that payed a family level wage and health insurance,
I remember the pain of trying to guide him through the start up of the XT computer he had purchased when he was over 80
It would be interesting to know how and to what extent these balances translate into movements in the volume of broad money supply.
I agree. After all, the market is understood to be an honest game,
Incapable of being wrong which has resulted in several cataclysmic dislocations or crashes to the uneducated.
Liquidity is the mother of excess. The with drawl the mother of the fools that bet wrong
Great charts. I think Japan is the most interesting country. Japan has by far the highest debt-to-GDP ratio in the world among major economies. It’s had to see Japan generating sufficiently large fiscal surpluses to “repay” this debt. It will have to be monetised. I used to think this would likely happen via aggressive quantitative easing. The BOJ keeps hoovering up bonds and then, as some time in the future, it’s cancelled. However, as per Wolf’s chart, the BOJ’s balance sheet is now shrinking, albeit only by a small amount.
Sanae Takaichi’s policies are likely to result in more aggressive quantitative tightening. Her huge stimulus package was recently approved and she’s pursuing a populist debt fuelled agenda, much like Liz Truss tried to do.
At the same time, inflation is starting to increase and will likely get worse given the government’s huge fiscal stimulus. The BOJ will likely have to raise rates. The increase in short and long end rates will make debt servicing very difficult. I now think the likely end game will be massive Yen depreciation.
Inflation devalues the currency and the debt that is denominated in that currency. Year of inflation is one way to deal with the debt. This is the reason the BOJ has kept its policy rates so low, though it hiked them by about three hairs from negative to +0.50%. Inflation now around 3%, same as in the US.
Yes, we are seeing how inflation works its magic in bringing down asset-to-GDP ratio (works similarly for debt-to-GDP ratios).
BoJ has dropped assets by 61T Yen (8% of the total asset base) to 695T Yen. At constant nominal GDP, this would have been around 10% drop but as nominal GDP increased from 595T to 635T, asset-to-GDP ratio dropped from 130% to 115%.
Even if they do not shed assets further and have 0% real GDP growth, constant 3% inflation will mean that nominal GDP will grow to 1300T Yen by 2050, and the ratio will shrink to a very “normal” 55%.
BoJ has planned this perfectly. They just need to maintain discipline and ensure 0% real GDP for next 25 years.
Honestly, I look at the interest being payed on their long term bonds and I see junk bonds. Was not it just yesterday that asset miss pricing crashed the domestic economy
If the money supply vs GDP has dropped back down to sane levels, why are prices still obscene? If money printing caused prices to rise, wouldn’t unprinting cause a decline in prices?
I don’t buy this “inflation is a weird phenomenon that no one understands” nonsense.
I think it’s just ongoing corporate greed fueled by momentum and narrative, and consumers being asleep at the wheel.
The common person is paying the price despite being gouged, either due to ego (refusal to refrain from old consumption habits) or because they are “forced to” (HOAs, apartment rent scaliping, property taxes).
Corporations love it. The almighty pensions and 401Ks love it. The only losers are the peons who have to work for a living. No biggie.
The world has gone into an inflationary mindset – consumers expect price increases and no longer bat an eyelid. And corporations can’t be happier. Increasing nominal asset prices only fuels the trend – a case of tail wagging the dog.
Only an economic slowdown will likely reverse this. But the famous FED put is still there – any hint of an economic slowdown and you will see the printing press go ‘whrrrr’ again. And the balance sheets will regain their past glory days.
Tech firms talk in terms of trillions these days. Another round of money printing and they will be talking in quadrillions.
Agreed with a lot of this but not with the first sentence, consumers truly are batting an eyelid and angry about high inflation as the reactions and elections this past November and other indications show. Trying to dismiss this with higher nominal spending numbers doesn’t invalidate the resentment. When inflation hits so hard even for basic costs like housing, health care, groceries it’s not like consumers have much choice but for to eat the higher prices.
You can’t stop just buying food or paying the higher health insurance costs, HOA fees, daycare costs, homeowner’s insurance or for property taxes forced on you. Argentines paid much higher prices for food, housing and everything else and nominal spending went way up with mass inflation and people had little choice but to eat the higher prices, doesn’t mean they were happy about it. And it really isn’t true that top 10 percent of earners do half of spending. This gets claimed out of the blue but there’s no real way to measure something like that with precision, it’s been debunked in a few places and is maybe more like somewhere in 20 to 25 percent. Whatever the actual number, everyone feels the impact of the higher prices. Overall theme park attendance in the US is down, Vegas is suffering and even state events and festivals are seeing a reduction in people, Texas’s fair was down by hundreds of thousands of people. Inflation and higher costs for even basic things just means lower buying power for each dollar you earn and save, and squeezes other things,
So Americans really are feeling and hurting from the inflation. It’s not so easy to get higher wages in an existing job (a lot of the wage increases are only if you’re starting a new one) and quitting and trying for another brings its own costs and uncertainties. Higher prices just pile more and more pressure and it hits Americans at all income levels. We’re already seeing a record number of auto repos, the private credit market is a mess (First Brands hardly the only example), CRE, now foreclosures and credit card defaults and delinquencies starting to rise again, the debt fuelled circular deals of the AI companies and who knows how much in BNPL debt. All this on the top of $38 trillion debt for the US and still rising, and retail investors buying stocks on margin debt. The Fed put can’t put off economic gravity forever with the Fed put, that’s what brought us 2008 and the GFC in the first place.
A lot of the spending is discretionary, not essential.
People splurge on things as the idea of conservating saving (FDs, savings account) has been rendered meaningless by the never-ending stream of money printing. When it is only a choice between participating in the volatile casino-like stock market or losing to inflation, borrowing heavily for your next fancy car doesn’t seem that bad.
There is a reason why gamblers are the most reckless spenders as well. Money doesn’t hold any long-term meaning to them. And most of us are getting converted.
Inflation is an interesting thing. My annual expenses are about what they were in my 20s, four decades ago and my quality of life gets better every year. I’ve worked/saved/invested during that time and somehow avoided being a sucker. Luxury vehicles are most people’s financial money pit from my perspective.
Your expenses are the same as they were 40 years ago? I don’t believe you.
Fair enough. I’m an outier.
@ Wolf
@ Carlos
Carlos said: “If the money supply vs GDP has dropped back down to sane levels, why are prices still obscene? If money printing caused prices to rise, wouldn’t unprinting cause a decline in prices?”
—————————————–
Wolf’s article isn’t discussing money supply vs GDP. The FED’s balance is not close to a full measure of the money supply.
right or wrong?
My guess as to why inflation is still elevated is that while the supply of dollars in the world has decreased, the US govt is still borrowing a very large and increasing amount of those dollars to spend on Medicare, Defense, Interest, etc. and that is then getting to wages, profits, asset prices that are supporting spending. So it may be that the inflation pressure from dollars is less in other places around the world that are loaning their dollars to to the US.
Maybe because the P in GDP doesn’t really mean much anymore. It certainly isn’t helping grow a robust middle class anymore. What is the output for all these data centers? Analyzed data that magically makes everything better? The jury’s still out on that one
Governments love inflation too. The Fed insist on at least 2%. It’s free money to the government. A tax on the whole world that uses USD.
You can’t blame it all on corporate
A famous Nobel winning economist once said, “Economics is not a morality play.” I was thinking about this in the context of QE/QT.
So, currency – USD – is a token (physical or digital) that vast numbers of people believe has purchasing power. The government requires it to pay mandatory taxes.
The Federal Reserve “mines” (creates) these tokens through printing money.
Banks “mine” (create) these tokens through the “money multiplier” effect when lending in fractional reserve banking.
(Note: I’m not trying to justify crypto, just using one of their concepts of token creation for a point).
Private citizens expend effort to acquire these tokens:
The homeless guy panhandling at a busy intersection; prostitutes selling their bodies; drug dealers selling drugs.
A mechanical engineer; a computer programmer; a nurse.
A plumber; a carpenter; a crane operator; a butcher.
A cop; a commando; a soldier.
A surgeon; a lawyer; a middle manager.
A person writing economic analysis on their website; a Fortune 500 CEO; a bond trader; a politician.
All these people are expending effort to obtain these tokens. For some, the effort to acquire a token is low. For others, very high. For some their effort creates high value and yields relatively few tokens; for others, their effort creates low value and yields large numbers of tokens.
Fairness, morality and justice, hard as they may be to *exactly* define, do exist, in economics, in law, in interpersonal relationships and other arenas.
I think central banks, and the government, should take fairness, morality and justice into account in monetary and fiscal policy because there is fairness/unfairness, morality/immorality, justice/injustice in the economy and monetary policy. Economics may not be a “morality play” but that’s a red herring, largely to justify unfairness / immorality / injustice.
And, Happy Thanksgiving.
Thanks for the reminder of that. It’s fun to remember the days when Krugman seemed to offer such a cogent analysis of the economic situation.
His column was not the place to go for investment advice, though he never claimed it was. I recall a post from the same era where he said he wasn’t really a big investor and generally left his money in the bank. That does not look like such a great strategy 15 years hence.
It would be nice if economists overall had the same level of humility with regard to morality and value judgments, an area where they have no special competence. The pivot to highly moral language from the Fed surrounding monetary inventions—which I seem to recall coinciding roughly with the year of the repo blowout—has been eyebrow-raising. I fully support “inclusive employment,” though I think many people have an instinctual sense that creating a few temp jobs is not an adequate justification for the permanent gift of trillions of dollars of free money to private parties. But people who have spent their lives surrounded by a combination of financiers and academics steeped in rather eccentric flavors of utilitarian ethics may have a different perspective.
Happy Thanksgiving.
My big biased complaint with Krugman is he never had any genetic skin in the game. In my opinion he was concerned with instant gratification instead of the well being of his children and grandchildren children. Eventually, you can’t kick the can down the road. Speculators have to do the time for the crime. I too read his columns.
I’m not a fan.
I like the guy who writes the “Strategies” section on investments.
If Krugman really did keep his money in the bank, he is a complete financial moron and someone should take back his Econ Nobel Prize.
Yeah, that’s why homes now have decks instead of front porches.
Alpha
The seemingly free money from asset ownership is a wedge between those benefiting and those who dig the holes, fill the shelves, drive the trucks, and other blue collar workers.
This creates a bifurcation of the society …. .and history suggests that is not healthy.
The Fed “fluffing” the pillow for some, and pretending that cutting rates helps Main Street. What rate cuts would reverse the recent layoffs?
In terms of “asset holders”: 65% of all households are homeowners, and therefore they’re “asset holders” that own a big asset called real estate. And 60% of households are stockholders, many of them through their 401ks and IRAs, and they’re “asset holders.” Young people trade maniacally all kinds of stuff, from cryptos and zero-days-to-expiration (0DTE) options to meme stocks, and THEY are asset holders. Many older people hold neither stocks nor crypto nor options, but have savings, money market funds, CDs, bonds, T-bills, etc., and they’re “asset holders.”
According to FRED through Q2 2025, the bottom 50% have 2.5% of net worth, and the 50th to 90th percentile have 30.1%. So the bottom 90% have less than one-third of total net worth, or about the same net worth as the top 1%. As you point out, many people own some assets in one form or another, but I don’t think that negates the bifurcation JustAsking mentions. When evaluating the impact of Fed policies benefitting “asset holders,” the issue isn’t whether a high percentage of people own some assets, but rather how much they actually own and thereby stand to benefit from Fed policies favoring “asset holders.”
rojogrande
1. People need to get a grip. The wealth inequality is in EVERY SOCIETY. There have always been rich people, and poor people, and homeless people. It has been in the US at all times forever. Since when is this new? If you want to debate the “bifurcation of society,” you need to do this on a social justice warrior blog.
Inequality may have risen, but the wealth of those below the middle has also risen. That’s what’s important for the economy. The wealth distribution is important for social justice warriors. And I delete those here.
People apparently cannot understand the difference between wealth and wealth distribution.
2. Using your figures:
Total household wealth (not worth) = $167 TRILLION. Per your calculation, the bottom 90% have 32.6% of $167 TRILLION = $54 TRILLION.
But households of the bottom 90% includes the homeless and the desperately poor that have no wealth, so maybe the bottom 15%.
The bottom 15% to 90%, so the middle 75% of households have $54 TRILLION. That’s 99 million households have $54 trillion. So the middle 15% to 90% have a net worth of $545,400 per household on average. It is just stupid to say that they’re poor.
The bottom 15% to 50%, they’re below the middle but above the homeless and desperately poor, and they 2.5% of $167 trillion, or $4.17 trillion. That’s 46.2 million households, the bottom above the homeless and the desperately poor, have $90,300 per household on average. Obviously someone at 49% would have much than $90,300, and someone at 16% would have very little.
Does Monetary expansion spread evenly. No. Cantillon Effect. New money concentrates where it enters—in financial assets, real estate, and the balance sheets of those with credit access. This creates two economies: one for asset-holders, enriched by expansion; another for wage-earners, crushed by the cost increases that follow….IMO from observation
That stuff is just nonsense. Most asset holders are wage earners. A majority of wage earners hold assets through their retirement funds, pension funds, stock compensation plants, homeownership, cryptos, gold, CDs and savings, money market funds, T-bills, Treasuries, bonds, etc. For example, 60% of all households are stockholders. 65% of all households are homeowners. Many young people who own neither homes nor stocks own cryptos. Lots of young people trade stocks. You cannot cut America into two slices like that.
In America we reward innovation and a quality product or service that separates itself from the pack.
Blue collars are welcome to participate, prob need to innovate to really make $$$ tho, or maybe win the lottery?
It trickles down.
Operative word….”trickle”
Wolf, what was going on in 2013 that caused the balance sheet to expand? In other articles you have labeled this as “No Crisis”.
“QE infinity.”
QE3 was a misnomer. Stepping up from 40b to 85b in open market purchases in Dec. 2012 didn’t work as intended. Oil peaked in Jan and fell for 2 years because legal reserves dropped. Real interest rates skyrocketed.
We had a “taper tantrum” because the FDIC lowered deposit insurance back to 250.000 from unlimited.
QE3 also coincided with an increase in 40b in MBS purchases. This happened as long-term interest rates were falling as the housing market bottomed out.
Than you.
^Thank
Interesting and exciting times for market and financial sleuths. The $vix popped up to 18.52 at market open and at the end of the first 10 minutes dropped to 15.78. You don’t see that often, perplexing move. Googl gave up its mornings gains but still up 6.3% for the week. Interesting to see where it closes the week and looking for $vix to tell a story.
“this is the balance sheet of a hedge fund that can print its own money”
Can you spend a few words on this?
What’s amazing is that interest rates have come down as the Central Bankers have “washed out” their previous purchases.
What’s historically divergent is that the percentage of time deposits to transaction deposits has fallen propelling the economy forward.
Nice charts.
Global M2 money supply has been increasing in 2025 . It was 80 trillion in 2021. It was 88 trillion at the beginning of the 2025. It is 96 trillion now. So it took 4 years to increase 8 trillion and 11 months to increase another 8 trillion.
I have no idea of the breakdown of where it is coming from . I just got the info from streetstats webite chart.
A podcast I listen too is bullish on stocks because of the increasing M2 supply. Also PMs. Currencies are being devalued.
US M2 has barely budged since 4/1/21. But there’ been a shift in deposit classifications since then. Transaction accounts have increased relative to time/savings deposits. This is contrary to Dr. Philip George’s “The Riddle of Money Finally Solved”. Instead of savings deposits going up when interest rates went up, savings deposits percentage of total deposits has gone down propelling the economy forward.
From the standpoint of the commercial banks the monetary savings practices of the public are reflected in the velocity of their deposits and not in their volume
Whether the public saves or dissaves choses to hold their savings in the commercial banks or to transfer them to intermediary institutions will not per se, alter the total assets or liabilities of the commercial banks nor alter the forms of these assets and liabilities.
What is to the advantage of a single bank may not be an advantage of the system.
Over 7 trillion-dollar deposits, deposits over 250,000, are impounded in the payment’s system.
Savers never transfer their savings outside the banks unless they hoard currency or convert to another National currency. The NBFIs are the DFI’s customers.
As CB’s all over reduce their Balance Sheets, those securities leaving the CB’s are not being paid off but are being reborrowed. The securities roll off the CB’s balance sheet and replaced in the market with new issuance.
This must be draining liquidity from everywhere ? Is this correct ?
Of course the FED now has it’s Repo facilities in place to deal with any anticipated liquidity event such as occurred in 2019.
The FED is going to halt QT for Treasuries and continue rolling off MBS, but the US Treasury seems on track for 2 trillion in new issuance along with the rollover of existing debt in ever increasing amounts.
I’m thinking that 3% inflation will be the new 2% as the FEDS target. I cant see how it can be otherwise. If the FED can succeed in holding to the 3% level we should perhaps salute them for a job well done while we wonder when 3% will become 4%
There is a large peak in money flows in November. It strikes me as being similar to July 2008.
Is it just me or is it odd that China’s graph barely moved higher after COVID?
All I want for Christmas is a Rate Cut and resumption of QT.
Rate hike*
Too restrictive.
The government debt growth and inflation must be curtailed at some point. Easier now than later. Do you see that?
3.75 is restrictive? nonsense.
What is being restricted? Stocks, real estate, food prices, rents, mergers, ??
Perhaps there is a downtick in a few of these, but taking over the past 4 years, what is the net in price increases? Way over the fabled 2% per year…and that itself IMO is reason NOT to cut.
The “acceptable” 2% price increase trajectory from 2021 is well below current price levels. THUS, by the Fed’s own metrics, we are at “unacceptable” price levels. Cutting is placating the Wall St gunslingers….the same ones bailed out in 2009
Wolf, what do you see as the factors that fuel the “ravenous demand for Swiss francs” ?
Some profit motive. Hedge funds and foreign exchange traders are all over them. They’re very heavily traded in the foreign exchange markets, the currency of a tiny country! It’s kind of like cryptos. People will engage in anything that they think will make them money.
“Central banks should not be allowed balance sheets.”
The purpose of Central/Reserve banks originally was TO HOLD THE RESERVES OF ALL THE OTHER BANKS. Why? (a) So that the reserves (gold) could not be stolen in a robbery, and more importantly (b)
so that each bank could not cheat on the amount of reserves they possessed. To fulfill this purpose, central/reserve bank’s holding of reserves (gold, “safe” bonds) by necessity would constitute a “balance sheet” of assets and liabilities.
I think that what OP meant to say is that “Central banks should not be allowed to expand reserves willy-nilly to cover up other bank’s loan losses”.