The series, started in 2017 to document visually the surging home prices amid the Fed’s interest rate repression, will now get bigger and better.
By Wolf Richter for WOLF STREET.
We’ve been using the Case-Shiller Home Price Index since about 2017 to document visually metro-by-metro the surge in home prices that was starting to occur at the time, amid the Fed’s interest rate repression that had started in 2008. We called this series, “The Most Splendid Housing Bubbles of America,” and we’re still calling it that today to visually document this phenomenon that went into high gear during the free-money era between March 2020 and mid-2022 when prices were nearly irrelevant because money was nearly free, with mortgage rates below 3%.
But we’re going to switch data sets. The Most Splendid Housing Bubbles we published on August 27, when the Case-Shiller data was released, was the last one using the Case-Shiller data.
We like the Case-Shiller methodology of “sales pairs” a lot. But it comes with three massive drawbacks that we’ve gotten really tired of, and now there are alternative data out there that move roughly in parallel with the Case-Shiller but don’t come with the drawbacks.
The three big drawbacks are:
- It’s limited to just 20 metros in the US and excludes even huge metros such as Houston and Philadelphia.
- It lags so far – 3 to 4 months – as to become essentially irrelevant for current market observers.
- It is not available in dollar-prices, but only index values (the index for each metro was set at 100 for the year 2000), which makes it impossible to compare price levels in different metros.
The Case-Shiller data are three-month moving averages of sales whose property deeds had been entered into public records months earlier. For example, the Case-Shiller data that were released on August 27 were three-month moving averages of property deeds that had been entered into public records in April, May, and June. The deals were made well before then. So the lag by the end of August, when the data was released, was roughly three to four months.
The Case-Shiller index was developed by a small group of economists — Karl Case, Robert Shiller, and Allan Weiss — and was made commercially available in 1991 by their startup, Case Shiller Weiss. The company was acquired by Fiserv in 2002. CoreLogic then acquired the index business from Fiserv in 2013. Today, the index is published by S&P Global and is called the S&P CoreLogic Case-Shiller Home Price Index.
The main thing that changed was that the index used to be set at 100 for 1990; and that was later shifted to 2000, which is still the case today. The index was neither expanded to encompass more metros, nor was the data gathering and publication accelerated to reduce the lag. So, adios.
The “raw” Zillow Home Value Index.
Zillow makes available many different combinations of its data in its Database of All Homes.
We will be using the backward-looking Zillow Home Value index or ZHVI. Zillow also produces forward-looking estimates of future home values (the Zillow Home Value Forecast or ZHVF), which we will not be using.
The ZHVI is based on millions of data points in its Database of All Homes, including historical transaction prices of closed sales from public records (tax data), MLS, brokerages, real-estate agents, and individual households across the country for properties. It includes pricing data on off-market deals and for-sale-by-owner deals. The Database of All Homes also has all sales pairs.
In Texas and some other states sales prices are confidential and cannot be disclosed and are not disclosed in the public records. So Zillow’s listings of homes in Texas don’t show transaction prices, unlike in other states. But Zillow has this pricing data through its membership in the local Realtor Associations and MLS. And members are allowed to use this data to show market information, such as price indices. In addition, Zillow uses the other data in its Database of All Homes.
The ZHVI data comes in many different cuts: We will use:
- “Raw” instead of “seasonally adjusted three-month average,” because the raw data reacts the fastest to market changes, though it can be a little more volatile.
- By Census Metropolitan Statistical Area (MSA), instead of City or County (Case-Shiller also uses metros but they don’t always conform to the MSAs).
- “Typical homes” for each MSA, meaning the weighted average of the middle third of homes that sold in each MSA.
- Of single-family houses and condos combined.
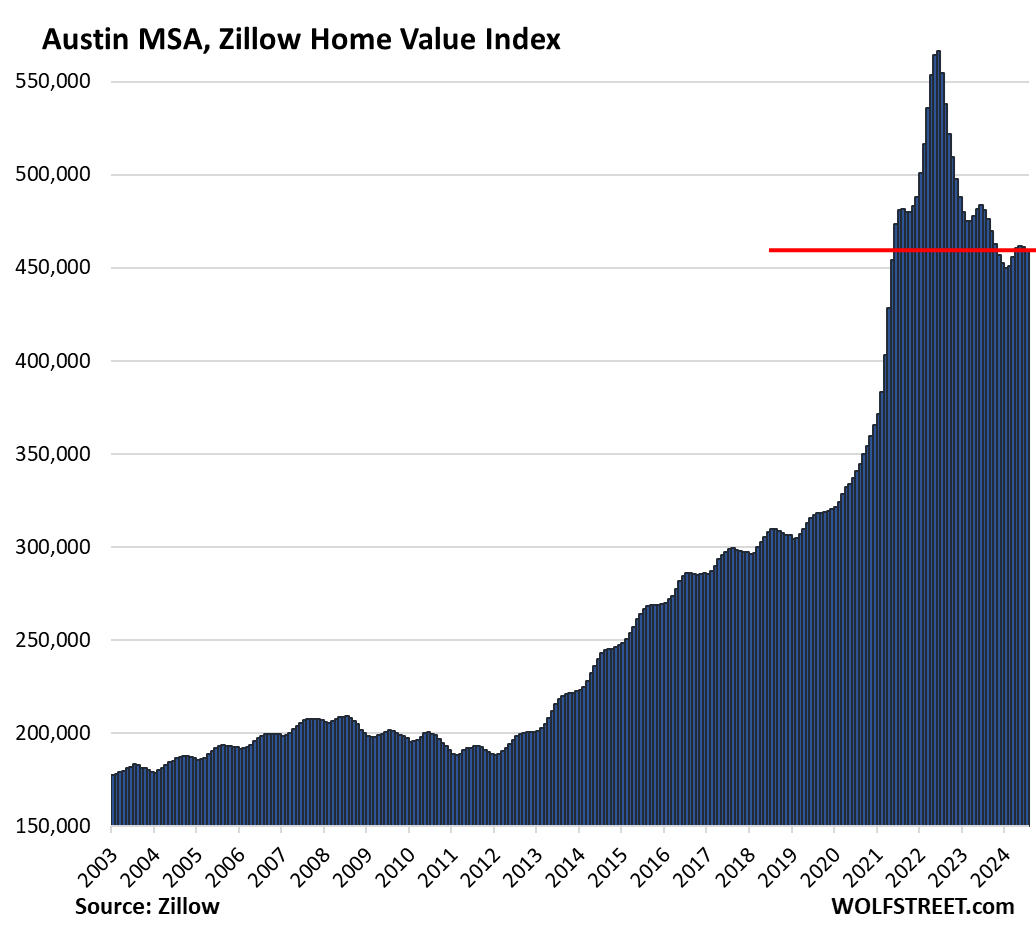
For example, the “raw” ZHVI for the Austin MSA shows the “typical home value” (middle third of homes) in dollars. It includes single-family houses and condos. This July data was released earlier in August. In about two weeks, we’ll get the August data. The price of the “typical home” dipped by 0.4% in July from June to $460,000, is down by 4.6% year-over-year, and by 18.9% from the peak in June 2022.
Case-Shiller doesn’t have Austin among the 20 metros it covers, doesn’t show prices, and for the 20 cities it does cover, we’ll have to wait patiently to fully see the July price movements.
Enjoy reading WOLF STREET and want to support it? You can donate. I appreciate it immensely. Click on the mug to find out how:

![]()
Looking forward to see the next time you publish this new data set, what it will look like for LA and SD, hopefully it won’t be a disappointing re-enforcement to what case-Shiller is showing, which is never ending up and up..
On another note, it’s crazy to think you started to document this as a bubble back in 2017 and seven years later, we have never been more insane in any fundamental metrics..funny thing is one can argue even before 2017, price was already kind of bubbly in certain areas but compare to now, it’s downright affordable…..hopefully this bubble will burst one day and not turn out to be one of those inflation is transitory call
This time is different, eh PI?
Clearly, at least Wolf’s Wonder IS going to be different from this time on.
Wolf for FED chief!
( Definitely just joking…)
Haha yeah I have been told how many times by friends and family this time is soooo different and how SoCal will also be different because of XYZ reasons..
So far they have been right, would love to see the narrative flip at some point so I can return the favor and look back at them with contempt on why I chose buyer protest
I know right. Any day now gas is going to drop back to 27 cents a gallon, milk to 83 cents a gallon, eggs to 60 cents a dozen, home prices are going to crater back to a median of $7,300, and an ounce of gold back to $40 again. Me and you both bother. We’re going to get the last laugh for sure. My bank account will be laughing with us. You know the saying, what goes up, must come down. Heat rises. All good thing come to an end. A fool is born every minute. A fool and his money are soon parted. I can’t wait for this bubble to burst, we all know it’s coming. Things always return to normal. It’s the greater fool theory.
Hey, I’m just hoping beer goes back to 2019 prices. A 40% increase for a damn beer is ridiculous.
Explosive credit bubbles do have a tendency to drive asset prices both up and down as show at numerous times in just the past couple decades and many more times throughout history. Commodity prices are another story, but those sometimes also deflate as companies get taken over at a lower cost basis in bankruptcy.
They think its different because mortgage delinquencies on 2-3% mortgages are not rising. No one here believes the tax man wont take your home or the tornado wont destroy your uninsured home. Its more indirect this time, but the value will melt away due to these factors. Nobody in the middle class wants or can afford to pay 9-10% taxes on a $1.5m 2br starter home.
The obfuscation of truth would be bad enough if we weren’t constantly gas-lit in our search for it. Many hearty thanks to Wolf Richter for creating a space to discuss these things without either.
Maybe I should have posted these charts in the article: So here is the San Francisco Bay Area as depicted by three different methods, plus the city of San Francisco.
1. By the California Association of Realtors — median price, single family, entire 9-county Bay area, including the San Jose MSA (includes a big part of Silicon Valley), which is a different MSA than the San Francisco MSA and has different pricing dynamics:
2. The City of San Francisco – median price, C.A.R., single-family:
3. San Francisco Bay Area Case-Shiller Home Price Index (five counties: San Francisco, Marin, Contra Costa, Alameda, and San Mateo), single family:
4. Raw ZHVI for San Francisco MSA, single family and condos:
Thanks. Now we just need LA and San Diego to start looking like SF, hopefully your data will show that soon enough
This will be “right from the oven” reporting on the housing market.
Even brer rabbits ears are pricked in anticipation of this offering.
Pink Floyd…there is no dark side of the moon really.
You can download the zhvi yourself! It’s publicly available:
ALL data I use anywhere anytime are publicly available. Anyone can download them. I never use any secret data.
I bet SoCalBeachDude will say the Fed doubling its balance sheet from $4.5 Trillion to $9.0 Trillion in 2020-23 has nothing to do with housing prices doubling in 2020-23.
And calling for gold to go to zero. Maybe he posts from his shopping cart home on Venice beach?
Gold has its ups and downs but over time, it has pretty much appreciated the same as Government debt. LOL
Who would have thunk!
“it’s crazy to think…”
That another fairly huge RRE bubble, with many of the same dynamics (ZIRP) could get started so soon after the worst (and most thoroughly documented) RRE bubble pop of all time – 2008.
Fewer people got swept up transactionally in this one, but even if it is just 60% as many, it is like *zero* was learned in 2008…by 2013.
And then you real about Houston Applesway – floating-rate, suicidal syndicated newbie landlords causing huge real collateral damage to essentially innocent renters…and it seems like things have gotten *worse*.
“what it will look like for LA and SD, hopefully it won’t be a disappointing re-enforcement to what case-Shiller is showing, which is never ending up and up..”
It will be slightly down, but I hope you’re not expecting it to refute what CS has shown about SD and LA. The only problem with Case-Shiller as regards San Diego and Los Angeles is the lag. Its representation of the pricing trend there over the last year and a half, roughly since the Great Fed Chicken-Out over the banking nanocrisis, has been accurate: prices in early 2023 reversed their slight slide, shot back up to their previous peak, and then passed that peak, at least by a bit.
This is an excellent change. Have you considered peeling back the data related to the ratio of incomes to price levels? It would also be helpful to see price levels relative to consumers net worth.
No, that’s not the purpose. Then you’d also have to factor in mortgage rates, property taxes, and insurance. This is not an affordability study.
There’s a tool by the Atlanta FED that sort of factors that to create a “Home Ownership Affordability Monitor (HOAM) Index.”
https://www.atlantafed.org/center-for-housing-and-policy/data-and-tools/home-ownership-affordability-monitor
Nice data. I have never seen this site and data before.
I did a 3 day rabbit hole dive a few years back as to what metros first showed up in the 2008 crash. It was San Francisco followed by Boston and both were lead down by tech sector layoffs.
I remember buying in the UK in 2004 and it was crazy, our specific home transacted 18mo earlier at about 65% of the price we paid.
Looking back it was like a golden era relative to affordability for young people today.
Young people in Austin must be asking for 2x pay vs 2020?
Those fortunate to be buying in the late 90s in the UK have largely been fine as they carried equity through their lives and had cheap credit, so high house prices aren’t such a big issue.
I’m not sure how things look in the USA, but in the UK I’m just not sure there’ll be sufficient equity or earnings wealthy people coming through to buy up the boomers properties at these price levels.
It’s a smaller generation who’ve had less quality pensions and been late into the market with less equity and more debt.
I just don’t know how they’ll keep the wheels on the bus this time unless they find a way to give away money without associated inflation.
Sadly US have this beast call 30 years fixed and in Cali Prop 13, which ease a lot of pressure for people to sell in a downtime or reduce churn especially if you have low mortgage and your property tax is still low..
Moral of the story is, US is even more titled towards timing and luck, kind of like a lot of other things in this country. Get in at the right time, I got mine and F everyone else
How exactly would we, who got in early, be civically minded and make this sacrifice for our fellows, even if we were foolish enough to try? If I sold my home at a steep discount, I could not buy back in, so I would just trade places with whoever I made this gift to. So I would be a non-owner with not enough for housing. My Mom would be homeless at 90+, for such folly. I’m no tax expert, but I wonder if the IRS would look askance at it too: a gift, if so far from market values? I took my risk when I bought in: I could have suffered problems at any point in the 30 years of mortgage that just elapsed. I hung on and paid my bills and taxes faithfully, I took my risks and reaped the rewards.
How to be civic minded? How about support more QT and ending QE/rate suppression forever. Then the whole level of prices goes down, not just your house. Then you could find another affordable house if you chose to leave and others who’ve never bought but have been saving can afford a one.
Don’t think about individual action for this; organize to repeal Prop 13.
Repealing Prop 13 would be a strong start.
As others have pointed out, this is not about individual action but rather a collective policy change so it’s not so lob-sided favoring one group over others. The cost to society especially to the younger generation is huge when it comes to prop 13 and 30 years fixed mortgage, churn is a good thing maybe not so if we want to create more inequality in society, think we do a pretty fine job already..
“How exactly would we, who got in early, be civically minded and make this sacrifice for our fellows, even if we were foolish enough to try?”
I am a homeowner and I support higher rates and QT. Other people should be able to buy homes too.
“How exactly would we, who got in early, be civically minded and make this sacrifice for our fellows, even if we were foolish enough to try?”
Chiming in a little late, but I’ll tell you how I try to be civic minded in this housing market.
I’ve been a small Mom landlord for many years and have consistently charged below average market rents. (Note: many tenants are horrible, and do not deserve below average market rent)
I have a small 3 BR rental house. The tenants in the house have been there for almost 12 years. They are a nice family with 2 children, one with special needs. The H is a carpenter who does minor repairs to the house, mows the lawn, and clears the snow. The W is very tidy by nature so she keeps the house very nice. If the house needs maintenance or repairs, they are very helpful and cooperative.
Because they are such good tenants I’ve only raised the rent once in 12 years (5 years ago) and that was to cover the cumulative increases in taxes and insurance. Shortly after the rent increase, they applied for a rental assistance program in town which required a bit of paperwork from the landlord. I was the first landlord who agreed to participate in the program (apparently several had previously refused).
Recently their rental assistance was increased. I have not raised the rent, might do so in a year or two since taxes and insurance are still creeping up, but for now they receive the full benefit of the assistance. They effectively pay less in monthly rent than the lowest market rate for a 1 BR in the Boston metro area.
I’ve learned as a landlord that if you have a good tenant, you try to hold on to them. If they moved out, I would sell the house. Most tenants are not like this nice family and I’m sick of being a landlord.
Lower rates incoming and maybe a 25k tax credit to first time home buyers. Fed and gov pulling out all the stops to keep housing prices juiced. Need to make sure all the retired 60 somethings see their asset prices continue to climb. Oh the humanity if we saw a real correction in housing prices.
In the UK we had this kind of stimulus during the pandemic and it just added the equivalent of $25k to an average homes prices, thus it provided no benefit to first time buyers.
“Lower rates incoming”
Maybe not lower mortgage rates. They already plunged by 150 basis points over the past 10 months, pricing in a bunch of rate cuts though we haven’t had a single rate cut yet, and now sales have collapsed entirely despite the much lower mortgage rates.
A 25 BP cut is going to pull them down towards 6%. How far they fall after that is entirely dependent on upcoming data, but personally I don’t see anywhere near 150 BP over the next 10 months without a recession. And I don’t think we’re teetering towards a recession. There’s too much demand from new residents & deficit spending. I agree with your previous head fake analogies that suggests a 1976-80 redux is coming.
Six cuts are already 100% priced in everywhere. So it could very well be that long-term rates stop falling or start rising, while the Fed cuts, esp. if inflation starts ticking up again while the Fed cuts.
In the last couple years the 10YTsy-30YFM spread has gotten wider. Also, lower fed funds rate doesn’t mean rates on duration will fall further. Term premium is already quite negative.
An the same thing will happen in America…
Just like the $7,500 tax credit for buying a EV and Detroit raise their prices by the same amount…
What’s your source for this assertion? Tesla, for example, has lowered – not raised – their prices since 2023.
Ford did hike its prices for the F-150 Lightning and Mach E in late 2022, but then had to cut them again when Tesla started cutting prices. Tesla’s price cuts were exactly what the consumer needed.
https://wolfstreet.com/2022/12/16/ford-jacks-up-price-of-f-150-lightning-for-3rd-time-since-ev-incentives-what-you-get-for-subsidizing-products-already-in-hot-demand-short-supply/
@read old papers. I think the general idea is that competition is the “right” force to put pressure on prices. But government incentives can easily lead to the opposite of what’s intended.
While the EV tax credit is intended to make EV’s more affordable, it can sometimes lead to price increases due to market dynamics and manufacturer pricing strategies. The availability of the tax credit can boost consumer demand, and the perception of the credit as “free money” might encourage buyers to opt for more expensive models or additional features. This can drive up the net price consumers are willing to pay, indirectly supporting higher average transaction prices for EVs.
You obviously haven’t been out there getting bids for solar on your roof.
The #1 every co tractor keeps reminding me is that there’s a 30% tax credit.
And there prices definitely reflect that added 30%.
It goes without saying, the credit will get absorbed into higher prices where there’s demand over supply.
Sounds like ASHP boilers/heating in the UK.
Lots of incentives/grants, but also seemingly ludicrous pricing.
Ie, you can buy/fit a natural gas boiler or kerosene boiler for 1/4 the price of ASHP.
Essentially government just feed money via taxation into chosen winner businesses.
Sadly these businesses aren’t worth the debt used to subsidise them.
The system of incentives appears quite crony in its nature.
Government surely know this happens?
Going a bit OT now so to bring it back on track regards house pricing, support is likely to just act like market stimulus.
As always it feels like the longer denial runs, the worse it is when the issue asserts itself.
Thanks for looking forward, Wolf, and for your continual efforts toward even better reporting of these datasets.
The Austin chart looks like an irresponsibility meter measuring the likely disruption that Fed rate interventions were likely to produce.
State interventions in interest rates continue to be the modus operandi of our unelected economic technocrats. “Managed money” has failed to stabilize the economy, and has enabled “debt out the wazoo.”
With a 20 year housing chart, why not use a log scale instead of linear?
It is sad that we even would consider a log scale
Log scales hide and falsify the visual information. If you want to show that home prices didn’t go up much, despite what you see on the ground, then use a log scale.
ONLY FRAUDSTERS USE LOG SCALES FOR HOME PRICES.
Only morons who don’t know what log scales are and do propose log scales for home prices.
Log scales serve their purpose in engineering but not in visual depictions of home prices.
It’s sad that I still see this BS on this site after all these years.
This website would be so much better if you got over your shyness and told us what you really think!
Haha I used to use log scale to show how good my demand planning forecast was.. once I used more normal chart methods, MAPE didn’t look so good..
Here is the thrust of the argument on using log scales: If a house price goes from 100 to 200, is that the same as when the house price then goes from 200 to 400?
Log says yes. Each is a 100% gain.
Wolf says no. An increase of 200 is bigger than 100 you idiot.
Depends on your point of view. Each side will claim intellectual superiority. It’s Wolf blog, that’s the bottom line.
Cookdoggie,
You didn’t get the point. These charts are NOT percentage changes, but dollar-prices.
You don’t put a chart of Apple’s share price on a logscale either!!! What is wrong with you people?
Elaine: I will never understand people.
Jerry: They’re the worst.
Thank You Wolf!
There’s no reason to measure house prices in log10 scale, that makes no damn sense. But neither does this comment.
The issue you are citing is normalizing everything to the initial value (percent gain). Not log.
I agree that each is 100% gain but Log (200) is not equal to Log (100). Whoa.
Most people think equal distances represent equal values. Plebs like me appreciate linear scales.
An appropriate use of a log scale is the Richter scale.
Why? because the variations in earth quake energies vary so greatly they make house prices over a decade or two almost constant by comparison. We think a doubling of house prices is a pretty big deal. A simple doubling of quake energy is too small a change to be of any difference in its effect.
Oddly the R scale can go negative, to minus 3. The US Geo Survey describes this as the energy of a fire cracker exploding a mile below the earth’s surface. At the other end in our experience is the nine, which destroys a city.
We also measure sound pressure levels (decibels) in log.
But definitely not home prices.
% up & down is how to express price movement independent of the base price. No need for log scales.
Accounting “down to a gnat’s eyelash.
In my opinion, the biggest step forward with this data is minimizing the lag. However, the biggest price laid is losing the sales pair method. That much better controls for mix.
Could there be significant impacts to the “middle third” method because of an overall up- or down-shift in the level of homes being bought?
I’d appreciate seeing a lag-aligned comparison (e.g., shift in the Zillow line a couple months back to align closer to CS timing) by market to understand how big of a difference these methods drive.
Compare the charts that I posted in my comment above. You will see that the Case-Shiller for the 5-county San Francisco Bay Area single-family is very close to Zillow’s San Francisco MSA single-family and condos (though the geography is not exactly the same, and though CS is only single family while Zillow is single-family and condo).
Zillow has the sales-pairs data in its Database of All Homes, and they’re part of its pricing dynamic, but they’re not the only factor. Which is why I believe Zillow’s all-encompassing data base is superior to the low-budget solution from 1991.
The CS makes some big assumptions by adjusting via formulas for home improvements and by its weighing of the sales prices based on when the prior sale occurred. For example, a sale of a home that last sold 10 years ago (with a 100% price increase) will weigh a lot less than a sale of a home that last sold a year ago (with a 10% price increase). This brings some distortive effects with it. Nothing is perfect when it comes to home price indices. And we’re not leaving behind a perfect index.
This is because housing is not a fungible commodity like oil, or wheat or gold, although people talk about it and try to trade it as if it were.
True! Nothing is perfect when it comes to home price indices, and whatever you use is depends on your particular needs. This shift is useful for my needs, even if I still would like to see the three month moving average and its comparison year to year. I would not be surprised to see Zillow incorporate such a statistic in their collection. Thanks Wolf!
1. Zillow has a whole bunch of data sets, including three-month moving averages (I could also do my own three-month moving averages), but it increases the lag and it’s not needed because the “raw” mid-tier data set isn’t that volatile, as you can see in the two charts I provided (Austin and San Francisco). I’m tired of lagging data.
2. You will still get the numbers for YoY, MoM, and from peak for the current month. I might occasionally (but rarely) supplement one or the other metro with a year-over-year chart, if it makes sense. There are going to be a lot of charts already, so we’re not going to post 60 charts – that would be way too many. Everything gets triaged here. This is not an all-you-can-eat salad bar.
Excellent piece, Wolf.
This definitely sounds like a worthwhile switch.
One technical question: You wrote “‘Typical homes’ for each MSA, meaning the weighted average of the middle third of homes that sold in each MSA.” What’s the weighting factor?
Well done, absolutely a move in correct direction. Dumps the lag & dumps seasonal adjustment. Only trade data source that’s valid is tax record, where available. Zillow flawed, all MLSs flawed. Resigned that rental data always has been & always will be garbage – nothing’s recorded. Appreciate Wolf’s effort in a more correct direction. Yun will remain clueless. God bless America. TFS
Broker since 1980,
You’re reading is flawed. Read what I said about the type of data that is included, including public records (tax data). So yes, RTGDFA
I read your pieces but for the most part, I probably don’t get the full import. That said, do you ever attempt to explain why the housing markets appear to be so volatile? My impression is that simply letting the market go wherever it wants to go is wildly irresponsible. The 2008-09 bust up was ridiculous. The private market simply did whatever it wanted, and what it wanted was to screw the average citizen. Not a good way of going about things, IMO. Anyway, thanks for the info.
Tax/register of deeds records aren’t perfect. In NC you pay revenue tax (tax stamps) on recorded deeds and the individual filing can claim any price they want. There is no proof required. Sales price in NC tax records come from the dollar amount paid in revenue tax on the deed, hence $500 in revenue tax would infer a $250k sales price. But it isn’t at all unusual to see listed homes show a closing price in MLS substantially higher than revenue tax would infer.
TL;DR Assume every metric and source has issues. At least Zillow can provide most all relevant sales data from each source.
Bit on Politico about how fall in office towers’ price is worrying smaller regional banks. But in its list of horror stories it includes one that sold for 5 % of former appraisal. Thanks to WS I realize that this is no doubt one on leased land, so only the building sold.
Am I seeing a head-and-shoulders top in the chart above?
Alzo, how well does the sales-pair method work when their is not a lot of turnover? Low active listings can further distort the numbers, leading to volatile pricing can also skew the statistics.
Sigh,a cash buyer who is looking for acreage(20 min.) and a small modest home,tis the land I want but as a carpenter refuse to build to new specs required thus just a land buy not a option unless unincorporated township.
I also refuse to pay flu pricing,guess I am on strike.
I wonder if I will ever buy at this point.
A factor that will distort all home price data is that existing-home sellers are now buying down mortgage rates to get their homes sold, in the same way as new-home builders.
I see homes listing on Zillow where the listing price was, e.g., $650k and the final closing price was $700k, in the suburbs of Chicago where there is almost certainly no “multiple-offer” competition (other equally attractive homes listed in the same suburb in same price range).
Ironically, though the buydowns are probably only for a few years, meaning that the buyers are expecting to refinance at a lower rate in a few years, if home prices decline they’ll be unable to because the lower price won’t support the amount they’re going to be trying to borrow.
But for now these artificially inflated selling prices are going to distort the statistics and the “comps”.
jm-
Good point about refinancing risk. That’s not discussed much.
Similar to reinvestment risk faced by t-bill buyers… also discussed very little.
How exactly are existing home sellers buying down the purchaser’s mortgage? Is it written into the closing somehow?
Housing prices are falling by the tens of thousands per hour in the Portuguese Bend and Seaview areas of Rancho Palos Verdes today as their gas and electricity are shut off and prepare to evacuate orders are issued for over 100 houses in Portuguese Bend as it slips into the Pacific!
Still doesn’t mean much consider how expensive that area is. Plus this is a short term thing, Rancho PV is an area I would expect any meaningful downward trend in price in this century sadly for any potential buyers not looking to overpay
Its great to get latest data instead of 3-4 months lagging data. I understand the analysis and can see the Bubble from 2013.
But I sees this bubble chart and look at last 10 years and feels hopeless. If it doesn’t burst for decade, can we call it a bubble?
May be FED made this permanent through ZIRP and QE.
Now they will be cutting soon. Even though FED doesnt control the Mortgage rates directly, Financials conditions have eased quite a bit. 10 yr has dropped by 100-120 points already. Stock Markets are all time high. So have Mortgage rates. Most of the inventory built up in my city vanished in last 2 weeks. So there are signs of pent up demands.
Even with Raw ZHVI for San Francisco MSA, single family and condos: data, I can see small drop in SF Bay Area prices.
I like we are getting latest data and can see latest trends. I will be more happy to see a lot of correction in Residential Real Estate.
Now you can directly compare dollar value of whatever a “middle third” home is supposed to mean between different MSAs to give people some perspective and silence the constant bickering about real estate market reports being “fake news.”
As a licensed realtor in San Diego and a BSBA holder, I thank YOU Wolf for all your diligent work keeping me dialed in. I look forward to seeing how this new ZHVI data and your analysis will differ.
This website had the best charts for home rices and it appears future charts will be better.
Was any consideration given to the FHFA HPI, a weighted, repeat-sales index, that measures average price changes in repeat sales or refinancings on the same properties?
It measures changes in single-family home values based on data that extend back to the mid-1970s from all 50 states and over 400 American cities.
It’s only single-family homes with mortgages purchased or securitized by Fannie Mae or Freddie Mac, but could be useful for comparisons with other measures.
It’s similar to Case Shiller but less volatile
https://static.seekingalpha.com/uploads/2018/9/26/saupload_CS-vs-FHFA-YoY-SA-f_thumb1.png
Yes, and I threw it out because, as you said, that data is limited to prices reflected in certain government-backed mortgages. So it’s just a sample, not a universe, and it’s a systematically skewed sample because it doesn’t include cash deals and non-government-backed mortgages. So it’s useless as a measure of the overall market.
I think the home buying and car buying frenzies have lost lots of momentum.
I was looking at used cars on Craigslist this week and was surprised to see a huge number of cars advertised as lease takeovers. These sellers expect somebody to step in and take over their lease payments and terms, in a cashless transaction. Go on Craigslist and check for yourself.
That smells like trouble to me. People bought cars with leases they cannot afford. Now they expect some other dupe to take over their problem.
It begs the question, how many dupes recently bought houses they cannot afford? I smell lots of buyer remorse from those who bought homes in 2021-2023, expecting prices to continue spiking up. The mortgage payments on these properties is huge at 6-9x income in many cases. Some of these buyers also saw RE tax and insurance bills skyrockets the past 2-3 years.
At the long end of a bubble, it pays to be conservative and control your FOMO.
I use the term dupe endearingly, now that the Fed has turned most rational investors into dupes. Senseless speculators have done very well in an era of senseless QE policy.
You call them dupes, I call them lemmings..this might be a start of a turning point or it might be proof in the pudding that “This time is different..” One thing that both camps cannot deny is that the FED policy since 2012 normalized and emboldened speculation as the only way to win…in some way I don’t blame these lemmings for glowing in the sun so far thinking this is the way it will be forever.
How else can you explain the Fed’s action in buying up so much MBS to drive mortgage rates down to the lowest in recorded history because of the pandemic? Treating the RE industry as an essential worker/industry for what? Even now, as Pow Pow publicly stated young people deserve to have a market reset, yet is still wayyy higher compared to 2019, even if it does take time to correct, it sure doesn’t give people a lot of confidence this will happen at the pace things are going, if ever…
From an optic perspective and this is IMHO, savers and people who are prudent with their money rather than living on the motto of “We’ll figure it out somehow or fake it till you make it” seem to be the ones consistently getting their A$$ handed to them maybe except for the last 2 years with decent interest but perhaps even that’s starting to turn soon starting in Sept.
@Phoenix_Ikki there is a difference between buying something that is “overpriced” and being a “dupe” or “lemming”. When I bought my “overpriced at the time” current home in 2012 and I thought that prices were going to keep dropping, but I liked the house, I could afford it and since I planned to keep it forever and didn’t care if it was “worth” less next year (or even “worth less a decade later). I have never bought a new car but most of my friends like overpriced new cars, can afford them and don’t care that they are worth half what they paid when they trade them in.
The Federal Reserve is not doing QE but rather has been doing QT (Quantatative Tightening) for years. Blame to senseless speculators for the asset prices in the markets.
“These sellers expect somebody to step in and take over their lease payments and terms, in a cashless transaction.”
This sounds like an incredible deal to me! The ability to drive the new car for just the monthly payment, without the huge payment upfront!
Maybe…I guess… if the down payment was huge and there’s no buffalo sauce on the seats.
But let’s say the down payment was huge. Isn’t that even more reason to keep the car? Smells like YOLO regret to me.
What we need to be discussing is WHY is this absolutely foolish market called the housing market so absolutely distorted and irrational. $900K median home price in California – insane (that number is from a few months back). Is the economy so bad that certain policymakers feel compelled to keep home prices artificially elevated in order to make people FEEL wealthy? My perspective is that the current housing market is very sick and stagnant. Prices should be half of current levels. Probably ditto with the stock market. I just referenced an article from January that says 49% of real estate agents sold zero to one homes in the last year. If IHOP sells pancakes at 25¢ apiece, they sell like hotcakes, at $2.00 apiece, the buyers revolt. Currently, there is a buyer revolt in housing, and rightly so. Our financial wizards have so distorted housing prices, that we revolt/refuse to play the game.
Thank you.
Yes, the C-S data is quite lagged, plus the other issues you mention. I’m glad you could find a data set that addresses the C-S shortcomings.
Anecdotally, I’m seeing data indicating price drops, with somewhere in ’22 as a peak for this current housing bubble (2.0).
Yes, the Fed has been in financial repression mode since the GFC, until the “transitory” inflation that they caused started. They intentionally stimulated house and stonk prices as per the Ben Bernanke Wa Po Op Ed, Thursday, November 4, 2010. Another way to say this is that they blew a another, but more massive asset bubble: “The Everything Bubble,” aka “The Central Bank Bubble.” The Fed: Wile E. Coyote, Super Genius.
Most everyone enjoyed the free money and asset appreciation on the way up. Let’s see how they also enjoy the reverse of this “wealth effect.” on the way down. The bigger the boom, the bigger the bust.
banana republican-
You said: “They intentionally stimulated house and stonk prices as per the Ben Bernanke Wa Po Op Ed, Thursday, November 4, 2010.” Well stated, but doesn’t go back far enough.
Here’s one of dozens of prior examples:
“Alan Greenspan needs to create a housing bubble to replace the Nasdaq bubble.”
— Paul McCulley, Pimco, as quoted by Paul Krugman, “Dubya’s Double Dip?”, New York Times, August 2, 2002
And he Greenspan dutifully complied with the request!
Great approach, Wolf, makes great sense and the graphed data looks like has much the same shape as C-S. You are good with this data analysis stuff.
Good change. Zillow’s MSA makes a lot more sense, at least for Boston, than the CS “Boston metro” which is a weird georaphical area.
Thanks Wolf! Looking forward to the next update.
Thanks for the heads up on this data. ‘Nother homemade graphic shows my metro still going up. Playing catch up while everybody else catches down. Could be worse I suppose….
Wolf – huge fan of your data-driven analyses. Sorry to jump in an old thread.
As a data hobbyist I’ve built my own private dashboard of housing metrics to track these “splendid housing bubbles” myself. I pull in Zillow’s data (ZHVI) as well as some other public sources, namely Realtor.com and Redfin data.
Realtor.com unfortunately has nothing in the way of sales data. Redfin however has rich sales data, including median sale price at the Metro level (monthly). They also have their own repeat-sale pricing index, but I don’t use this as much since its an index and not a dollar amount, as you mention as well.
I find myself using Redfin data more than Zillow these days — I’m a fan of how much data they make available, and furthermore, I’ve been turned off from ZHVI since the whole Zillow Offers debacle and apparent failure of their “neural zestimate” which continues to make its way into ZHVI. That being said, the Redfin and Zillow data generally track the same anyways.
I digress — apologies in advance if you already scoured through all this before coming to your decision. Just figured I’d make my first comment on a topic I’m actually familiar with! Cheers
Redfin is useless for me. It only has data for metros where it is active, and you can see that in its blogposts, which point that out. In addition, from what I can tell, Redfin data only goes back to 2012. My data must go back to at least 2003 to encapsule Housing Bubble 1.