Huge undercount of immigrants since 2022 messes up employment data in the household survey. Census Bureau needs to adopt Congressional Budget Office’s population estimates or go home.
By Wolf Richter for WOLF STREET.
The jobs report data released today is based on two large surveys:
- The survey of “establishments” (employers): nonfarm jobs created (+206,000 in June), various hourly and weekly wage measures, and employment by industry.
- The survey of households: total employment, self-employment, part- and full-time employment, measures of labor force, labor-force participation rates, unemployment, six unemployment rates, employment-population rate, etc.
But the household survey data is wrong because the Bureau of Labor Statistics uses the Census Bureau’s population estimates, but the Census Bureau has so far failed to account for the huge wave of immigrants in 2022 and 2023, according to the Congressional Budget Office (CBO).
CBO came up with its own population estimates by combining data from Immigration and Customs Enforcement (ICE) with Census Bureau data.
CBO estimated that net immigration was 2.67 million immigrants in 2022, and 3.3 million immigrants in 2023, the highest in its data going back to 2000, and about triple the average rate between 2000 and 2021 (1.05 million immigrants per year).
But the Census Bureau has failed to account for the huge influx of immigrants. In terms of population growth:
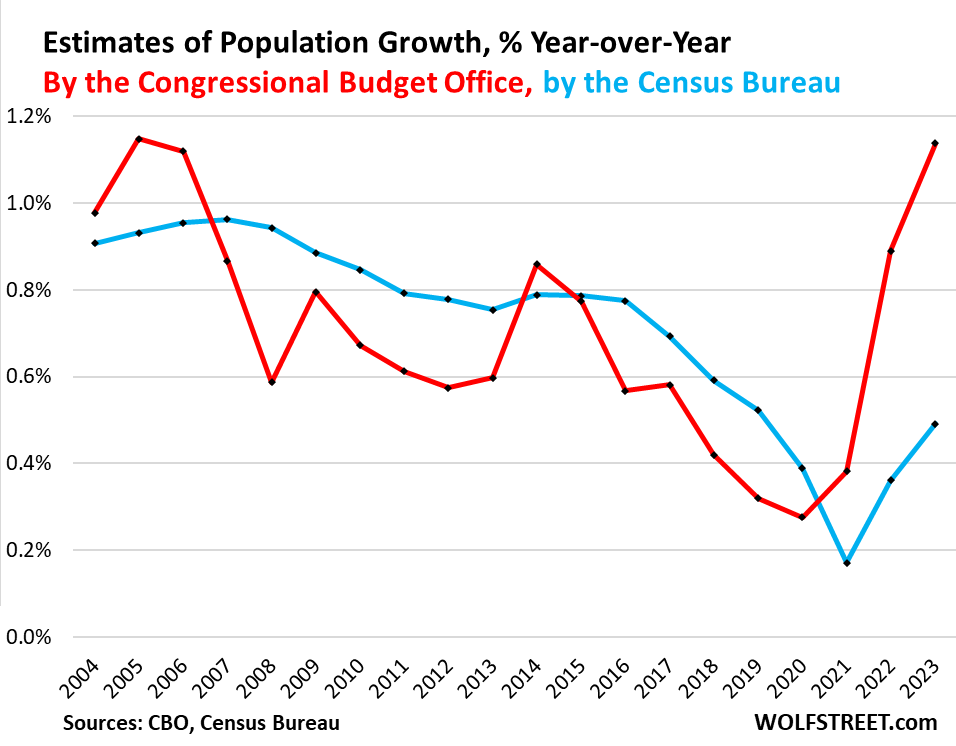
- CBO: +0.89% for 2022; +1.14% for 2023; highest since 2005.
- Census Bureau: +0.36% for 2022; +0.49% for 2023.
We discussed this at length here, including a chart of the two diverging population growth estimates.
Because the BLS extrapolates its household survey data to the understated population estimates by the Census Bureau, it understates total employment, and understates the labor force, and messes up all other metrics based on them.
So we will no longer cover the household survey data for that reason until Census corrects its population estimates. But we do cover the establishment survey: payroll jobs, wages, and jobs by industry.
The establishment survey: Job growth back to normal, wage growth still higher.
Payrolls at employers increased by 206,000 in June (blue in the chart). Over the past three month, including all revisions, employment increased on average per month by 177,000 (red). This three-month average, which irons out some of the month-to-month squiggles, is right in the middle of job growth in 2017 through 2019, the Good Times (horizontal purple line).
In other words, job growth has slowed from the frenetic pace after the lockdowns and labor shortages, back to the normal pace of the Good Times.
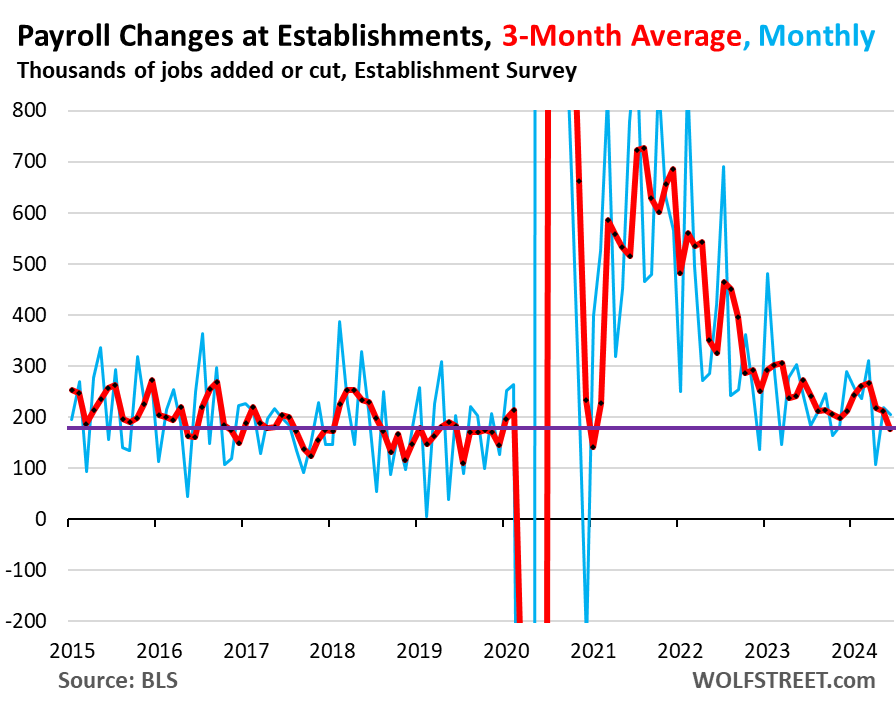
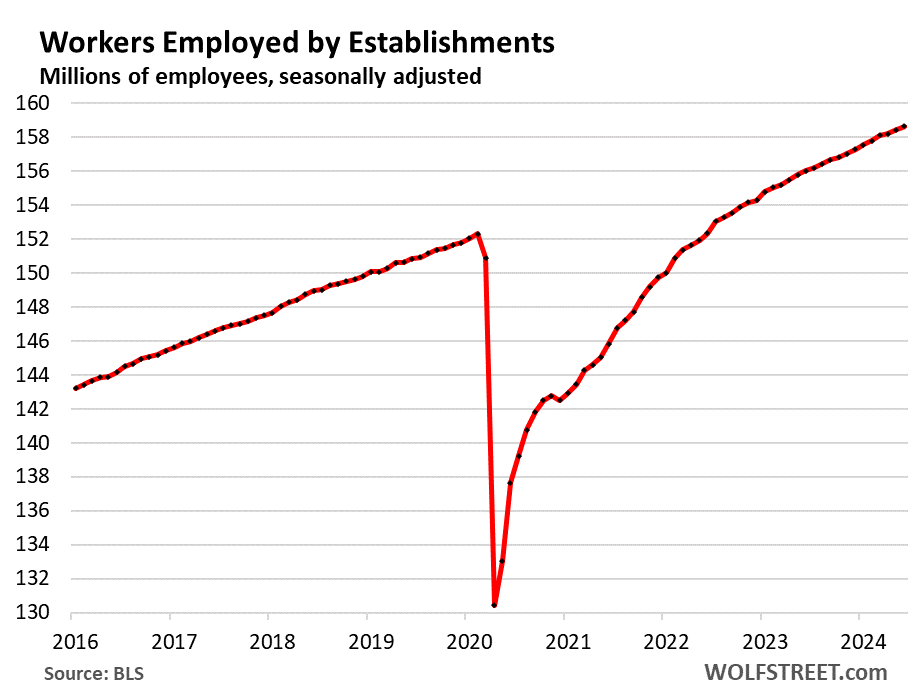
The total number of payroll jobs at employers rose to 158.6 million, a year-over-year increase of 2.61 million jobs (+1.7%).
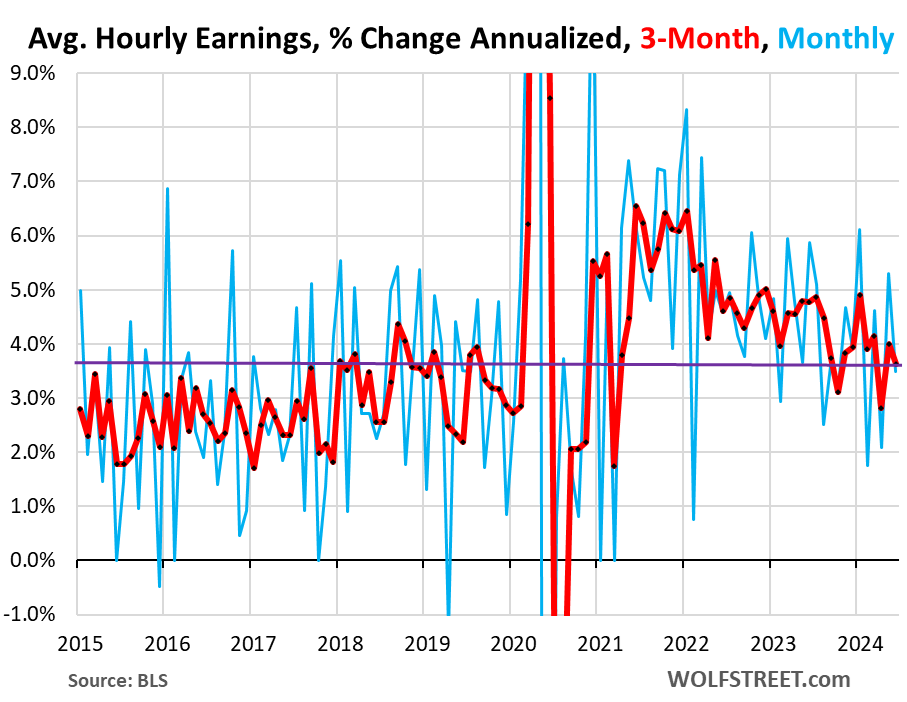
Average hourly earnings increased by 3.5% annualized (0.3% not annualized) in June from May. But May was revised up to an increase of 5.3% annualized, the biggest increase since January, and the second biggest since June 2023.
The three-month average, which includes revisions and irons out some of the month-to-month squiggles, rose by 3.6% annualized.
As we can see in the chart, there was a clear cooling in wage growth from red-hot peak growth at the end of 2021 until October 2023. Since then, there have been a lot of big month-to-month squiggles, but no clear further deceleration of the trend.
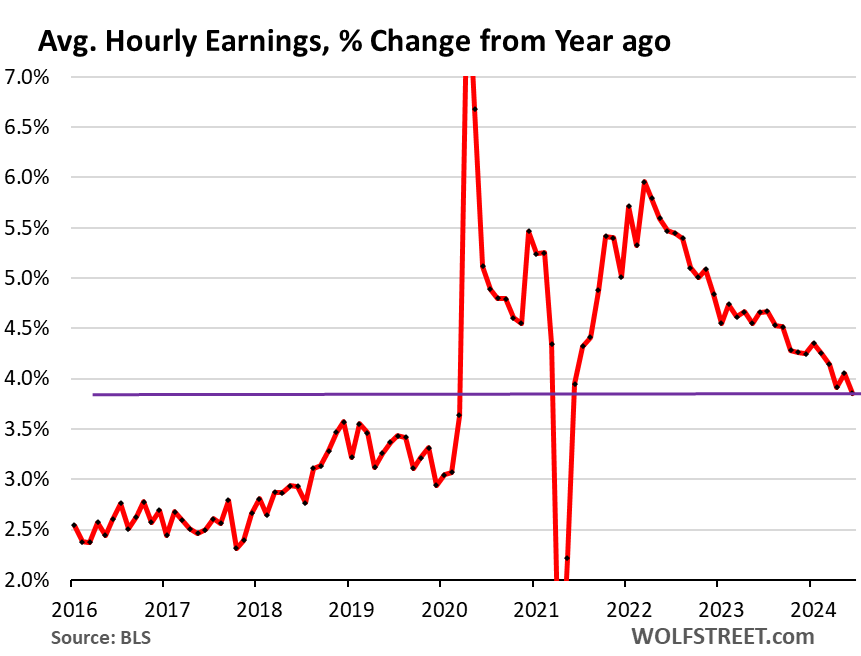
Year-over-year, average hourly earnings rose by 3.9%, and well above the five-year prepandemic range of 2.5% to 3.5%:
Longer-Term Trends of Employment by Industry Category
The industry categories are determined by work location. The surveys are sent to employer facilities. The primary activity at that facility determines the industry category. For example, a worker at an Amazon fulfillment center would be under “transportation and warehousing.”
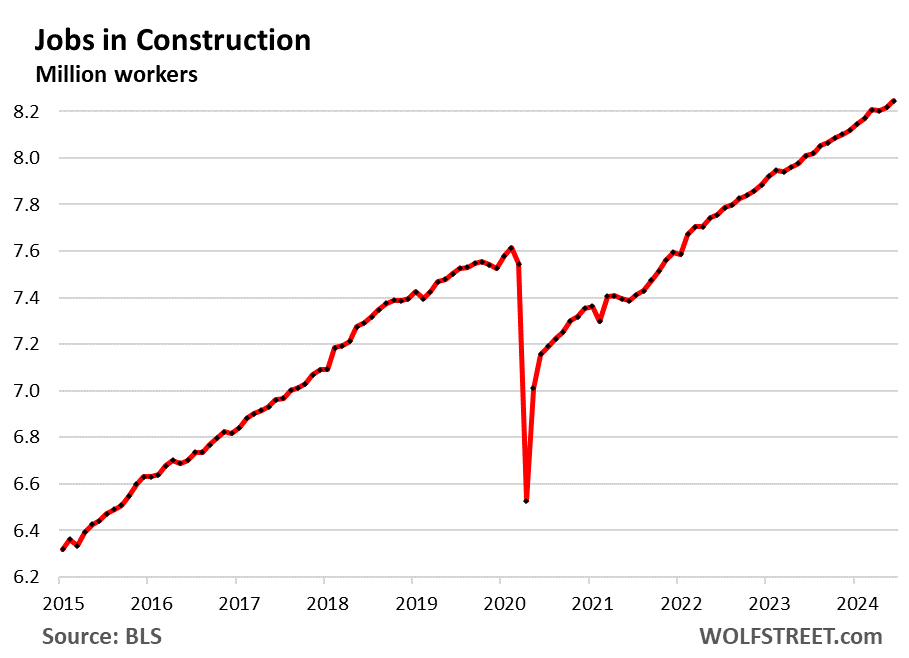
Construction employment (all types, from single-family housing to highways) rose to another record, with tight availability of skilled labor still a problem in some sectors:
- Total employment: 8.25 million, new all-time high
- Month-to-month growth: +27,000
- 3-month growth: +38,000
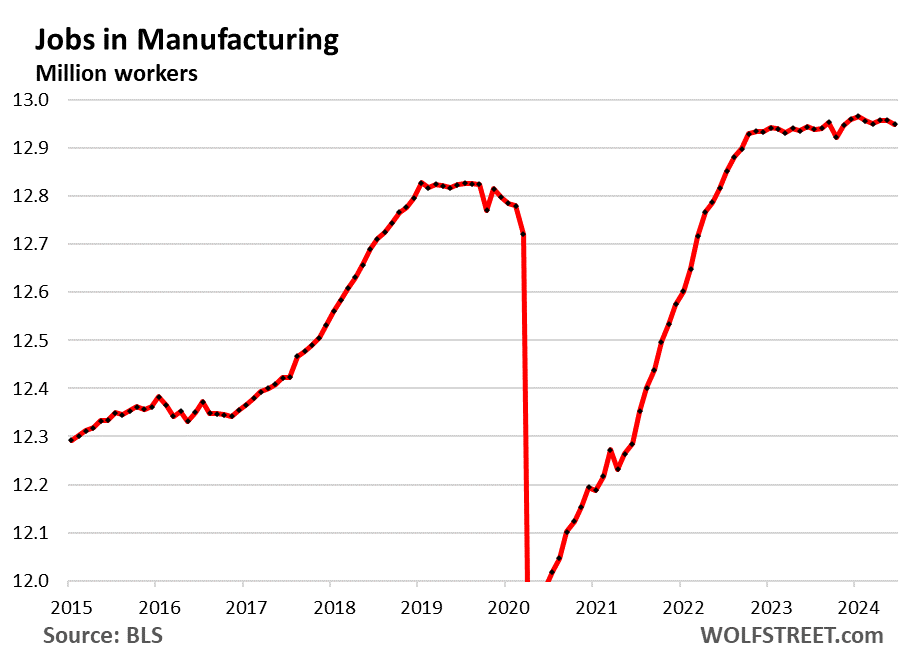
Manufacturing: Employment has plateaued at high levels after a surge out of the pandemic. Automation has ruled for decades, with fewer workers producing more things:
- Total employment: 12.95 million
- Month-to-month growth: -8,000
- 3-month growth: -1,000
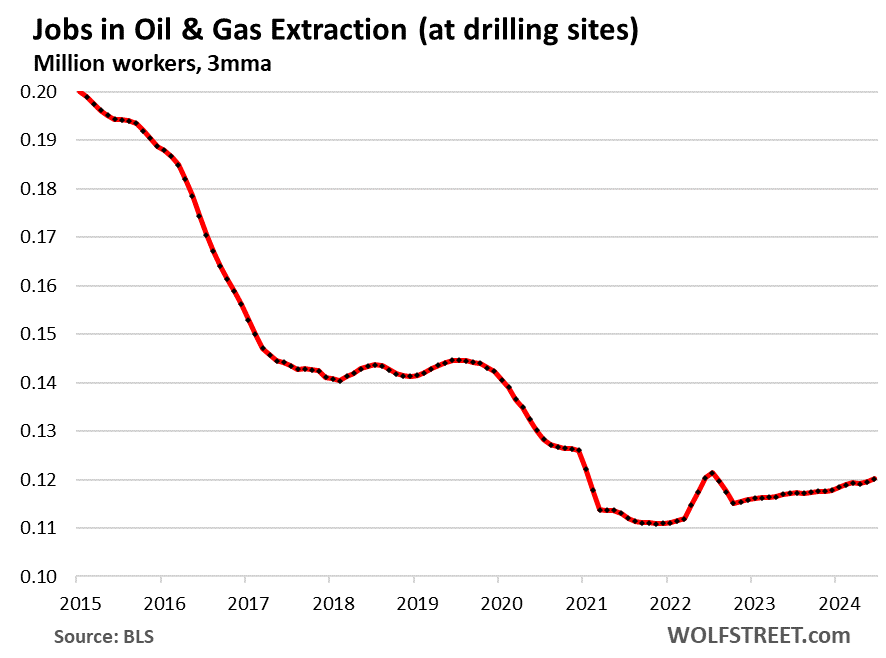
Employment in oil & gas drilling. As a result of the boom in oil and gas production, the US has become the largest crude oil producer in the world and a net exporter of crude oil and petroleum products; and the biggest natural gas producer in the world and the largest LNG exporter. But advanced technologies in the oil and gas field have made production increasingly labor-efficient.
Important: Not included here are the office and lab jobs of oil & gas: tech workers, engineers, traders, finance staff, managers, etc.; they’re counted in other categories, including Professional, business, and scientific services (see further below).
- Total employment: 121,000
- Month-to-month growth: +1,000
- 3-month growth: +2,000
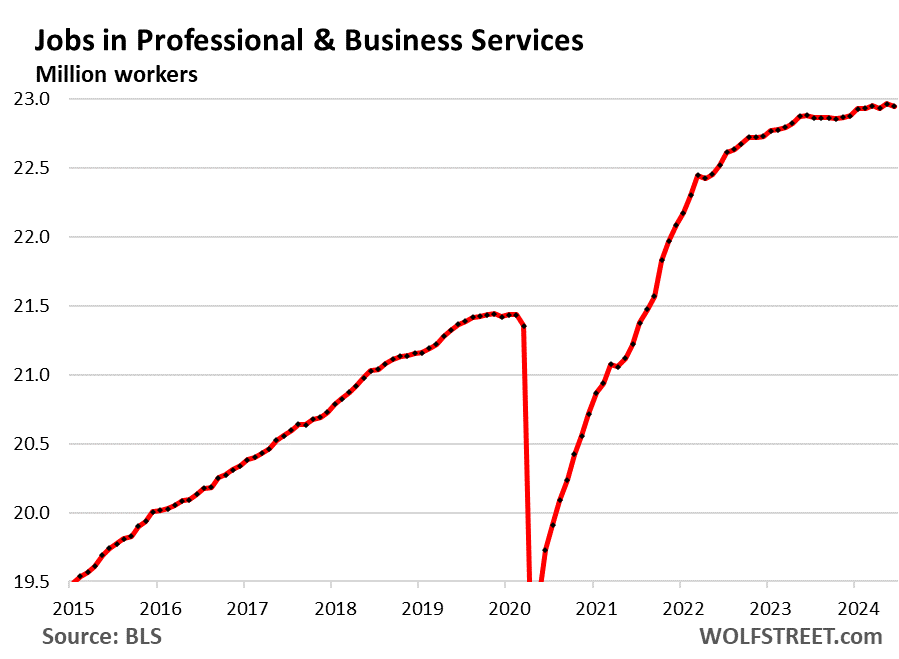
Professional and business services. One of the largest industries by employment, it includes facilities whose employees work in Professional, Scientific, and Technical Services; Management of Companies and Enterprises; Administrative and Support, and Waste Management and Remediation Services. It includes facilities of some tech and social media companies:
- Total employment: 22.95 million
- Month-to-month growth: -17,000 from the record in May
- 3-month growth: -3,000
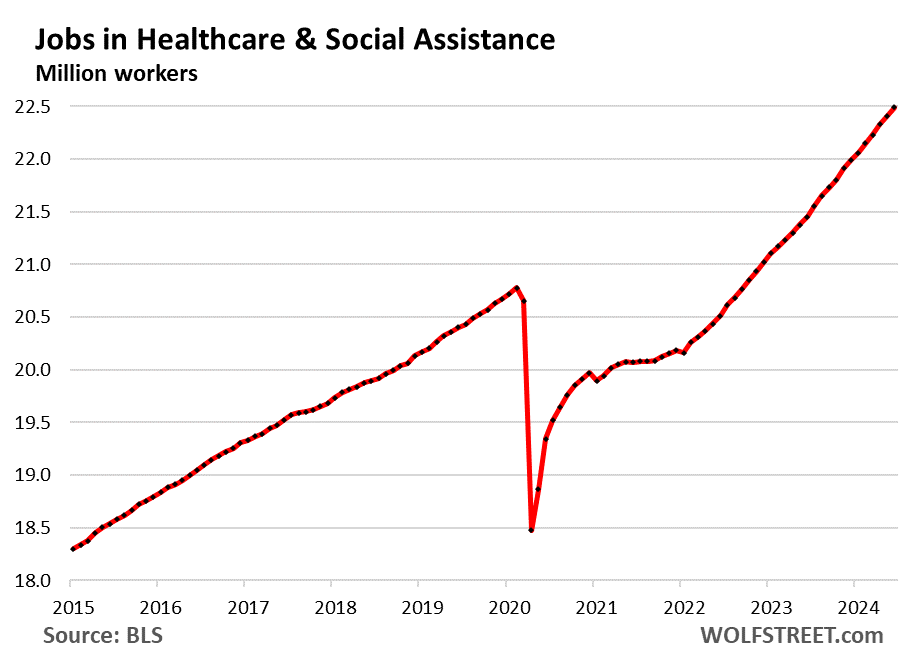
Healthcare and social assistance:
- Total employment: 22.49 million, new high
- Month-to-month growth: +82,000
- 3-month growth: +264,000
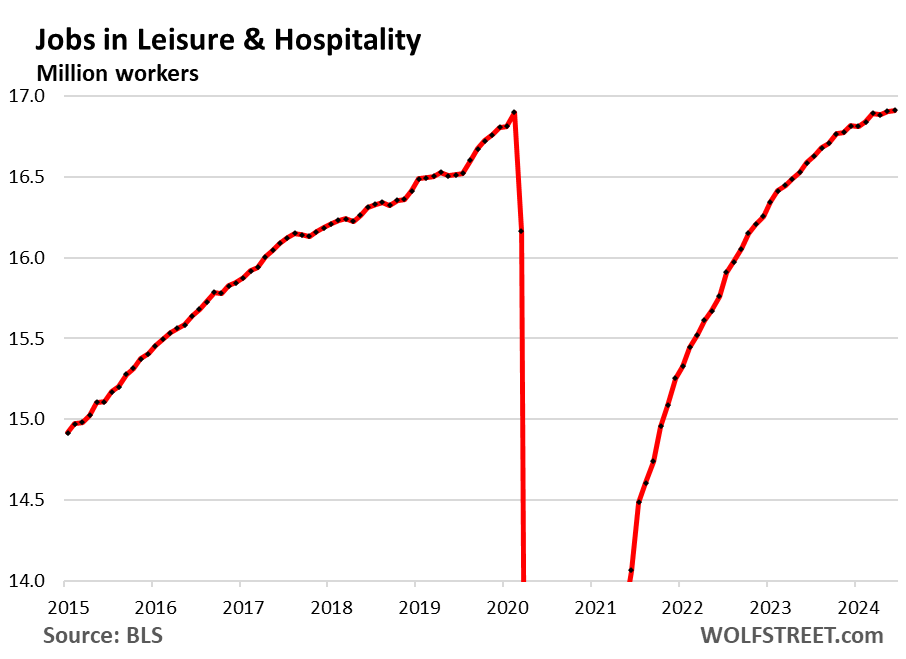
Leisure and hospitality – restaurants, lodging, resorts, etc.
- Total employment: 16.91 million, finally exceeding the pre-pandemic high.
- Month-to-month growth: +7,000
- 3-month growth: +20,000
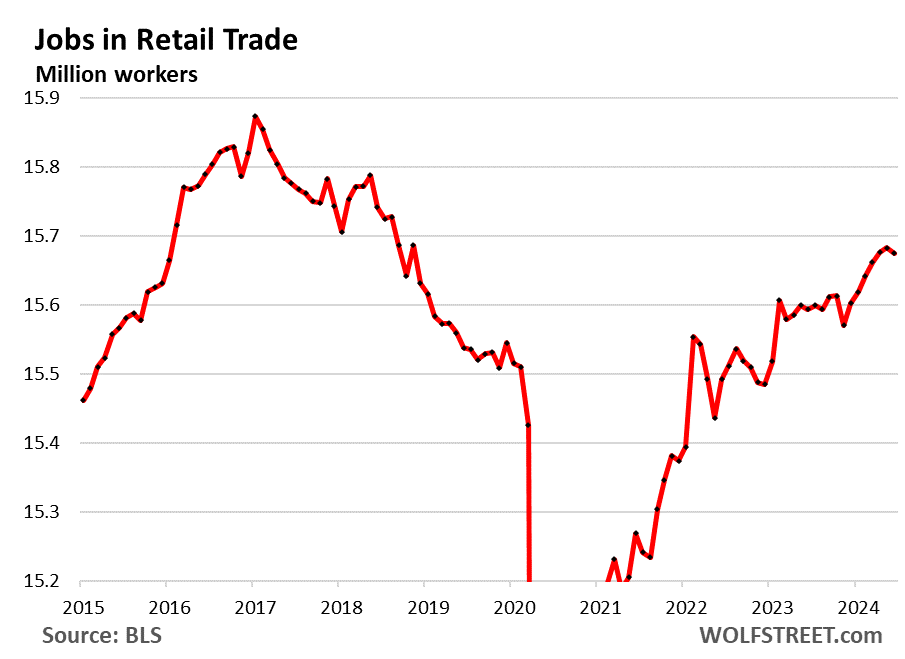
Retail trade counts workers at brick-and-mortar retail stores (at malls, auto dealers, grocery stores, gas stations, etc.). It does not include ecommerce-related tech jobs, drivers, fulfillment-center employees, etc.
A big portion of brick-and-mortar retail has been under heavy pressure from ecommerce for years, with dozens of major retailers being liquidated in bankruptcy court, which we document in our Brick-and-Mortar Meltdown series.
The brick-and-mortar retail sectors that are doing well: those that sell groceries, autos, gasoline, and other stuff that’s hard to buy online. Retailers sell goods. Service providers, such as hair salons, are not considered retailers, but service providers, and employment is captured in other categories.
- Total employment: 15.67 million
- Month-to-month growth: -9,000
- 3-month growth: +13,000
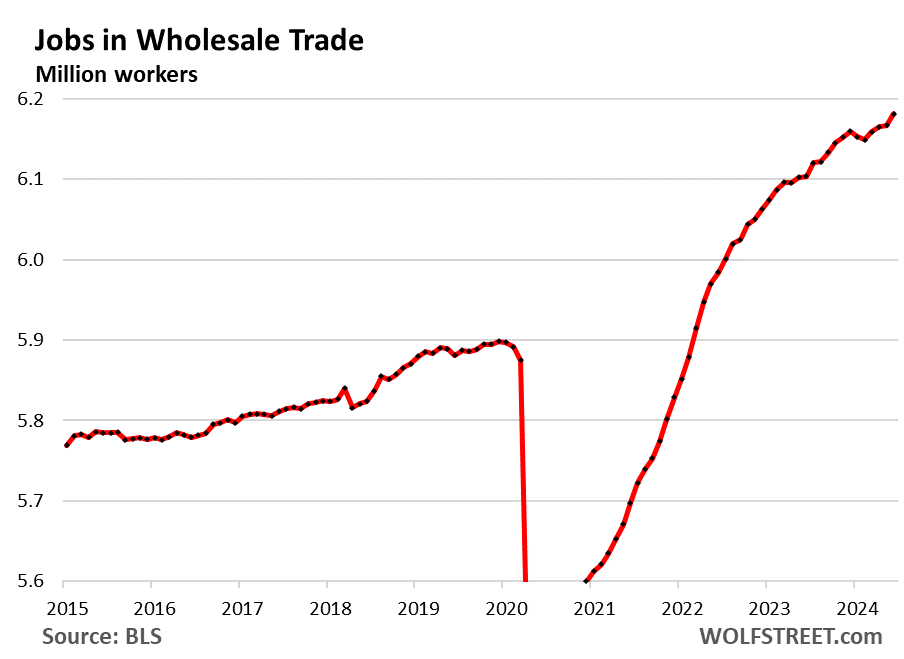
Wholesale Trade:
- Total employment: 6.18 million, new high
- Month-to-month growth: +14,000
- 3-month growth: +22,000
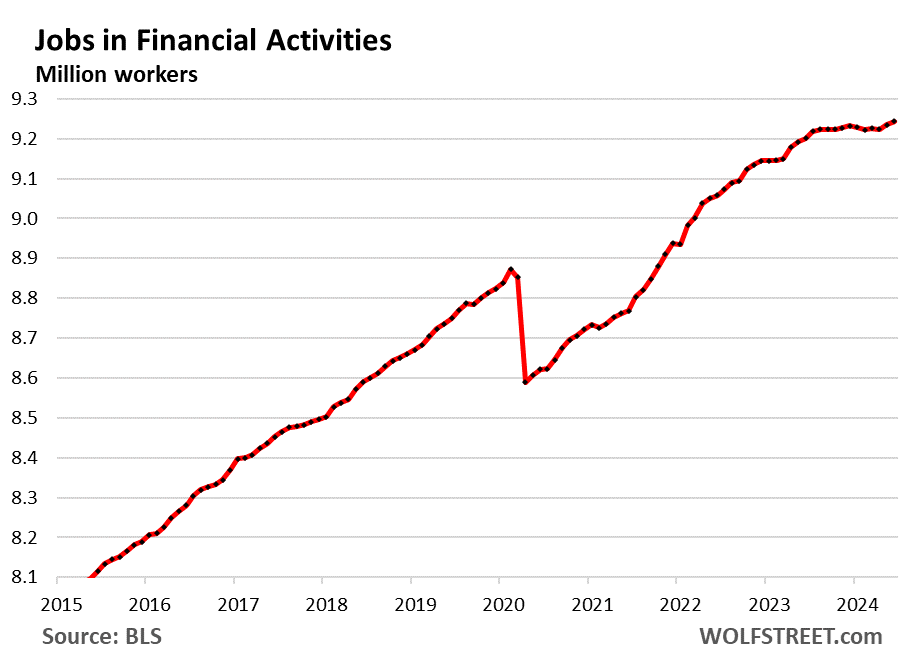
Financial activities (finance and insurance plus real estate renting, leasing, buying, selling, and management):
- Total employment: 9.24 million, new high
- Month-to-month growth: +9,000
- 3-month growth: +18,000
Transportation and Warehousing:
- Total employment: 6.59 million
- Month-to-month growth: +7,000
- 3-month growth: +40,000
![]()
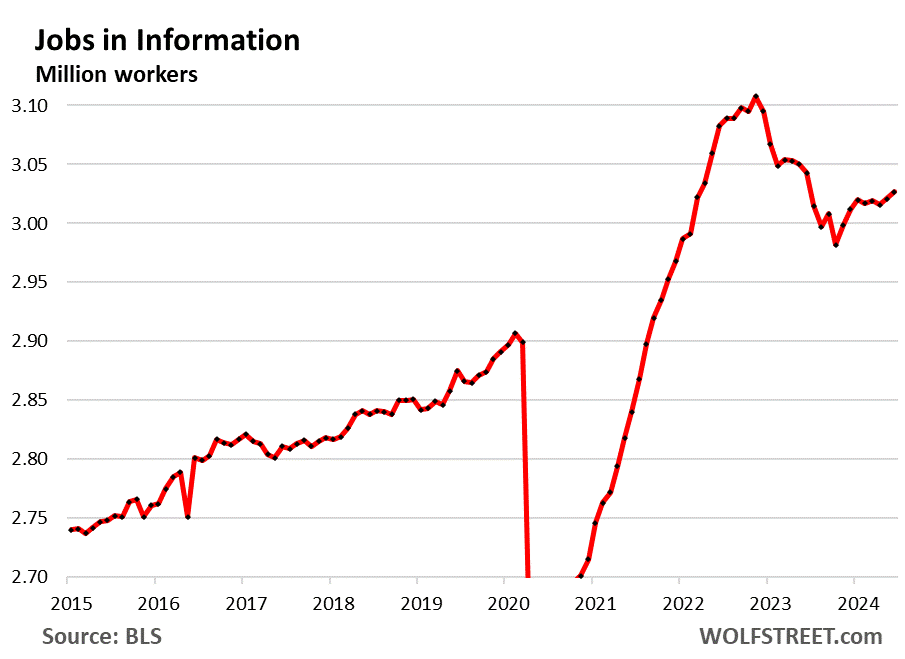
“Information” includes facilities where people primarily work on web search portals, data processing, data transmission, information services, software publishing, motion picture and sound recording, broadcasting including over the Internet, and telecommunications.
This includes some work sites by tech and social media companies. And after the layoffs, they’re hiring again:
- Total employment: 3.03 million
- Month-to-month growth: +6,000
- 3-month growth: +8,000
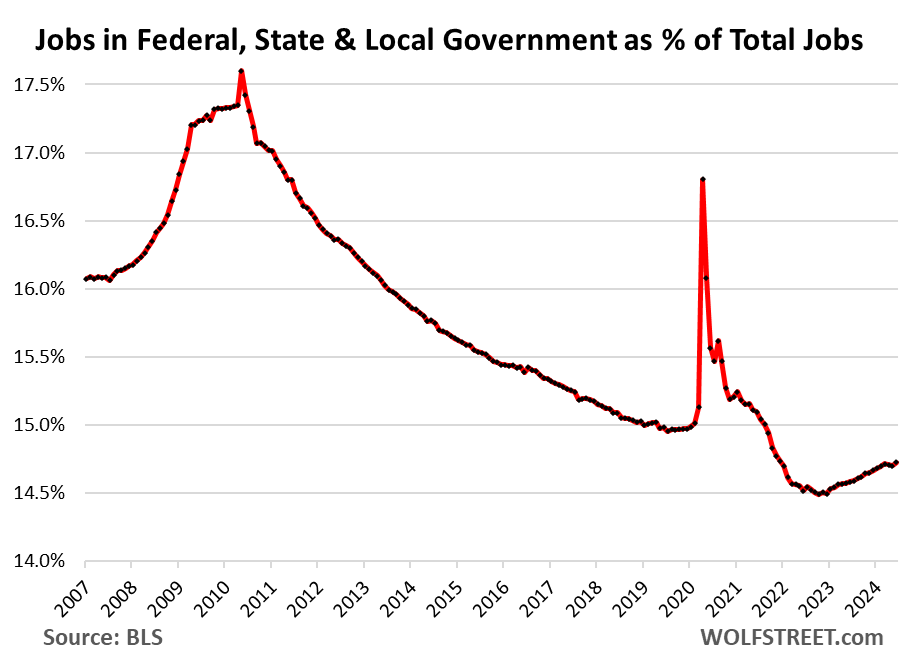
Jobs at federal, state, and local governments:
A historically low 14.7% of all employees work for governments at all levels:
- Federal government: 1.9% of all employees
- State governments: 3.4% of all employees (including higher education, such as at state universities).
- Local governments: 9.4% (much of it in education, such as teachers and school administrators).
The two spikes occurred during census taking (2010 and 2020). The 2020 spike was also a result of the plunge of private-sector employment during the pandemic.
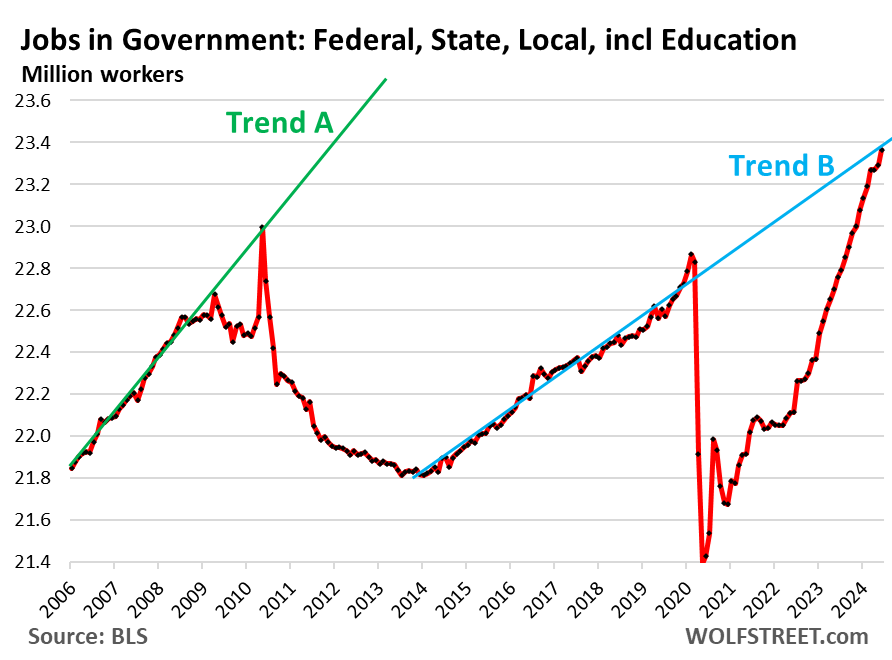
Total civilian employment at all levels of government – local, state, and federal – are now back to Trend B, not Trend A:
- Total employment: 23.36 million
- Month-to-month growth: +70,000
- 3-month growth: +95,000, consisting of +8,000 federal, +21,000 state, +66,000 local, resolving the teacher shortage)
Enjoy reading WOLF STREET and want to support it? You can donate. I appreciate it immensely. Click on the mug to find out how:

![]()
MW: 2-year US Treasury yield ends at lowest since March on signs of deteriorating labor market
And once again Wall Street is screaming for rate cuts while piling into stocks & bonds.
When the time is appropriate for rate cuts, it’ll be apparent to everyone. Historically, some piece of macro data will come in, and Wall St will sell off HARD on the news. None of this “bad news is good news” crap. Or still-positive numbers that fall slightly short of inflated “analyst expectations.”
+200K jobs/month and demanding rate cuts. What a JOKE.
Good, based on these data. FED and Pow Pow better not be thinking about thinking of a rate cut anytime soon…employment data still looking good, asset price still inflated to the moon, inflation fight is not over yet, if they somehow do lower rates then we know exactly what their true intention is..
The markets again markedly said today the Fed is going to pivot.
hasn’t the “markets” been wrong now for years about rate increases, rate cuts, and quantitative tightening?
could it just be that the markets are irrationally hyper?
Yep, they’ve been smoking that rate cut hopium for two years now and were definitely high on it today. Slightly less hot jobs report so the sky is falling and that means imminent rate cuts. It gets old.
Agreed. I believe FOMC officials are making a crucial policy error by failing to consider broader financial conditions when setting policy. Maybe it’s the reason that recent improvement has been so slow (L12M PCE +3.3% a year ago -> +2.6% today.)
When stocks are rocketing higher every day, and high-yield spreads are near their lowest ever, the easing in financial conditions works to offset the effect of the rate hikes. Alan Greenspan, the creator of the Federal Reserve Put, knew this, and raised rates by another +1.5% in 1999-2000 despite a disinflationary trend, because the Internet stock mania was getting out of control.
what if they lower rates to 5.25% and hold them there? what does that mean then?
Bostic and many other committee members expect it will be a series of rate cuts, not just one and done.
The committee’s median estimate of the neutral long-run rate is 2.8%. Two point eight percent. 🤪 (Or 0.8% net of inflation.) It’s been slowly drifting up over the past year, but still far lower than the Treasury & federal funds futures markets predict (~4%.)
No mention of the negative revisions? Now 15 months running if my memory is correct. Todays numbers will be revised downward.
I understand why you don’t want to deal with the household survey. But c’mon man. The establishment survey is no better. And it’s probably worse. Because they are lying every month and then (partially most likely) fixing the lies when nobody cares.
So I don’t see how you can say employment has ‘normalized’ when the numbers are fake. Unless you mean the fake numbers have normalized to the previous fake numbers. Maybe that explains it.
Wage growth was revised UP a LOT, and ZH didn’t mention it, did they? Only I did? 🤣
And I did mention the revisions of job growth, RTGDFA. And I gave you three-month averages which include the revisions, RTGDFA. And I gave you the 1-year total, which include all revisions RTGDFA, and I gave you long-term charts so that everyone, even you, can see what’s going on.
It’s good wolf you have z-ray vision and can see through all the deceptions.
To me nothing feels ‘normal’ the lies from on high at every level have taken faith and good will and thrown it asunder.
Now I will retire to the study, and enjoy a slice of Mellon.
Wolf, how does that graph for transportation look so great, yet all the small guys in my area have been hammered the past 2yrs?
1. It doesn’t look “so great. It’s coming up from a slump.
2. “Read the second part of the jobs category, “warehousing,” which is booming due to ecommerce.
3. A lot of transportation has shifted to private fleets, from over-the-road trucking to deliveries. Amazon, Walmart, all the big companies are building their own private fleets, or are creating dedicated contractors that exclusively haul their stuff, so the small guys — and even the big guys — are losing that business. This is a huge movement in transportation.
4. International airfreight has been booming, in large part due to direct sales by Chinese companies to US consumers (Temu, etc.)
Ignoring the Household Survey means ignoring the unemployment rate. That rate has increased enough since the trough in April 2023 to be significant news.
The unemployment rate increase from 3.4% in April 2023 to 4.1% in June 2024. That is certainly worth mentioning.
If 4.1% of the people interviewed met the definition for unemployed, then it doesn’t matter if the population number is accurate or not: 4.1% is always 4.1% The total employed and total unemployment may be understated because the population is understated. But the 4.1% unemployment is still accurate and not subject to revisions, unlike payroll numbers.
The 4.1% refers to the percentage of people employed
The payroll survey only counts the number of jobs at firms that choose to respond to the survey. Most do not respond.
Among those companies, there has been a net growth of jobs in the past year, but the details are revealing oly growth of part time jobs.
Here is my headline for the June Employment Report
Payrolls +206K After -111K Downward Revisions for April and May:
Unemployment rate at highest level since November 2021.
Since June 2023, US has added part-time jobs and lost full-time jobs.
1. 4.2% unemployment is considered FULL EMPLOYMENT. And 4.1% isn’t even there yet.
2. The Fed is projecting longer-run unemployment to range from 3.8% to 4.3%.
3. The data you cite is from the now trashed household survey, including full and part-time employment. It’s total nonsense. According to the household survey, now trashed, total employment has been flat for a year, LOL, despite the 2.6 million surge in payrolls and the surge in immigration. Anyone who cites these household survey figures now as proof of anything instantly loses credibility.
Regardless of what the household survey says on total employment, they still estimate an ominous trend for total UNemployment, as over 800,000 more people weren’t able to get a job in June 2024 compared last June 2023 (Fred, Unemployment Level). This is almost a 10% increase over last year, and despite what you say about high levels of immigration, the overall labor force did not increase by 10% this past year. This means we are headed in the wrong direction as a ratio of unemployed/labor force. My bet stands that we will be in recession territory soon unless this trend abates (yet it is speeding up).
Policy makers know what I was talking about in the first section: that the Census Bureau data underestimates immigration and therefore population growth by 6 million immigrants in 2022 and 2023. This data is from the nonpartisan Congressional Budget Office, using ICE data and Census Data.
They all talked about it – the White House, the Fed, economists, the WSJ, etc. because it solved a mystery: why employment growth has been pretty strong in the establishment survey, while it has been flat or falling in the household survey for over a year, and why the labor force in the household survey keeps falling: Because the 6 million immigrants aren’t in the Census Bureau’s population data that ALL this household data is based on.
So the figures in the household survey, including unemployment, are wrong. Employment is WAY understated, the labor force is WAY understated, the labor force participation rate is understated, etc. And every economist that deals with this understands this. I’m not telling you anything new. I’m just reporting on a known issue documented and analyzed by the CBO.
The BLS takes the household survey data from the survey of 50,000 or so households and extrapolates it to the Census Bureau’s population data, which is 6 million immigrants short. For example, it multiplies the employment data in the survey by the understated population data to come up with total employment, so total employment is way understated. This has been going on since 2022.
So all of the household data is wrong: employment, full and part-time employment, labor force, unemployment, etc. This is a big problem because we need this data, and there is an officially acknowledged huge error in this data.
This is why the CBO did this analysis – because the household survey data didn’t make sense anymore. The CBO did this analysis for policy makers so that they can get a handle on what’s really going on with employment. The data was also released to the public, and I downloaded the data.
The Census Bureau will eventually revise the population data, but until then all household data that is based on employment, labor force, and unemployment is wrong.
The establishment survey is telling us that employment growth is slowing, but is still sold, and wages are increasing at more moderate rates, and we can from the establishment survey how the different industries are doing, some with strong employment growth and record employment, and others with declines. See my charts above.
So we know employment growth is slowing. We know from the unemployment claims data that layoffs are moderate, normal for the pre-Covid Good Times, but that it now takes people a little longer to find a new job, so the continued claims have come up, though they’re still relatively low. This is unemployment insurance data, nothing to do with surveys or the population data.
But from the CBO analysis, we also know that population growth is much bigger, and that there are many more newly arrived people in the labor force and working (the establishment survey picks them up) that are not in the household data because its uses the wrong population data from the Census.
So we have slowing growth in the labor market, we know that, but all the other data that we really need is now wrong and cannot be relied on.
You really need to read this article. It explains it:
https://wolfstreet.com/2024/04/03/how-the-huge-wave-of-immigrants-into-the-us-in-2022-and-2023-impacts-the-employment-data-of-the-bls-household-survey/
Here is the chart I made from the CBO’s data:
Just for fun I got out my fancy-schmancy homemade BS employment data spreadsheet and added in the 3870000 missing immigrants from the last couple of years (assuming the 1.05M ea usual average was included in the graphics already) to see what happened w the YoY% change trend…
Sure enuf the trend pushed out to where it’ll change to negative in a couple/few more months, mebbe… If you assume only 75% of the immigrants are employed tho, we get to the usual point where they declare recession next month if the trend continues.
But I still assume all this fiat money is still sloshing around the system and mucking up visibility too.
Interesting times indeed. ;-)
THEN I added the establishment survey, same range and it correlates well to the recession dates too until recently, where it’s still at 3.6% YoY% and slow decline.
Not sure if it means anything but 6M immigrants x 75% employed (establishment) turns out to be 3.2% which is about the difference to the household survey.
Will be tracking all these series and let y’all know when they sync again. ;-)
Yes Richard yes, unemployment at 4.1%, the economy is breaking, we need 6 rate cuts, let’s make some noise in media so Powell and FOMC have the justication to give us want we won’t, because they want it to for the big Novemeber. Who cares that we have 2.6 million jobs created over 1 year, and 3 million immigrants over the same period to keep the labor market from turning into a furnace and fuel inflation toward 6%. Let’s get some quick earnings and who cares what’s going to happen after that. But the good thing is unemployment at 4.1% so FOMC can finally cut the rates at the end of the month, let’s celebrate now.
1) In construction : the multi apt units 5+ in construction are down. Car dealerships Crystal Palaces are either completed, or almost completed. Inventory is piling.
2) Oil & Gas Extraction : DUCsDUCs.
3) Gov & States & Local as % of total jobs : they slumped, despite
reaching a new all time high.
4) Average hourly earnings % Y/Y and M/M ma(3M) : before 2020 the were above the average CPI. In June the M/M ma(3M) and Y/Y are down to zero in real terms. Real wages are deflating, but there no strikes.
5) Women’s mascara and perfume aren’t selling.
At least your #4 is nonsense.
1. We don’t have June CPI yet
2. so here is May CPI v June wages:
YoY CPI: +3.3%
MoM CPI: 0.0% annualized
YoY Average Hourly Wages: +3.9% (beating +3.3% CPI)
MoM Average Hourly Wages: +3.5% annualized (beating 0.0% CPI annualized)
4) For those who rent : the CPI > wages.
Yes.
Employment in oil & gas drilling Total employment: 121,000!
Wow, so few extraction employees for the largest oil producer.
There may be more Uber drivers.
That’s some efficiencies.
There are going to be fewer Uber drivers as well because Waymo’s robotaxis are now all over San Francisco and a bunch of other cities, taking locals and tourists to their destinations. This is really working, I see them in my part of town all the time, loading and unloading passengers, driving around empty, etc. All you have to do is download the Waymo app, open an account and establish the payment method, and then hail your robotaxis. This is not the future, this is now. Amazingly.
Are those driverless cabs cheaper than a regular one since there is no salary cost? I wonder when they will show up in NYC.
I need to get the app and start using them so I can report on it (but I walk nearly everywhere, so I don’t need the service except when I go to Costco). To compare prices, I’d have to simultaneously price the same trip with Uber and Waymo and see how it comes out. With Uber at least, surge pricing makes a huge difference.
Reddit/waymo pricing
Reddit/San Fran waymo
My boss is waiting for fully self-driving, AI cars, like “Alexa, drive me to Costco.” “Alexa, drop me off and find parking.” “Alexa, come pick me up.” “Alexa, open the truck. I need to load groceries.” Etc.
I can see food delivery for curbside delivery. Etc.
The best one: “Alexa, I am drunk. Please drive me home.” Can you imagine that? “Sorry, Dave. You are drunk. I can not allow you to drive home. I will drive you home.” Big Brothery, but the slaughter of the innocent by drunk/drugged drivers.
Alexa, drive me to Costco sounds immensely inviting to me. If I could then just get Alexa to go into Costco for me…
Alexa, find me cheaper grocery prices than Costco delivered to my door today, without a membership fee.
Just do it
Wolf , you make a compelling argument that the household data is incorrect. I see this morning in the WSJ that Jan Hatzius ( from Goldman), no dummy, thinks markets should watch the unemployment rate (HH survey) for signs the Fed will be cutting rates.
Is Hatzius just gaslighting us because Wall Street always wants easy money?
I mean, he certainly has access to the same information you do.
And could you comment on why you think Powell is dropping hints again about “mission accomplished “ implying he’s cutting rates?
At least that’s the interpretation I read from the Wall Street economists
The problem is that the unemployment rate is the main measure we have. So what else is the Fed going to go by? It could be overstated, it could be understated, but it’s the only unemployment rate we have. So it’s hard not to use it if you’ve been using it for everything until now. This is what pisses me off so much – these are crucial metrics, and we can no longer rely on them because the Census Bureau is dragging its feet in changing its method and include the ICE data on immigration as CBO has done in its analysis.
Hatzius has been hilariously wrong about rate hikes in 2022 when he said that the Fed wouldn’t hike past 2.25% or something like that. He’s just doing promo work for Goldman. Some of the banks that believed him imploded.
Thank you, that’s helpful
introvert here,no driver sounds amazing i dont know how much more expensive it would have to be to not use.
The thing is that the situation is very clear actually, you have 3 million of immigrants entering the country in a year, but consider that a part of them are under age and not able to work, so the best case is that you have 2.6 million of employees suppling the market for 2.6 million of jobs created over the same period. Unemployment at 4.1% at the best (as some commenters like to include in the analysis), under natyral unemployment rate, so you can’t count on more participation from the domestic population. Also, consider that the current rate of immigration is the maximum that the country can manage, so don’t count on more immigrants, actually more probably the rate will decrease due to political pressures from the domestic population. In such conditions, just add one cut to the receipt and you have the labor market turning into a furnace. The FOMC knows it very well, but you have the chairman more concerned about November than the economy, and which is trying in any possible way to justify a cut at the end of July. BTW why do you think the government hiring and spending slowed during April, May and probably June (which still we have to see)? That’s why the market, wall street and media, also part of the commenters in this article, are all so excited to push the narrative for deteriorated economy conditions, because they understand the intentions of the FOMC.
Physician assistant who turns 54 this year. Just quit my final job 3 weeks ago. Officially out of the labor pool and fully retired and a new blip on the charts somewhere.
Did medicine the last half of army career and for 6 years post retirement. Became so fed up I grew to hate it.
Pay was good, but I don’t need the $. I think I was hanging on to my professional identity. Now that it is gone, I find myself wondering what took me so long. Wisdom and experience are strange.
I also felt a little guilty because I read comments about how people are struggling. I don’t experience that, but I empathize with it and leaving $9k/mo just sitting on the table seems…irresponsible?
But more $ did not add any additional quality of life and I didn’t want to do it anymore. Odd when life does not revolve around days off. Now, everyday for the rest of my life is a weekend.
Pilotdoc – realizing that money is only one of your tools (albeit a very powerful one in our current human society) for existence is to discover a jewel in your personal lotii. One’s time is all you will ever really own, husband it well…
may we all find a better day.
So true. I am about to meet with a young guy who has questions about real estate.
Going to ask about his end goal first and back plan from there. If his ideas of wealth building are not health, time, family, then material goods, I hope to enlighten him.
Health over all, because you can’t enjoy the rest of it without it.
You are on the right path. Left 200k on the table with healthcare and glad I did.
The numbers are all crap as I have a board job and work??? one day a month.
Perhaps the gooberment needs googlet. I can buy a bit of junk and all the ads change in seconds. And we don’t have a clue how many of us their are?
Wage gains in Canada accelerated to 5.2 percent year over year mainly due to sky high rents. The Bank of Canada will cut rates anyway.
So true. I am about to meet with a young guy who has questions about real estate.
Going to ask about his end goal first and back plan from there. If his ideas of wealth building are not health, time, family, then material goods, I hope to enlighten him.
Health over all, because you can’t enjoy the rest of it without it.
When the Fed prints money it causes inflation. Good inflation is when the stock markets soar. Bad inflation is when the costs of necessities rise. Methinks the Fed will support the bankers and leave the peasants to fend for themselves. They will lower rates.
From Dallas fed a new paper on immigration and dynamics:
“ The nation is in a sort of demographic autumn, and winter is coming. The retirement of the baby boomers and overall aging of the workforce, as well as low and falling birth rates mean population growth will become entirely dependent on immigration by 2040, as deaths of U.S.-born will outpace births”
I get so tired of this BS. All they want is wage repression through a labor market where demand is limited and supply is unlimited. To hell with them.
US Cities are hugely crowded, commutes are already infernal, automation and AI are already seeing to it that less labor is needed from healthcare and tech to drivers and workers in the publishing industry and porn. People who already live here don’t want population growth, and even more people to compete with in the job market, and the economy will be doing just fine without it, though corporate giants and their investors are just going to have to forget about forever-income-growth.
The three Dallas Fed economists (!!! Economists don’t care about actual people) and the economist at the University of North Florida, who wrote this paper – all four of them young-ish women – have good jobs that are likely not threatened by cheap labor coming it. But they should be replaced by AI, which cannot possibly do a worse job than these four and would be a lot cheaper.
Wolf – over. the. centerfield. fence!
may we all find a better day.
Loved the comment above about immigration and the useful comment about the confirmation bias of young Fed masterminds.
I strongly believe the ai explosion is related to baby boom retirements of old great haired, proficient managers that had been conservative and more tuned into making decisions based on facts, versus tripping over themselves to embrace ridiculous hype — which I think what we’re seeing with the ai networking effect — which is a generational brainwashing of newly promoted young managers who are betting the farm on technology that won’t be embraced or adopted in the real world.
The baby boom demographic dynamic is a huge factor spilling into lots of bifurcated confusion, including immigration, inflation, jobs and GDP, etc.
Somehow this connects to a recent comment by Hussman that I think is very relevant :
“The most striking feature of glamour growth companies in recent years isn’t that they’ve produced more economic growth, but rather, that they’ve produced more economic concentration and greater wealth disparity. “
Redundant…never really noticed until you pointed it out that the ‘proficient managers’ seem to have ‘great hair’. Might be due to ‘glamour growth’…
(sorry, appreciate your comment, but couldn’t resist…best).
may we all find a better day.