Month-to-month data is volatile. We’ll look at the trends.
By Wolf Richter for WOLF STREET.
After months of worsening data on CPI inflation, we got still bad, but less bad, data today for April by the Bureau of Labor Statistics. And perhaps it was just another month-to-month squiggle, to be turned around over the next few months, of which we had many. Or perhaps it was a change in trend.
We’ll get to the details in a moment. But in summary, on a year-over-year basis:
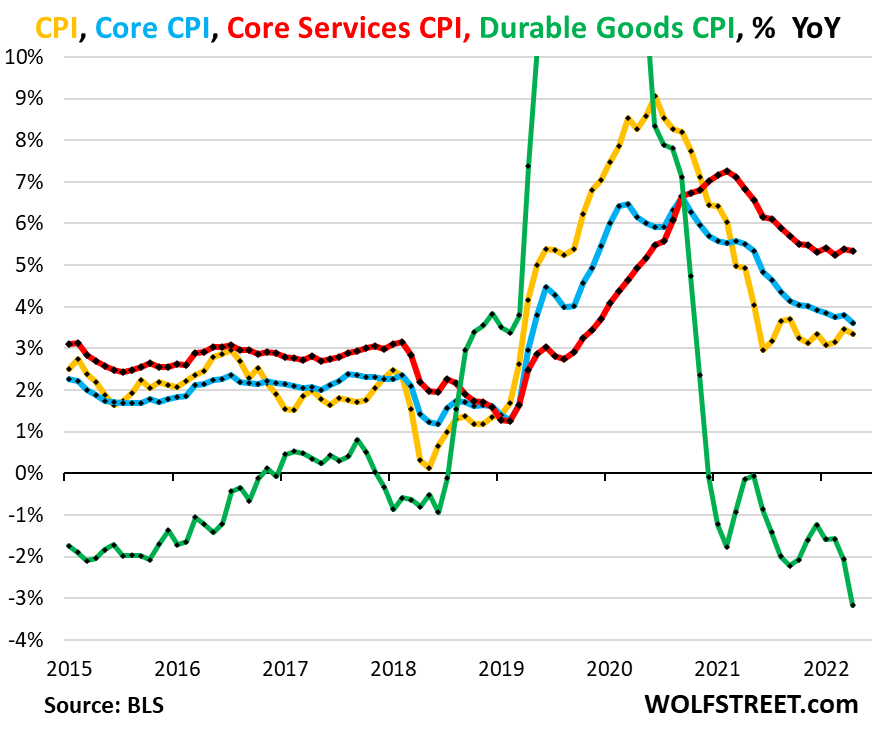
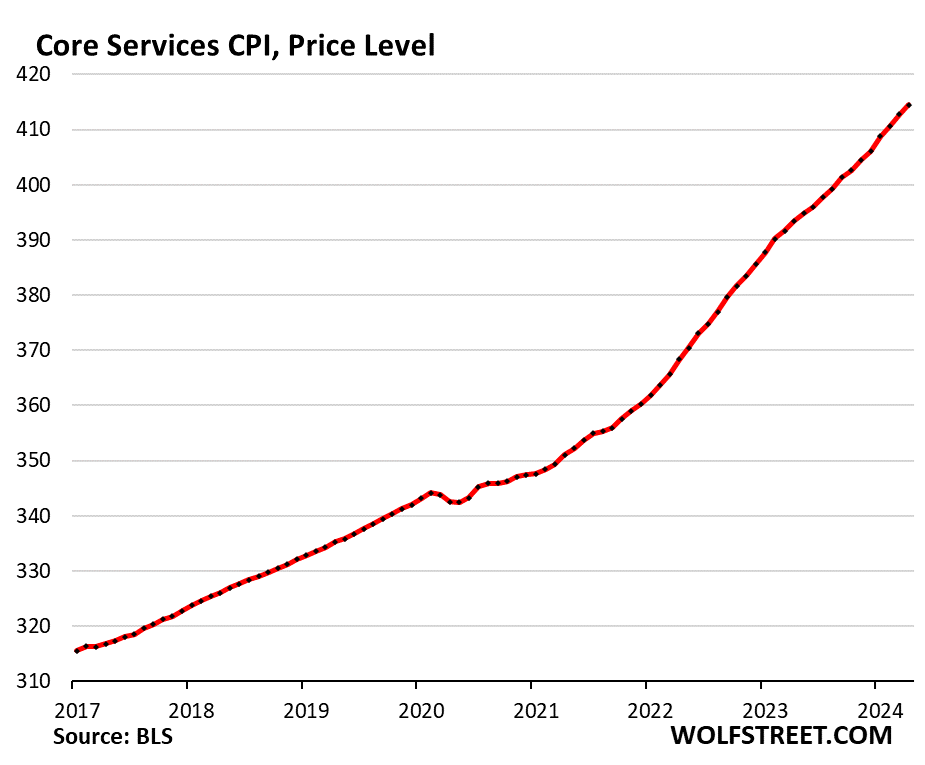
Core services CPI – which accounts for about 60% of total CPI – increased by 5.3% year-over-year in April, roughly the same hot pace for the seventh month in a row, and seems to have gotten stuck there (red line).
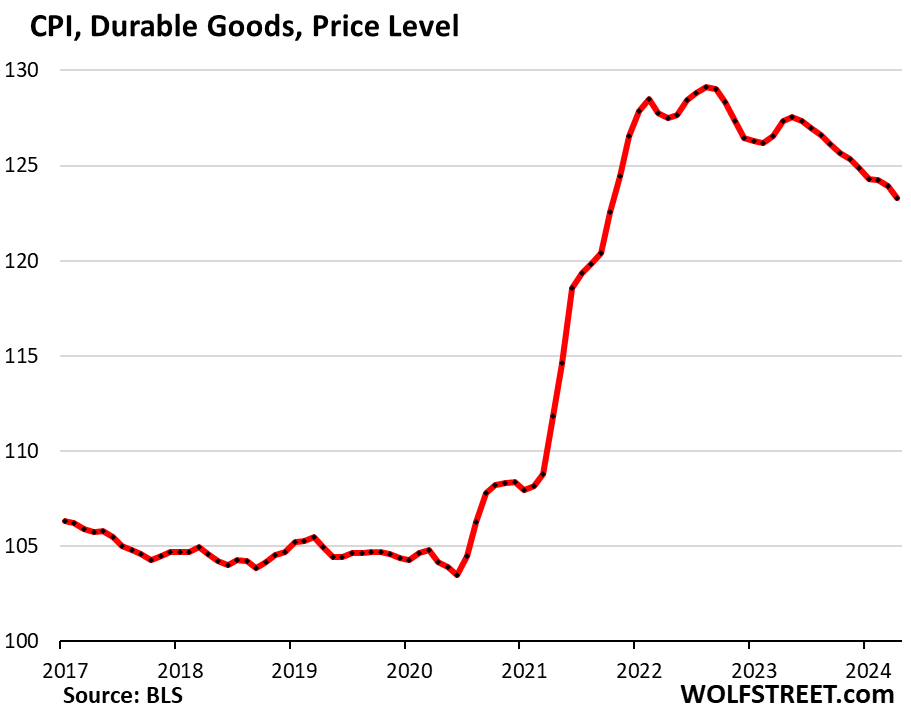
Durable goods CPI – which had horribly spiked during the pandemic, including by 19% in December 2021 – has been falling by every measure across the board since mid-2022, led by the plunge in used-vehicle prices. In April, durable goods CPI was down 3.2% year-over-year (green).
Core CPI, which excludes food and energy, decelerated a tad to a 3.6% pace (blue line), slowed by the sharp drop in durable goods.
Overall CPI increased at essentially the same pace as in March, by 3.4% (yellow line), with the energy CPI up 2.6% and the food-at-home CPI up 1.1%:
Trends in Core CPI.
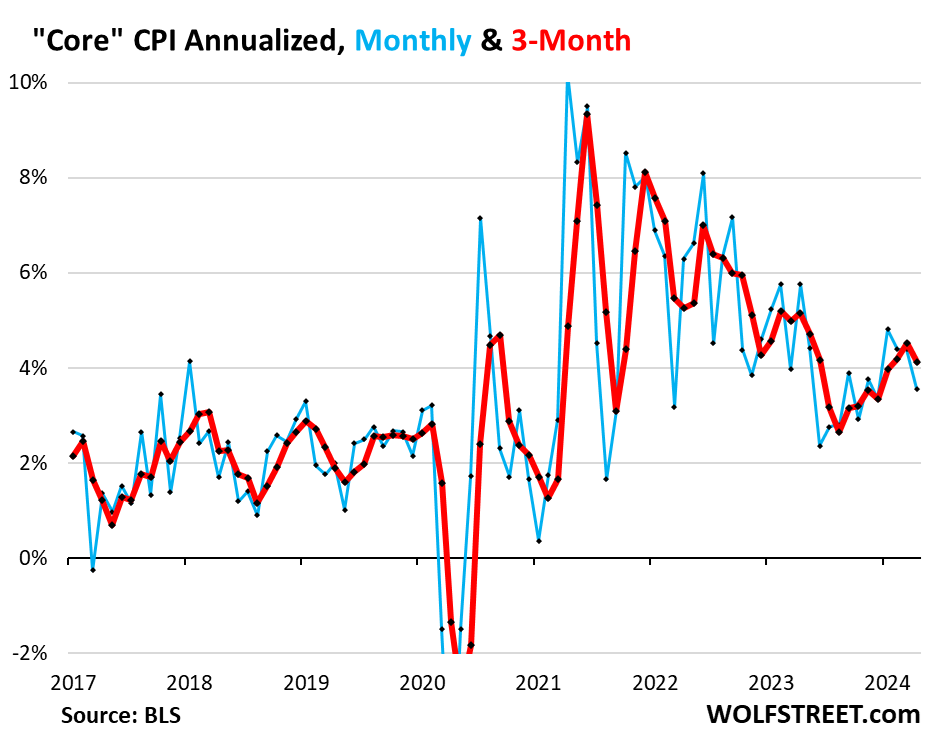
The month-to-month changes zigzag up and down, as you can see in the blue line in the chart below, representing month-to-month changes annualized. On this annualized basis, core CPI rose by 3.6% in April from March.
The three-month core CPI, which irons out some of the zigzags, rose by 4.1% annualized, a slower increase than in the prior month:
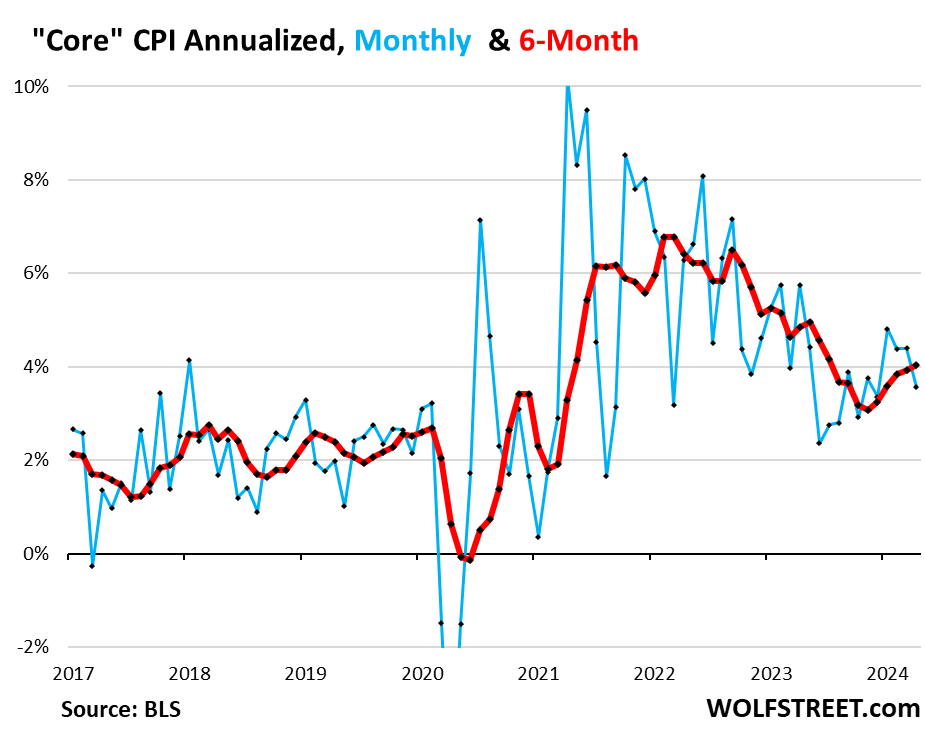
But the six-month core CPI, which irons out most of the month-to-month zigzags, and which Powell often cites, accelerated to 4.0% annualized, the biggest increase since July, and the fifth month in a row of increases:
Trends in core services inflation.
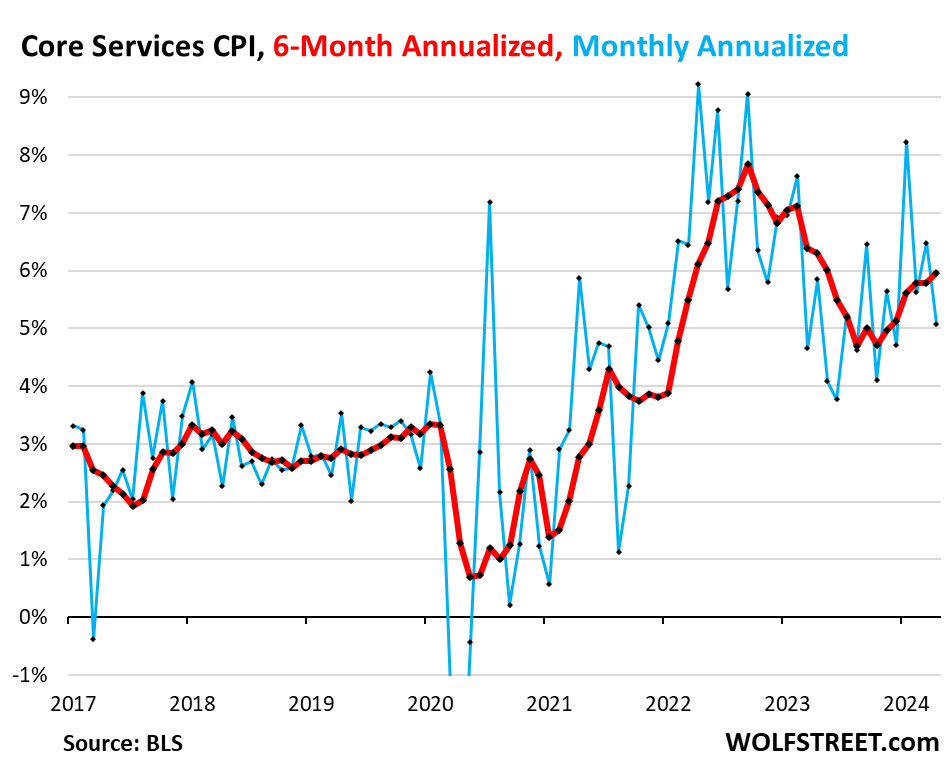
Core services CPI increased by 5.1% annualized in April from March, so that was hot, but it was less hot than the prior three month-to-month increases that ranged from 5.6% to 8.2%.
The blue line, which shows the month-to-month changes annualized, goes up one month and down the next, and this month was a down-month.
The three-month average core services CPI – now February, March, and April – decelerated to an increase of 5.7% annualized as the January reading of 8.2% dropped out of it.
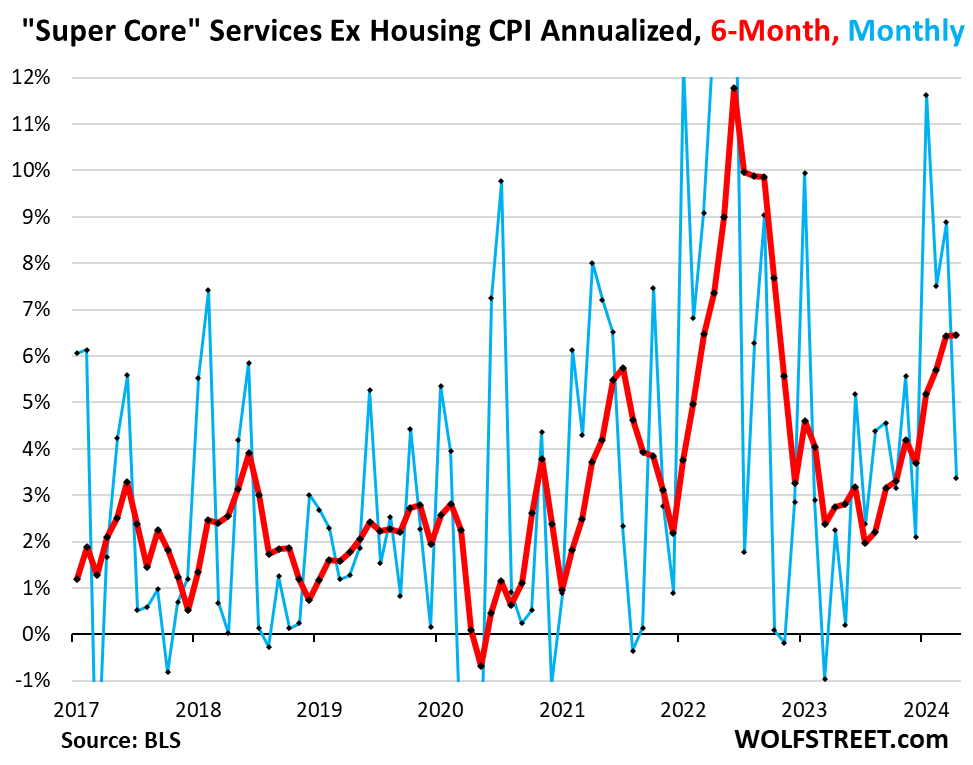
But the six-month core services CPI, which irons out the month-to-month squiggles fairly well, continued to accelerate and reached 6.0%, the highest since May 2023, back when it was on the deceleration path:
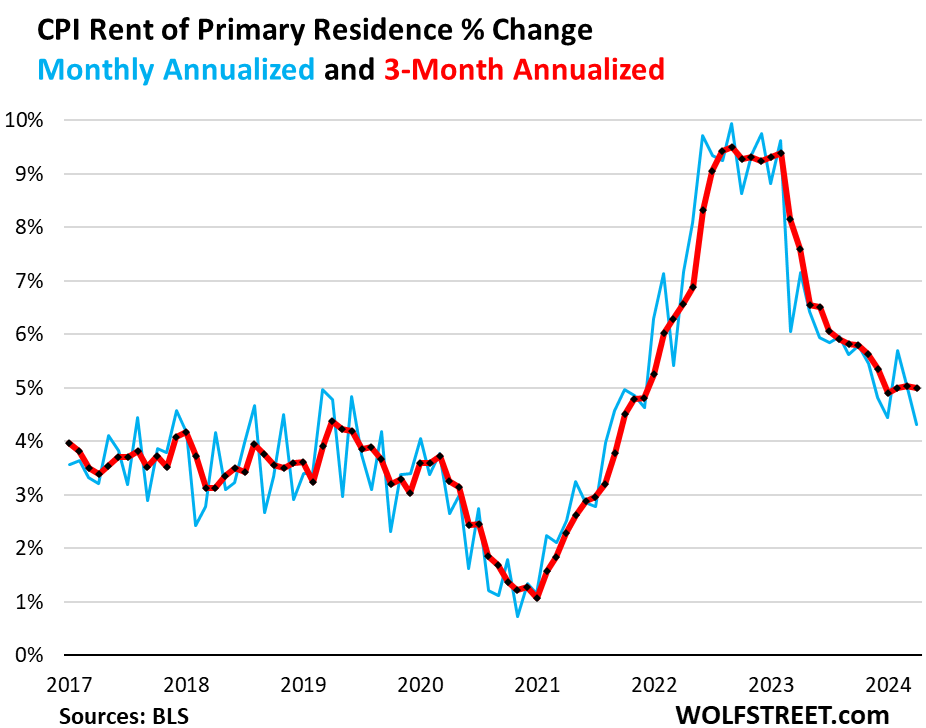
The housing components of services CPI.
Rent of Primary Residence CPI rose by 4.3% annualized in April from March (blue).
The three-month reading rose by 5.0%, the fourth month in a row of 5% increases, after having cooled sharply from the 2022 to early-2023 pace in the 9% range. The three-month pace in April (5.0%) was slightly hotter than in December (4.9%).
The Rent CPI accounts for 7.6% of overall CPI. It is based on rents that tenants actually paid, not on asking rents of advertised units for rent. The survey follows the same large group of rental houses and apartments over time and tracks the rents that the current tenants actually paid in these units.
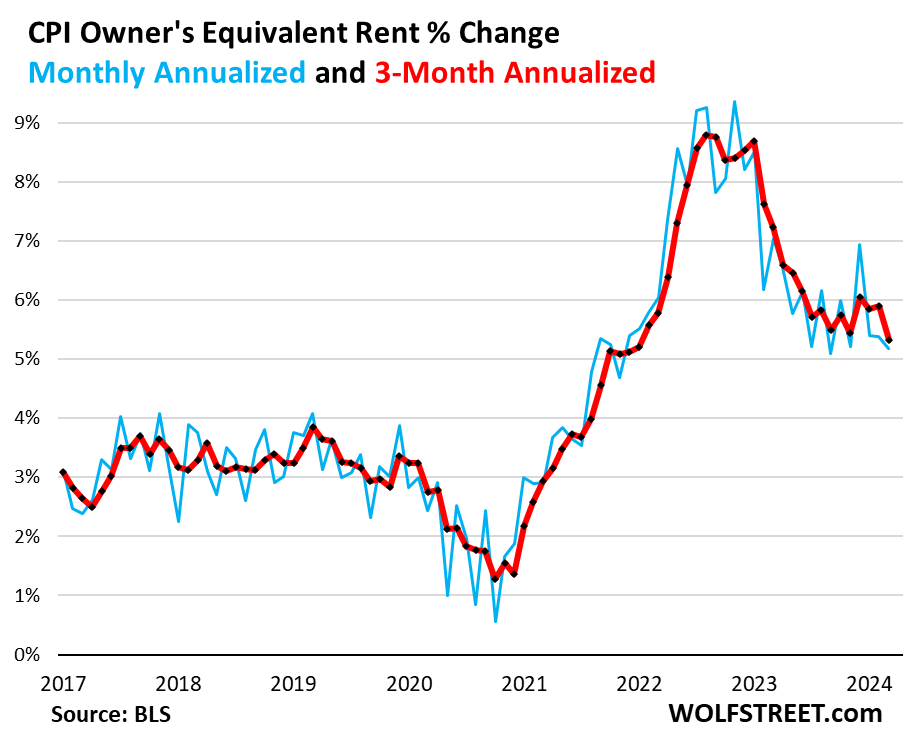
The Owners’ Equivalent of Rent CPI rose by 5.2% annualized in April from March. This is volatile data with big monthly squiggles, but since August 2023, the low of the range was an increase of 5.1% and the high of the range, a freak jump in January, was 6.9%. April remained in that range.
The three-month OER CPI decelerated to 5.3% as the freak 6.9% spike in January dropped out.
The OER index accounts for 26.6% of overall CPI. It is designed to estimate inflation of “shelter” as a service for homeowners and is based on what a large group of homeowners estimates their home would rent for.
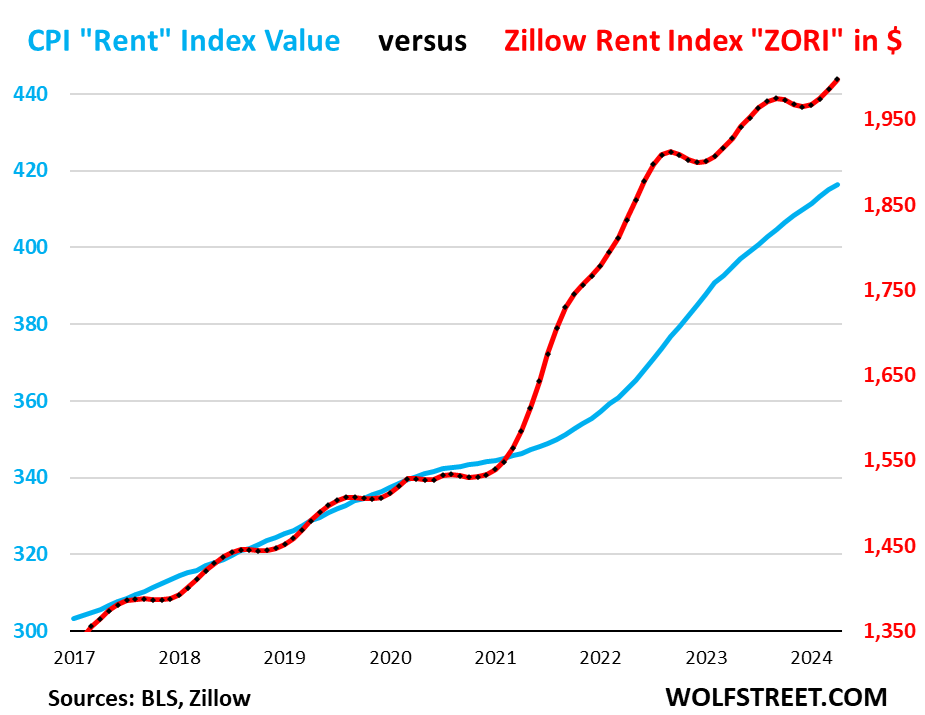
“Asking rents…” The Zillow Observed Rent Index (ZORI) and other private-sector rent indices track “asking rents,” which are advertised rents of vacant units on the market. Because rentals don’t turn over that much, the ZORI’s spike in 2021 through mid-2022 never fully translated into the CPI indices because not many people actually ended up paying those asking rents.
The ZORI rose by 0.6% in April from March and by 3.6% year-over-year.
The chart shows the CPI Rent of Primary Residence (blue, left scale) as index value, not percentage change; and the ZORI in dollars (red, right scale). The left and right axes are set so that they both increase each by 50% from January 2017, with the ZORI up by 49.7% and the CPI Rent up by 37.4% over the period.
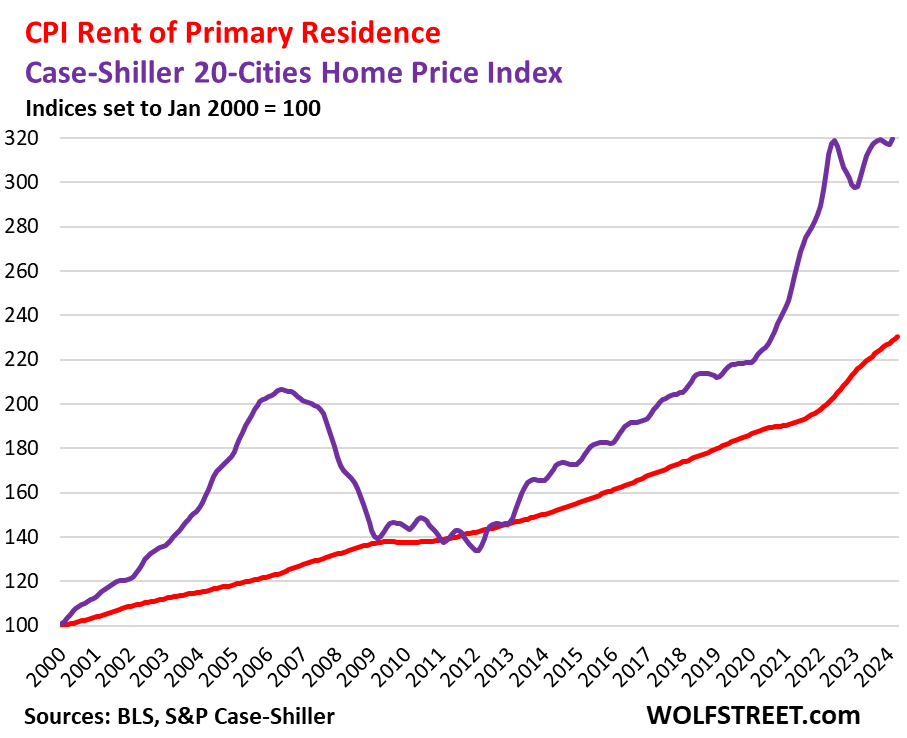
Rent inflation vs. home-price inflation: The red line in the chart below represents the CPI for Rent of Primary Residence (actual rents paid by tenants) as index value, not percentage change. The purple line represents the Case-Shiller 20-Cities Home Price Index (see our “Most Splendid Housing Bubbles in America”). Both indexes are set to 100 for January 2000:
“Supercore CPI” — core services without housing — is whiplash volatile month to month. In April, it rose by 3.4%, after red-hot readings in January, February, and March (blue in the chart below).
The six-month reading – to soothe the whiplash of the month-to-month readings – jumped by 6.5%, a slight acceleration from the prior reading (+6.4%), the hottest since October 2022.
| Major Services ex. Energy Services | Weight in CPI | MoM | YoY |
| Core Services | 59% | 0.5% | 5.4% |
| Owner’s equivalent of rent | 26.6% | 0.4% | 5.8% |
| Rent of primary residence | 7.6% | 0.4% | 5.4% |
| Medical care services & insurance | 6.5% | 0.4% | 2.7% |
| Education and communication services | 5.0% | 0.2% | 1.6% |
| Motor vehicle insurance | 2.9% | 1.8% | 22.6% |
| Admission, movies, concerts, sports events, club memberships | 1.9% | 0.2% | 4.4% |
| Other personal services (dry-cleaning, haircuts, legal services…) | 1.5% | 1.1% | 4.9% |
| Motor vehicle maintenance & repair | 1.2% | 0.0% | 7.6% |
| Water, sewer, trash collection services | 1.1% | 0.4% | 5.3% |
| Video and audio services, cable, streaming | 0.9% | 0.6% | 4.5% |
| Lodging away from home, incl Hotels, motels | 1.5% | -0.2% | -0.3% |
| Pet services, including veterinary | 0.4% | 0.5% | 4.9% |
| Public transportation (airline fares, etc.) | 1.1% | 0.7% | -4.6% |
| Tenants’ & Household insurance | 0.4% | -0.1% | 4.0% |
| Car and truck rental | 0.1% | -4.6% | -10.1% |
| Postage & delivery services | 0.1% | 0.4% | 3.7% |
Core services price level. Since February 2020, the core services CPI has increased by 20.4%. This chart of the core services CPI as index value, not as percentage-change of that index value, shows how the curve of price levels has steepened over the past seven months.
Durable goods CPI.
The durable goods CPI fell by 0.5% (6.1% annualized) in April from March and by 3.2% year-over-year, as the decline accelerated.
New and used vehicles dominate this index, which also includes information technology products (computers, smartphones, home network equipment, etc.), appliances, furniture, fixtures, etc. All categories have been experiencing price declines, as prices are coming down from their pandemic spike that had ended in mid-2022.
From March 2020 to the peak in August 2022, durable goods prices spiked by 23.4%. Since then, they have dropped by 4.5%, having unwound nearly one-quarter of the pandemic spike.
| Major durable goods categories | MoM | YoY |
| Durable goods overall | -0.5% | -3.2% |
| New vehicles | -0.4% | -0.4% |
| Used vehicles | -1.4% | -6.9% |
| Information technology (computers, smartphones, etc.) | -0.1% | -6.6% |
| Sporting goods (bicycles, equipment, etc.) | 0.9% | -1.1% |
| Household furnishings (furniture, appliances, floor coverings, tools) | -0.4% | -2.8% |
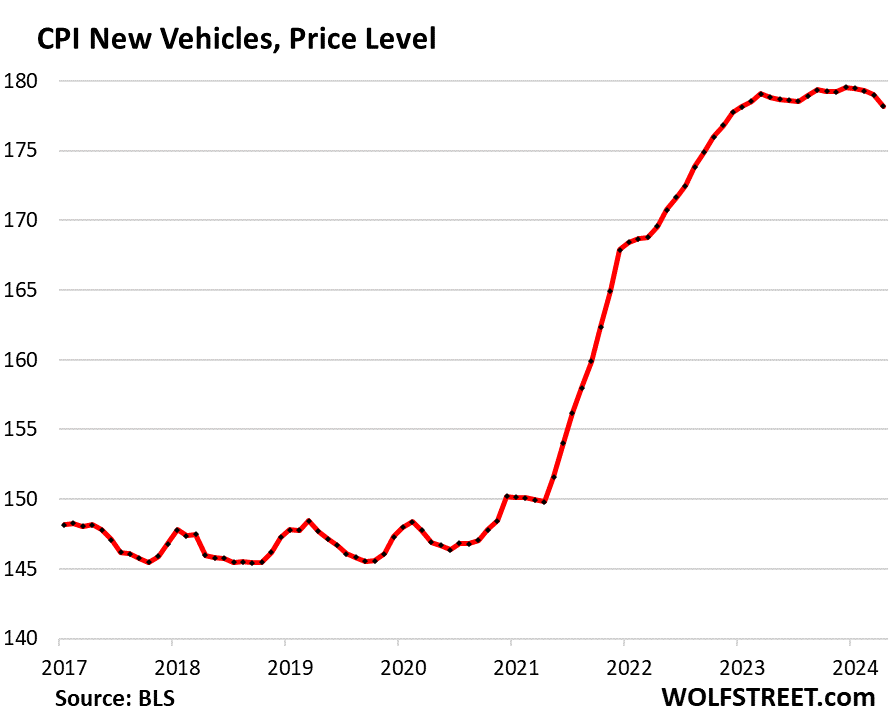
New vehicles CPI fell 0.4% in April from March, the fourth month-to-month decline in a row. Year-over-year, the index also fell by 0.4%, the second month in a row of declines.
Since March 2023, the index has barely changed. New vehicle prices, unlike used vehicle prices, have turned out to be very sticky after the 20% price spike in 2021 and 2022.
But the recent declines – documented on dealer lots by massive discounts and incentives on certain models – may have finally broken that stickiness.
In the years before the pandemic, the new vehicle CPI zigzagged along a flat line, though vehicles were getting more expensive. This is the effect of “hedonic quality adjustments” applied to the CPIs for new and used vehicles and other products (detailed explanation of hedonic quality adjustments in the CPI).
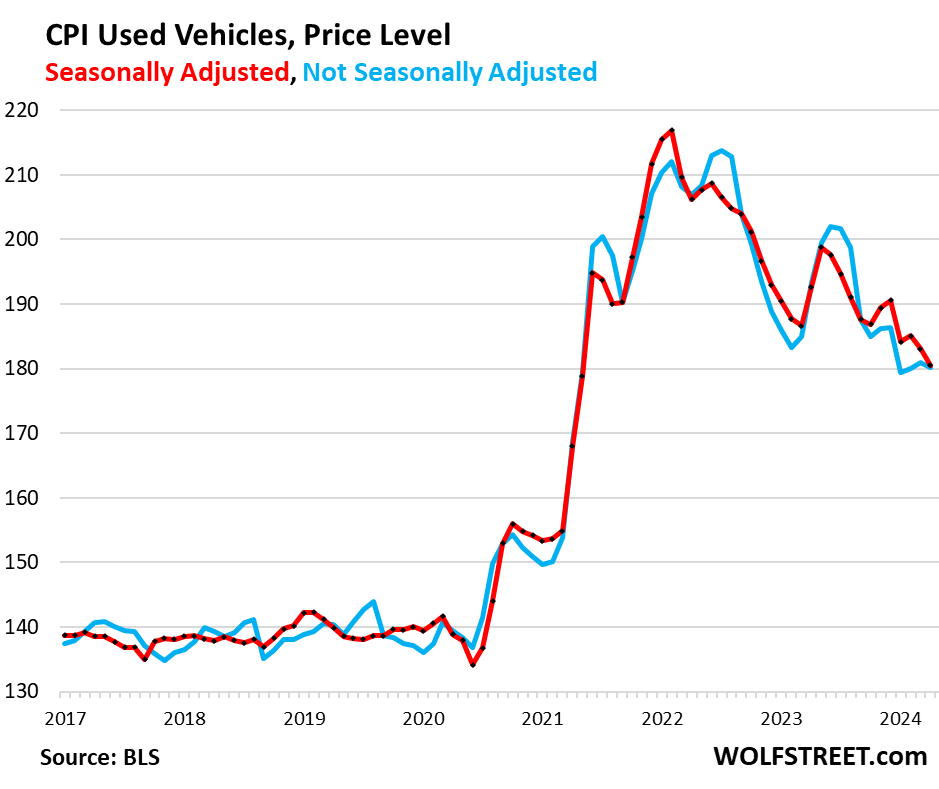
Used vehicle CPI fell by 1.4% seasonally adjusted in April from March (red); not seasonally adjusted, it dipped by 0.4% (blue).
Used vehicle CPI had spiked by 53% from February 2020 through January 2022. From that peak, it has dropped by 16.8% (seasonally adjusted), having given up nearly half (47.7%) of its pandemic spike. At auctions, wholesale car and truck prices experienced an even steeper historic plunge.
Food Inflation.
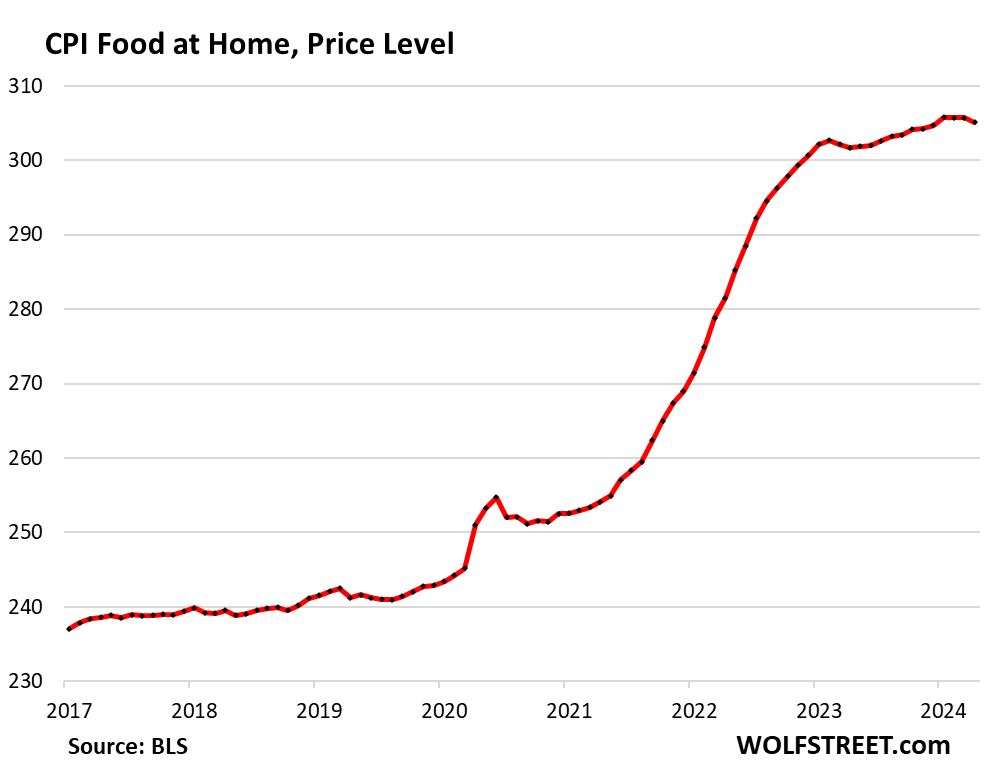
Food at home CPI – purchased at stores and markets and eaten off premises – dipped 0.2% in April from March, and was up 1.1% from a year ago. After the pandemic spike, the index is still up 25% from February 2020.
| Food | MoM | YoY |
| Food at home | -0.2% | 1.1% |
| Cereals, breads, bakery products | 0.6% | 0.6% |
| Beef and veal | 0.1% | 7.0% |
| Pork | 0.0% | 1.2% |
| Poultry | -0.6% | 0.9% |
| Fish and seafood | 0.3% | -2.1% |
| Eggs | -7.3% | -9.0% |
| Dairy and related products | 0.1% | -1.3% |
| Fresh fruits | -1.7% | 0.5% |
| Fresh vegetables | -0.6% | 2.3% |
| Juices and nonalcoholic drinks | -0.1% | 3.3% |
| Coffee, tea, etc. | -0.6% | -2.0% |
| Fats and oils | 1.0% | 2.8% |
| Baby food & formula | -0.3% | 5.1% |
| Alcoholic beverages at home | 0.0% | 1.6% |
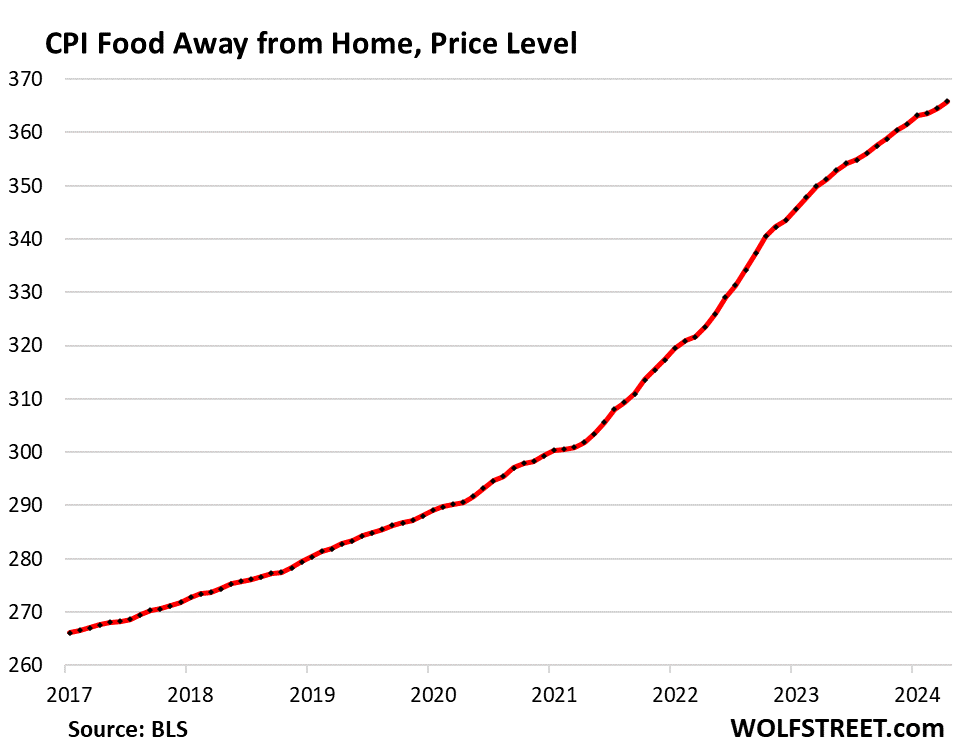
Food away from Home CPI rose by 0.3% in April from March and year-over-year by 4.1%, following the price spikes in 2022 and 2023. Since February 2020, the index has soared by 26%.
The category includes full-service and limited-service meals and snacks served away from home, food at schools and work sites, food from vending machines and mobile vendors, etc.
Energy.
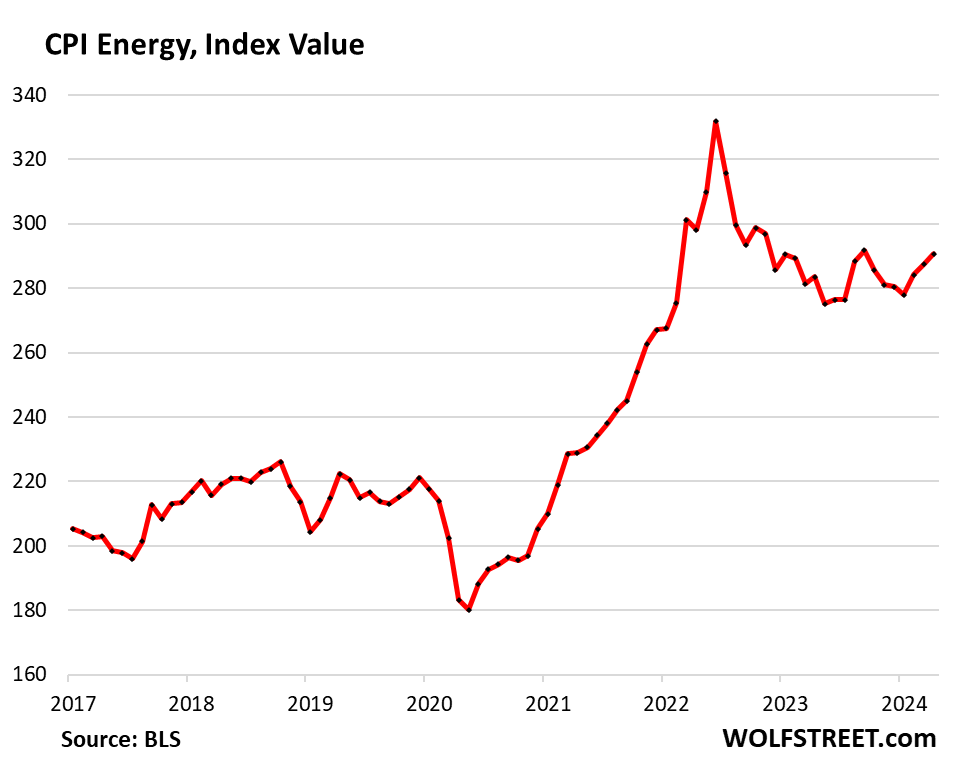
The CPI for energy covers energy products and services that consumers buy directly. On a month-to-month basis, it rose for the third month in a row. Year-over-year, it rose for the second month in a row:
| CPI for Energy, by Category | MoM | YoY |
| Overall Energy CPI | 1.1% | 2.6% |
| Gasoline | 2.8% | 1.2% |
| Electricity service | -0.1% | 5.1% |
| Utility natural gas to home | -2.9% | -1.9% |
| Heating oil, propane, kerosene, firewood | 2.3% | -0.5% |
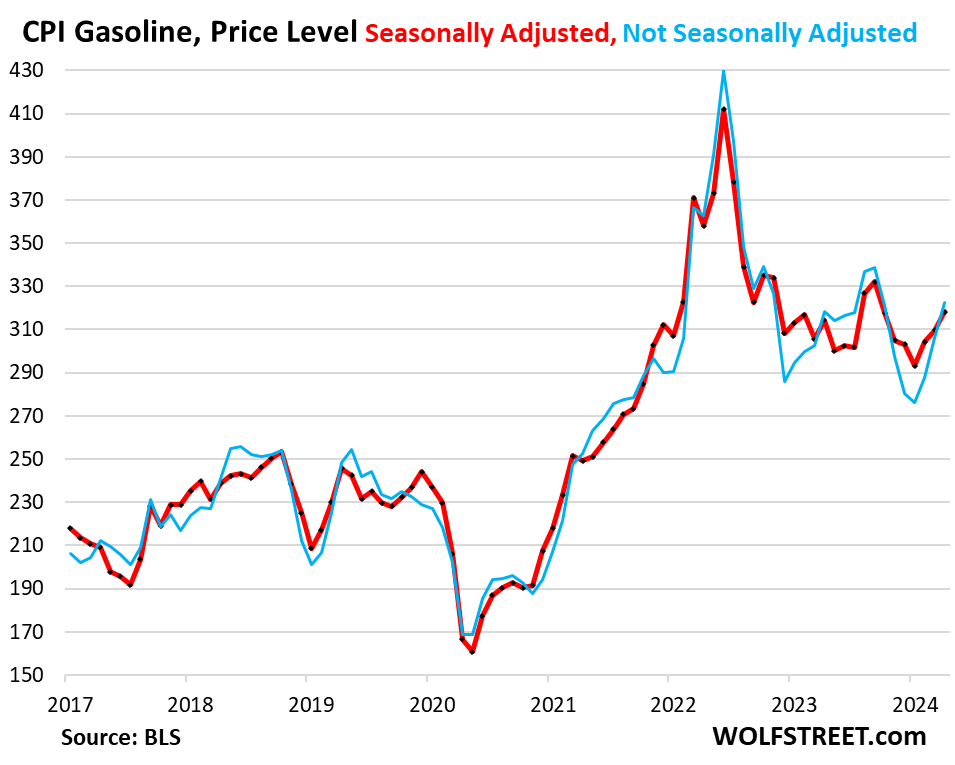
Gasoline prices – about half of the energy price index – are very seasonal, with the lowest prices in December or January and the highest prices during driving-season in the summer. The chart shows the seasonally adjusted price levels (red) and the not seasonally adjusted price levels (blue), and both rose for the third month in a row:
Enjoy reading WOLF STREET and want to support it? You can donate. I appreciate it immensely. Click on the mug to find out how:

![]()
Howdy Youngins. CPI
2021 1.4 1.7 2.6 4.2 5.0 5.4 5.4 5.3 5.4 6.2 6.8 7.0 4.7
2022 7.5 7.9 8.5 8.3 8.6 9.1 8.5 8.3 8.2 7.7 7.1 6.5 8.0
2023 6.4 6.0 5.0 4.9 4.0 3.0 3.2 3.7 3.7 3.2 3.1 3.4 4.1
2024 3.1 3.2 3.5 3.4
Higher for a lot longer or learn to disco youngins. And by the way, 5 % interest is really not that high.
And base effect going to start kicking in for the YoY figures, as those high prints in H1 of 2023 start to fall away.
All of the prints above 4.0 from the start of 2023 have already fallen away for YoY purposes.
I think I read your comment backwards in terms of the impact of the base effect going forward. Reading it again I think you meant the base effect will no longer show inflation moderating quite as much after the high prints from early 2023 have fallen away.
Yes, as you noted below, the base effect “headwinds” if that’s what they could be called are beginning to fall away. So this should generate higher prints going forward…
Agreed. The general trend can be summarized as follows:
CPI is NOT heading down towards 2% anytime soon, so the Fed is paralyzed through 2024 as are consumers.
One can only hope that by the end of 2024, there’s a convergence of higher for longer FFR, very high credit card / auto loan delinquencies, lower corporate profits that lead to a real erosion in the labor market, 3-4 CRE induced bank failures, and at least one good oil spike up to $100 / barrel. That just might overcome the anti-recessionary inertia that you get from $1.7T in annual deficit spending.
A recession is the only cure for 3.5% inflation. Otherwise, the Fed has to come clean and adjust it’s neutral inflation rate up to at least 3%.
The question is will the FED do it? The Market knows that the neutral rate is somewhere between 3.5-4%.
Does it?
The 10 year yield has fallen from 4.7% to 4.3% in a matter of two weeks, set off by Powell opening his mouth at every opportunity about “further rate hikes (being) unlikely.”
Equity valuations, meanwhile, are at ZIRP-QE levels.
The answer is very simple as obvious from history..Fed won’t do it.
Fed is trigger happy right now to cut rates
They haven’t cut at all despite the pressure they’re under from the government and from Wall Street to cut. They’re happy to sit on their hands. They’re happy to have reasons to sit on their hands. They moved the triggers out of easy reach. If they had wanted to cut, that could have cut in January already. Nothing stopped them. Except they don’t want to cut. They’re not stupid.
The fed is not stupid.
It’s the smart ones who are able to do stupid things.
I think you meant to say they’re stupid and incompetent, and not much different than the Washington hustlers.
The effective neutral rate is well above 7% right now. Need to account for the gov’t deficit/GDP effect, and the increasing dependency ratio, as well as the low unemployment.
“They haven’t cut at all despite the pressure they’re under from the government and from Wall Street to cut. They’re happy to sit on their hands.”
There appears to be money to be made by making the public think a return to low rates is just around the corner. Good for asset valuations and transactions.
I agree with Wolf in that the Fed has all the reason in the world to sit tight as long as possible. I think headline inflation will bounce up & down over an interval from 3.2 to 3.6 for the rest of 2024. For it to move down to 3% and below, 1st-time unemployment claims will have to move up to 250K and stay there for at least a month before slowly moving towards 300K. If this happens, then a recession will most likely be in the cards. Otherwise, 1st-time claims will average about 235K for the rest of the year. Companies are likely to start slowly trimming fat, but there’s not going to be the type of big layoffs that push us into a recession. For that to happen, oil will have to spike up to $100 and stay there for the rest of the year. And the only way this is going to happen is if Ukraine increases its success of knocking out Russian oil production.
5% times $1T is not high.
5% times $34T is very high.
But debt is meaningless according to the MMT crowd, because the G can always print money to pay off any level of debt.
Of course that creates vast inflation (because while the Fed can print symbolic money, it can’t print the real assets the money allegedly represents…).
But the Big Book of MMT (MSM Version) only sees fit to mention that little fact in an endnote on page 729.
Despite MMT theory’s pretty obvious stupidity, the really killing fact is that, more or less, it has been the justifying factor for actual Federal policy/operations for 50+ years (otherwise, how do you end up with perpetual deficits, running to debt of $34T plus…what was ever the plan?).
Just goes to show that your average, typical slimy politician (and America has had 50+ years worth) will seize upon the slightest intellectual pretense (no matter how self-evidently false) to justify/perpetuate their own agendas/graft.
Yes, 1% inflation, 3% interest is a thing of past now. Thanks to the reckless money printing by fed and spending by govt, we will live with high inflation, high rate for years.
I’m not sure why you have 13 figures in 2021-2023.
Wolf / DFB, I see that there was a significant drop in YoY CPI between May (5.0%) and June (4.0%) of 2023 and again from June (4.0%) to July (3.0%). I take this to mean that base effect “tailwinds” will start to kick in beginning for May 2024 CPI and thereafter as the high prints from late 2022 and early 2023 fall away.
Does that make sense?
A big part of the YoY figure are the first six months of month-to-month changes of that 12-month period.
In terms of core CPI, there were some high prints through May 2023 (0.36% in May). Then we got a series of low month-to-month prints (low point in June 2023 of 0.19%). Then they began ticking up from Sep through Dec, in the 0.28% to 0.32% range. And then in Jan-Mar this year, we got that acceleration in the 0.36% to 0.39% range.
To estimate a future 12-month CPI increase, you add up the month-to-month prints in that period, plus add an estimate for future month-to-month prints.
So over the past 11 months, the month-to-month increases add up to 3.20%. If you estimate that the core CPI for May 2024 month-to-month will be 0.36%, then your YoY core CPI will be 3.56% (3.2% for 11 months plus May 2024 of 0.36%). This would leave the YoY core CPI roughly unchanged for May.
Then for June, the high May 2023 reading (0.36%) will drop off, and the new June 2024 reading gets added. So that may be the low point of YoY readings. Then starting with the July reading, the low prints of June 2023 and forward start dropping off month by month. So if the new readings in the second half of 2024 are higher than the readings a year earlier that are dropping off, than that’s when we’ll see higher yoy core CPI numbers.
Thank wolf! All the six month cores of inflation is back in cpi readings from one year ago after declining! I’m starting to get some insight thanks again. We could get higher rates? Yield curve still inverted!
“Yield curve still inverted!”
Short term rates down or long rates up or both. It’s the only thing guaranteed in life besides death and taxes!
I don’t understand the fuss about the inverted curve. It just means that short term rates are bigger than expected long term. Period.
Would you expect otherwise?
It is not normal for the bond market to not compensate for duration risk with yield. At some point, it will normalize. That’s the only fuss I’m aware of.
It’s normal now.
Its “normal” as long as the fantasy of rate cuts remains alive.
“Would you expect otherwise?”
But who are these people who think that a country that has run 50+ years of essentially continuous deficits, and printed gobs of unbacked money to paper over the immediate consequences, will *not* have worsening inflation in the future justifying higher (much, much higher) interest rates in order to compensate?
A normal upward sloping yield curve exists because the standard course of history has been one of continuous controlled/uncontrolled inflation at the hands of the money printing power (the G).
Not quite 50+ years yet, CAS….Puppet of the then extremely wealthy Reagan began the unbalanced budget show a bit sooner, by drastically reducing the top tax rates……what his handlers insisted on.
To shift the distribution of wealth in their favor….not to mention all the other things included in his gleefully acted greatest script.
Maybe at the 50 year point more people will realize the human wreckage created, and even increase top tax brackets…..or is that too much to hope for now, now that corp top levels and other rich run Congress?
Wolf, back in the 70s and 80s we had an inflation problem that came in waves (three waves I think). Is there anything that you can point to that was the genesis of each individual wave or did they just happen with no identifiable cause?
If I remember correctly, two waves were triggered by oil shocks (on top of the already stretched monetary policies) that then became massive services inflation. I don’t remember what triggered the third wave.
Part of the problem with this wave theory is that it is based on year-over-year inflation rates. But if you look at the actual index, it always goes up, but sometimes a lot faster than other times, but not in these neat waves that the year-over-year data with its base effect gives you.
RE: Part of the problem with this wave theory…
Thanks for that explanation.
Agree, the actual index is very telling. We’ve entered a new regime with a steeper slope than historical.
That’s why the stock market must go up in the long term.
RE: the 1970s and 1980s were influenced Nixon by floating the dollar (a plan by Paul Adolph Volcker, Jr., under secretary of the Treasury for international monetary affairs from 1969 to 1974), the Plaza Accord, and Louvre Accord,
“if you look at the actual index, it always goes up”
Multiple news sources, regarding today’s lower rate of inflation, used the words “…giving relief to consumers.” As if prices actually fell. AS IF!
I don’t think they adjusted good’s inflation back then. Good’s CPI averaged -2% for the decade prior to COVID, so I assume it is 3-4% higher sans quality adjustments.
A lot of goods have gotten cheaper, a lot cheaper, over the many years: electronics, furniture, appliances, etc. Cars got more expensive, but a LOT better.
Owner, rent, medical, education, and motor vehicle, and insurance make up all of the needed services! No getting around it. Sloping up!
Stock market going nuts today after the great inflation report. I just don’t get it. Period.
Almost everyone on wallstreet wants the markets to go up because that’s how they make money, so they spin every news point as being positive, no matter what it is. This continues for years until something significant breaks. Then margin calls begin. Once that starts, margin calls on hedge funds take the markets down no matter what the news is. This continues until the margin is washed out. Nothing else matters. That’s what I tell myself.
Thank you for another detailed, non-biased analysis of the inflation data, Wolf.
I really like this explanation, I would just add that some bad news that goes too strongly against “the spin” will shock the markets temporarily like it did when rate cut expectations could no longer be maintained.
I also believe US fiscal policy is counteracting the FED, so unless FED gets more extreme or something more significant falls apart it’s business as usual. I also think big market participants aren’t so stupid, they know FED isn’t cutting anything, there’s money to be made on the pullbacks as well.
It wasn’t a great inflation report. It was less bad but still bad. That’s how corrupt the system is. Wall Street is smoking that rate cut hopium again.
It was an “in line” print too. Core CPI went up +0.3% M/M, as economists had estimated. Cleveland, which has been very accurate in forecasting PCE numbers after CPI & PPI have been released for that corresponding month, is saying April Core PCE will be +0.23% M/M, which is still above-target.
I guess retail sales caused another midday stock & bond buying-frenzy. Right now, the market is seeing every sign of economic weakness = higher likelihood of rate cuts = higher valuations.
What’s horrifying about this is that the surge in all the markets is directly causing inflation. The surge wasn’t just in stocks, it was also commodities, which directly translates into higher goods prices at the consumer level. Also money is flooding into crypto casino coin and long-term bonds; it was a buying extravaganza today.
Based on Shiller PE, this is the 3rd most expensive time for stocks in history (after the 2000 and the 2021 spikes). Based on Current PE, it is the 4th most expensive time in history (2008,2000,2021).
Everything is so correlated right now it’s difficult to differentiate between inflation and bubble mania. We’re somewhere on the spectrum of a) the US dollar has been demolished and we just haven’t seen the full impact yet, and b) the greatest asset bubble in all of world history.
Exactly, the only way inflation goes away is lower asset prices… so recession
Fed officials acting like they can’t figure out why housing costs are going up is such a joke… Let’s start with housing prices then add in insurance for ridiculously expensive house then add in maintenance for stupid expensive house…. Taxes… Margin for landlord and oh you have to keep increasing rents shocking.
If only more people were okay with being homeless then we could finally get inflation down and cut rates🤦
Rate cut mania 3 almost ready to take off tho anyways
Housing prices are going up because of demand. If buyers would sit out this summer, prices would drop.
Apple:
Housing prices are dropping big time in AZ. Only a few idiots buying right now. I agree, though. We need a few more months of this, and there should be a nice downturn in some areas.
Given the number of revisions in the last two years, I trust nothing the BLS spits out. The market (or algos) ofcourse react to the headline numbers but nobody talks about their revisions.
Yesterday’s downward revision of the PPI received extensive publicity.
Vadim, It got coverage extensively for one reason, and that reason was to beat the the high PPI report over the head with it.
Wolf would a hike fix the yield curve?
Probably not at this point. The longer-term bond market priced in lower inflation and a bunch of rate cuts, and expects the yield curve to get fixed by the front end coming down a lot. If the Fed hikes, the longer-term bond market is just going to move out the rate cut expectations a little. There is HUGE demand for longer-term Treasuries at around 5%. It’s very hard to get longer-term yields past that unless the inflation scenario changes in a big way, and the Fed lets it run away, which I think that would spook the bond market, and longer-term yields would jump and the yield curve would be fixed. Not sure how likely that is though.
Sounds like two scenarios. Came across something about the end of year to see a normal yield curve but much lower rates. Like in the threes like you said about the bond markets. I’m not to sure of that myself though. One thing we know is the huge demand out there for 5. Thank you.
Fed cuts rates… inflation expectations go UP… longer duration yields rise.
Fed raise rates… inflation expectations go Down… longer duration yields fall.
It does not matter if rate cuts are hikes “work”, the market reacts on expectations.
This is what’s supposed to happen, except when mania enters like in the yield spike ending October, 2023. There was endless chatter that the Fed would need to hike even further, and the 30 year crossed 5% even though theoretically sledge hammer hiking should have lowered long term inflation expectations, thus lowering the long bond yield. Two explanations:
1. Irrational markets did irrational things
2. Bond market called BS on the further rate hike chatter and saw inflation entrenching so they sold off long bonds.
I think #1 was most likely what happened. The disinflation in the few months following disproved both 1 and 2. Now we looking at a similar setup – next two months have low low comps rolling off while inflation has been consistently running +.3 MoM – except the Fed is all but proclaiming hiking is not a possibility. There’s a good chance a Fed holding under that scenario sees the curve start to flatten. If it uninverts at FFR 5.25-5.5 then it means the bond market believes the Fed has lost control.
It’d be fixed. It’s a matter of time.
The way it’d be fixed is like this:
Fed cut rates aggressively due to some reason and the long end stays at 3-4%.
You know my opinion about the relationship between inflation and interest rates.
This is the longest inverted yield curve ever. Last one was 1978.
Dear John. I have been hearing Disco music for quite awhile now.
Sounds more like music from 1967 to me.
Yield curve is a predictor of recession when there is no interference from FED.
FED has rendered Yield curve useless as a predictor of recession.
The whole asset markets of all kind now look towards FED and FED has been instrumental in propping up bubbles of all kinds.
I doubt if FED ever stop supporting it.
This has been on my mind, and I believe this is quite correct.
If the banking industry never has to mark to market, and can borrow indefinitely from the Fed… What does it matter what their 10 yr treasuries are worth?
Banks have to mark to market some of their bonds, but not all.
Great point. The FED is the boss now and they all worry if the Fed is politically motivated. Imagine how far you can take this….
all humans have their own biases of all kind including political biases.
With no biases, we all become machine.
Off subject, but… I think biases are for self-protection. We go with familiar things that are considered safe and are apprehensive of things unknown. Stereotyping is part of this evolutionary protection.
Our challenge is to suspend our biases which can be good or bad, depending on the outcome. Biases are filters that screen-out things, for better or worse. The greater the bias, the greater the thickness and opacity of the filters.
I do not think that the absence of bias means you become machine-like. I think you’d become more child-like, more open, more vulnerable.
The curve is predicting recession for years. And nothing. The curve is reflecting reality, not shaping or predicting the reality. I don’t get the fixation about it.
Indicators are good until they’re not good. Phillips Curve is an example. Economic activity is so complex that simple measures can’t anticipate what’s next, in spite of the multitude of books written about key economic indicators. But we have to go with something…
Charts that Wolf posts should make it clear that “trends” are just about anything you want them to be. If you’re right, you’re confident about interpreting trends. If wrong, you just find a wider trendline and wait to be right again.
Inverted yield curve is an unnatural state of being. Future money is supposed to be worth more than current money.
How many other times in history has such a large portion of Treasury issuance been at the front end of the curve? I suspect if Yellen was issuing more long bonds than short term paper we’d see a very different yield curve.
The Fed is going on what they think will work. If it turns out to be a serious mistake, the Monday morning quarterbacks will rail against them for not seeing what was so obvious a few years back.
The Fed has been “going on what they think will work” for twenty years, and what they think will work has failed to work over and over again.
But please note that it’s the Treasury, not the Fed, that issues bonds.
MW: Major stock indexes all close at new record highs after April CPI reading sparks relief rally…
Thanks a lot WR for keeping us up to date on these.
Your hard work is truly appreciated!
I guess all these numbers don’t really make sense .
“. But 6-Month Core CPI Hits 4.0%, 6-Month Core Services CPI Hits 6.0%, Both Highest since mid-2023 ”
The market is the place where the rubber meets the road. Everywhere else is just paper/academic exercise.
The market is up quite a lot and been going up and up.
The market may, in fact, be where the rubber meets the road. But it can just as easily be where the road meets the rubber.
”markets” are where the various and sundry and extensive fictions, especially the fictions re USD meet reality…
USD is down from $100.0 to $1.0 or close, since the FRB was established to protect the banksters against THEIR stupidity at the very clear expense of the stupidity of WE the PEONS.
To think otherwise is to ignore the very very clear delta(s) in the very very clear ”well being” of the banksters VS. PEONs…
It is remarkable to me how Wall Street and the MSM spin this data (and yesterday’s) as Bullish for risk assets.
They don’t have to spin it. It *is* bullish for risk assets. The Fed has visibly had an itchy rate cut trigger finger for months now, and the markets have correctly interpreted these latest figures as data that will nudge the Fed to pull the trigger earlier (not imminently, but earlier than anyone thought, say, a month ago).
Pretty much everything the Fed has done since early 2023–stopping rate hikes too soon, bailing out uninsured Silicon Valley zillionaire depositors, discarding the idea of selling MBS, publicly signaling a rate cut bias in December–has been bullish for risk assets.
The Fed and their supporters can certainly pretend that they’re hawkish because they’re sitting on their hands, but the fact is that they’re sitting on their hands during some of the loosiest-goosiest financial conditions the world has ever seen, while inflation remains well over target and shows signs of reaccelerating.
Good to see addicts (aka the market and rate cuts believers) got their line of yayo today…guess we’re getting a rate cut next month from these people’s perspective….
Me thinks this never ending hopium cycle we are in will never end…welcome to the new normal…the fact that Gamestop is once again a meme stock again goes to show how ingrain this mindset is now..
“…the fact that Gamestop is once again a meme stock again goes to show how ingrain this mindset is now..”
I think it shows that there’s still a TON of cash out there because I don’t believe in mind over matter, there has to be real cash (or available margin) to pump anything.
Yeap, a lot of free capital (liquidity) is moving through the US markets now. The repos are still about 450 billion dollars. Money sitting around at the Fed for >5% wait to find a place to speculate investment for a while.
Yeyo*
Hi, Wolf. I know the BLS changed the formula, but you used to breakout details about the health insurance CPI in these reports.
What’s going on with it these days? Even smoothed out, is it applying steady upward pressure on the overall CPI to make up for the FY23 monthly mega-push-down adjustments?
The health insurance CPI is “Chickenshit,” according to Wolf Richter. So based on that fact, I no longer waste my time covering it, after having spent well over a year dealing with it. The BLS needs to come up with a new method, and when it does, I’ll cover that transition and its mechanics and reasons.
Also, thankfully, because of the collapse of the health insurance CPI, its weight in overall CPI has fallen by nearly half, from 1.1% in Nov 2021 to 0.58% now. So it matters only half as much as it used to.
Wow, so did they find a new way to bury rising health insurance costs by reducing its weight in the overall CPI? Or are you thankful because it was over-weighted before?
I re-read your “chickenshit” article before posting my original comment. Based on the last six month’s reports, is there any way to tell where the HI CPI is now? For example, last October, it was at August 2018 levels. Is the BLS claiming that it’s only a few percent above that level? Will their crappy, marginalized health insurance CPI metric also be “higher for longer”?
I don’t think your previous reports were a waste – you’re one of the few people reporting on this. All of your readers got to watch this train wreck in slow motion. For new reader’s sake, please renew the call to “fire everyone”!
I still track this chickenshit, but I just don’t bother discussing it anymore.
So I hafta discuss it: MoM +0.3%; YoY -11.6%.
This is the chickenshit index as price level, which is still back where it had been in 2018. It’s not really coming up, it’s barely contributing to MoM CPI and it’s still pushing down YoY CPI.
Now that I’m talking about it, I see an article coming: “Why the BLS needs to replace its Chickenshit Health Insurance CPI method.”
Mortgage rates back in the (very high) sixes today. The rate cut mania party is back on!
Canadian financial bloggers be assuring rate cuts and million-dollar Canadian peso homes while rents are going back up again!
And the US M2 money supply and especially the Canadian M2 money supply appear to be going upwards again (based on recent data)…
Z
This quote: “Many Canadians can improve their financial well-being simply by following a budget, says a report by the Financial Consumer Agency of Canada.
Though 93% of people who have a budget stick to it most of the time, only 46% of people have a budget. The study also reports that, while two-thirds of working people are preparing financially for retirement, almost the same proportion say they don’t know how much they should save.”
My point is this. All the angst and cynicism about whatever policy exists that is currently screwing people over, be it Canadians, US folks suffering the Fed…whatever, it always comes down to making choices in the circumstances you find yourself. Time machine back to 18% interest days of the 80s and a payday for moi. After my budget was addressed I had an incredible $2 left over for spending money until the next payday. My buddies went for a payday lunch and I begged off with a packed lunch pail from the night before. Always. For years. Somehow we managed to buy a house, drive a car, and pay the bills. As the years passed it became easier and easier, especially when the house was paid off. There were no computers with handy budget spreadsheets, only the cheque book recordings and a penciled in budget of expenses on foolscap. These were also the days of double digit inflation, 10%+ unemployment, etc etc. I worked away from home for just over 3 years. You didn’t complain because you didn’t want to admit to anyone you were sucking the hind teat. Over time, it all works out. When you are starting out, unless your folks are rich, everyone is broke. Everyone.
This is nothing. The biggest health problem these days seems to be obesity. And even that is someone else’s fault.
What’s a toonie worth when the greedy slumlords are hiking rents by hundreds of dollars a month every new lease agreement?
Arent you also job hopping every 9 months and getting a raise? Data indicates so.
Ahh yes slumlords. With their cliche, villanesque mustaches, are surely rubbing their hands and asking “how ELSE can we screw over the plebs? Muahaha”
Or, ya know, maybe their costs just went up too.
Well said. Thank you for sharing.
Yes us as well. took tea bags to work never bought lunch at work. Dead broke when we got married at 20. We ate rice for at least a couple of dinners a week. Wife clipped coupons still does. and we worked 12-14 hour days for decades. everyone says the boomers had it made but it was not all that easy. Now we have a nice house and no debt, worth the sacrifice eh not sure.
You were young during a time when tall estate was affordable. Those days are long gone. Your stories of eating rice for dinner are charming, but they are about as relevant today as a story about getting a job as a flenser or a blacksmith.
Eating rice every day for a lifetime wouldn’t make up for today’s batshit prices.
I don’t know which is worse, B’s describing all their suffering, or bragging about what they now have and can afford to do….now that they are much more busy biologically decaying than previously….it’s actually jus the price of sex, deal with it.
I was there, and if white, we had it made, and I made the decision to enjoy all youth had to offer while I could, and war aside, faced “pay back” later. Starting with the Reagan puppet movie. Got lucky after 4-5 years of his agenda, but then have often been told I am “resourceful”, so maybe not total luck, but good parents?
Absolutely no regrets…..PS; am VERY sick of hearing about “hard earned money”, having REALLY done a LOT of it…..by choice. Have great work ethic, minimal ambition.
It’s not easy finding homes for a million in British Columbia and Ontario. That’s like a starting point.
Rent in Fairfield County, CT is nuts. $2300 for a 1BR…that was the mortgage on my first home
Shelter and cars… everything else is pretty low really. We’re not there yet but that’s not a bad YoY picture as it stands. The problem as you illustrate is the last few months being so high when the end of last year was so low. You’d have to have a repeat of last year just to stop the YoY going up. Without some serious deflationary factor (which looks unlikely), best case is inflation levelling out around the 3 – 3.5% level over the next year.
Separately, I wonder how the medical revisions are looking, I haven’t seen you mention that now they’re going up! Has that all washed through now or some more to come?
The health insurance CPI is “Chickenshit,” according to Wolf Richter. So based on that fact, I no longer waste my time covering it, after having spent well over a year dealing with it. The BLS needs to come up with a new method, and when it does, I’ll cover that transition and its mechanics and reasons.
Also, thankfully, because of the collapse of the health insurance CPI, its weight in overall CPI has fallen by nearly half, from 1.1% in Nov 2021 to 0.58% now. So it matters only half as much as it used to.
Interesting, thanks. That’s an incredibly low weighting – if only 0.5% of my wage went towards medical insurance!
A lot of insurance premiums are paid by employers, so that doesn’t figure into the CPI. In terms of retirees, they’re on Medicare, only part of which has monthly premiums, and they’re relatively low, compared to insurance.
That said, as screwed up as this method is, I hope the weighting goes to zero. If they cannot figure out how to measure health insurance, they need to take it out. This chickenshit has artificially pushed down CPI for a year-and-a-half.
“Shelter and cars… everything else is pretty low really.”
Good thing no one has to drive or live anywhere, huh?
I am just waiting for the government to tell me how much less expensive our Memorial Day celebrations will be this year, and why I should be happy.
Then I will know whether to buy chicken or wieners and buns this year.
Chicken or wieners?!
You’re living the high life.
I was thinking maybe spam and bread.
Thank you for these insights, Wolf.
Slightly off topic, but this seems like the best place to throw a take it or leave it request out.
Wolf, if we ever have a week with a shortage of economic data to muse on, I’d be interested in data on college tuition projections looking forward. It might also be interesting to see how past projections from ~2000-2010 and how they stack up against actual costs today.
There is a lot of interesting things going on in higher education with smaller schools shutting down due decreased enrollment and a shift to tech schools.
I’ve got a couple 529 plans for the kiddos that I need to try to fund appropriately.
Thanks for consideration of my idea/humble request!
Ditto for the interesting report request
The Fed needs to tell Congress and the public that they took a huge gamble that failed during 2020 and get out of the markets.
And stay out. It doesn’t matter if some fallout takes place.
Time to think longterm. The US has NEVER gone back after 2008 problems
For those of you looking for lower inflation…..almost nobody is covering it.
Read all about the new tariffs just imposed on Chinese goods and services.
About 18 months from now…..notice it’s timed to hand the next president the prize…….inflation is going to get another super charge.
TIPS, I bonds and yellow rocks…..for conservatives……and for the risk takers……the common stocks of the companies protected will be enhanced……hence the market reaction in the past sessions.
Wait a minute! I thought the world was going to end if one more ICE vehicle was put in production, or 1 or 2 more cow farts.
Thankfully we have a no border policy…kinda like no mow May,
Us commoners will get our affordable Chinese EV from the south.
DC will bluster, black rock & the rest will keep them in line.
For progressives, one should be thankful that the Federal Reserve is slow rolling inflation and putting an entire generation’s lives on hold for basic necessities of food, clothing and mainly shelter. Driving up housing prices out of reach for as long as these generations can foresee will create a huge population looking for the answers that only socialism can give them.
Yup.
We sold out the youngest generation to the benefit of the richest asset class holders.
Young people under 30 can’t afford homes or start families. I hope everyone who cheers the Fed policies on are real proud of themselves.
“Then I witnessed the torture of Sisyphus, as he wrestled with a huge rock with both hands. Bracing himself and thrusting with hands and feet he pushed the boulder uphill to the top. But every time, as he was about to send it toppling over the crest, its sheer weight turned it back, and once again towards the plain the pitiless rock rolled down. So once more he had to wrestle with the thing and push it up, while the sweat poured from his limbs and the dust rose high above his head.” (Odyssey, Book 11:593)
It seems Mr. Market didn’t get the memo that inflation is still high because both the 10 year and the 30 year yields fell yesterday.
Markets never “get the memo” on anything. They do what they do because they do it, which is why markets fluctuate all over the place.
The second wave of inflation is just starting, the Fed knows this. Higher for much longer!
So, is core inflation just inexorably moving into alignment with the Federal funds rate? That would be Mosler’s hypothesis.