20-City Index drops for 3rd month in a row, forms Double Top. Only Washington DC sets new all-time high.
By Wolf Richter for WOLF STREET.
The home price index for the 20 metros that the S&P CoreLogic Case-Shiller Home Price Index covers declined by 0.1% from the prior month, the third month in a row of declines. Year-over-year, the index was up 6.6%.
Year-over-year, wait a minute… today’s “January” 2024 reading is three months off the October 2023 peak, while January 2023 was seven months off the June 2022 peak. Year-over-year comparisons are meaningful when the index is very seasonal, and comparisons match the high in the current year to the high in the prior year, and the low in the current year to the low in the prior year. But this is not the case here. The highs are in different seasons (June v. October), because they were caused by factors other than the slight (if any) seasonality of the Case-Shiller index.
So the year-over-year change (+6.6%) compares today’s “January” reading that is three months off the October peak to January 2023 that was seven months off the June peak and was the bottom of a non-seasonal trough. For that exact same reason, the year-over-year changes will diminish over the next few months.
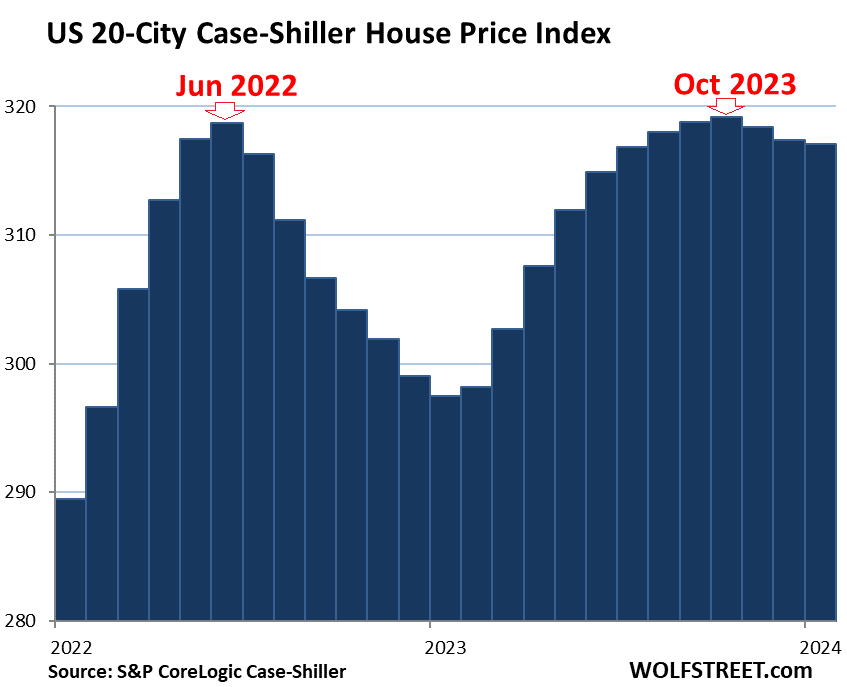
Today’s S&P CoreLogic Case-Shiller Home Price Index for “January” is a three-month moving average of home prices whose sales were entered into public records in November, December, and January. The fact that it is a three-month moving average irons out some of the seasonality.
The index uses the “sales-pairs method,” comparing the sales price of the same house over time, thereby eliminating the issues – including seasonality due to the seasonal change in mix – associated with median prices (see “Methodology” toward the end of the article).
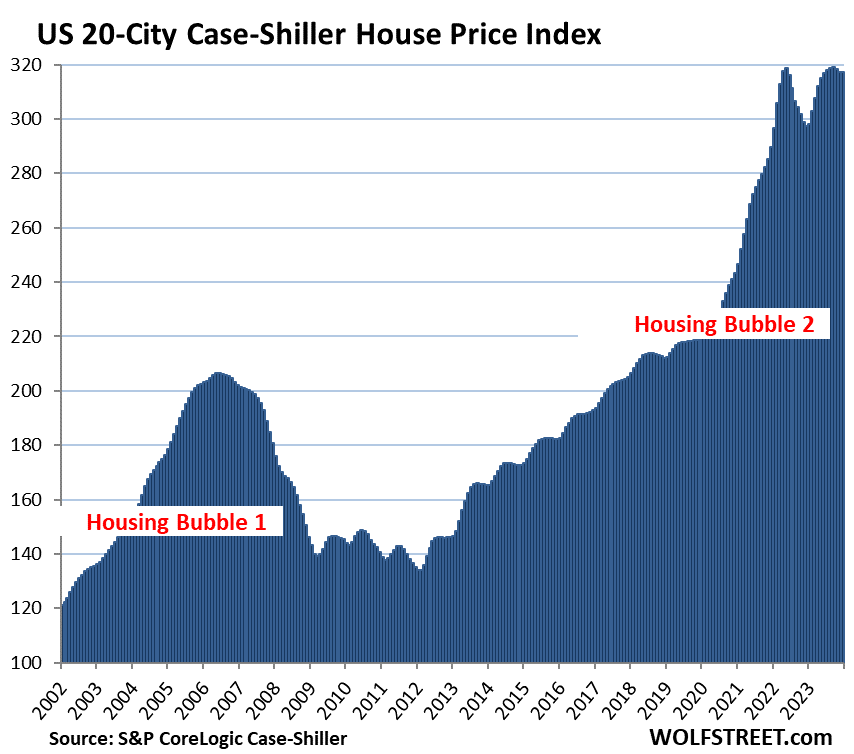
The long view of the 20-Cities Index shows the mind-blowing surge over the past few years; and it shows a bizarre non-seasonal double top that has never occurred in the history of the index, with the first top in June 2022 and the second top in October 2023.
You can also see that there is little seasonality in the index going back over 20 years:
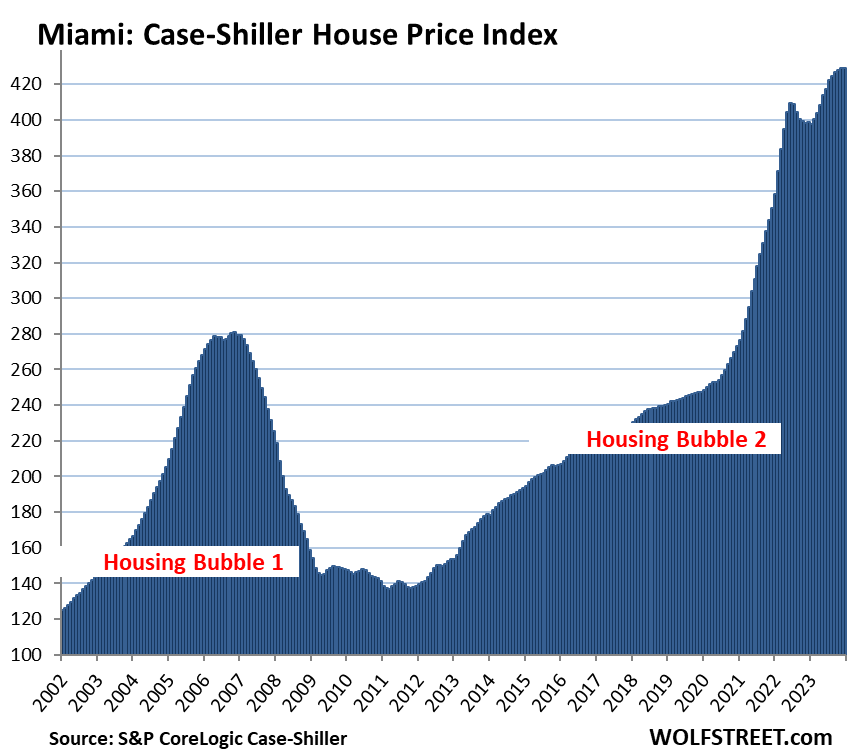
To qualify for the Most Splendid Housing Bubbles, the metro must have experienced home-price inflation since 2000 of at least 180%. The indices were set at 100 for the year 2000. Today’s index value for Miami, which we’ll get to in a moment, of 429 is up 329% since 2000, making Miami the most splendid housing bubble on this list.
Home-Price Inflation. By measuring how many dollars it takes to buy the same house over time via the “sales pairs” method, the Case-Shiller index is a measure of home-price inflation. So Miami had 329% home price inflation since 2000. By comparison, consumer price inflation, as measured by CPI, was 83% over the same period.
Prices were below their 2022 peaks in 9 metros of the 20 metros in the Case-Shiller index (% from their respective peak in 2022, month of peak):
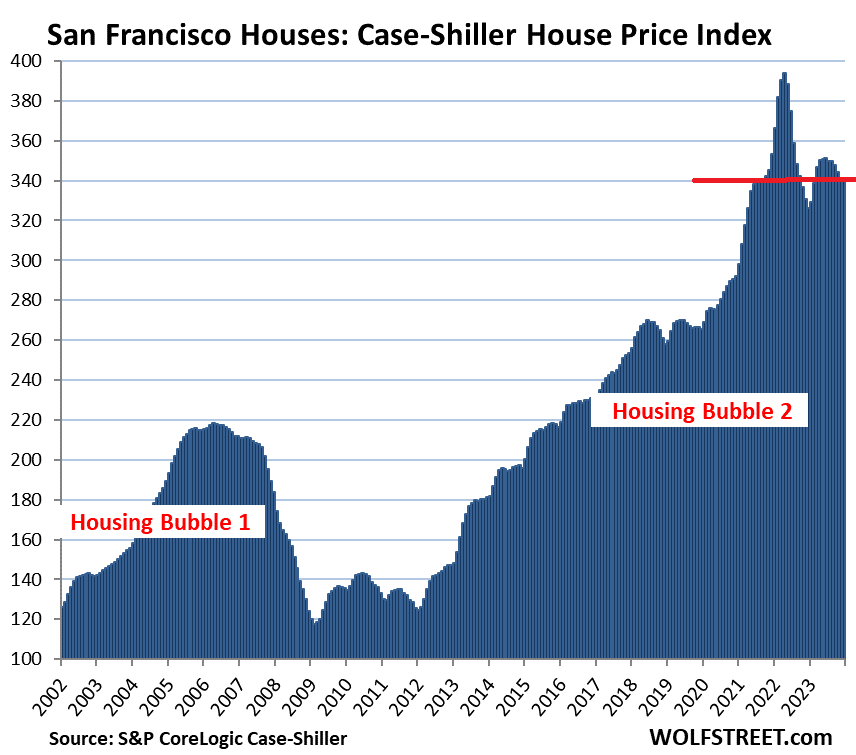
- San Francisco Bay Area: -13.4% (May 2022)
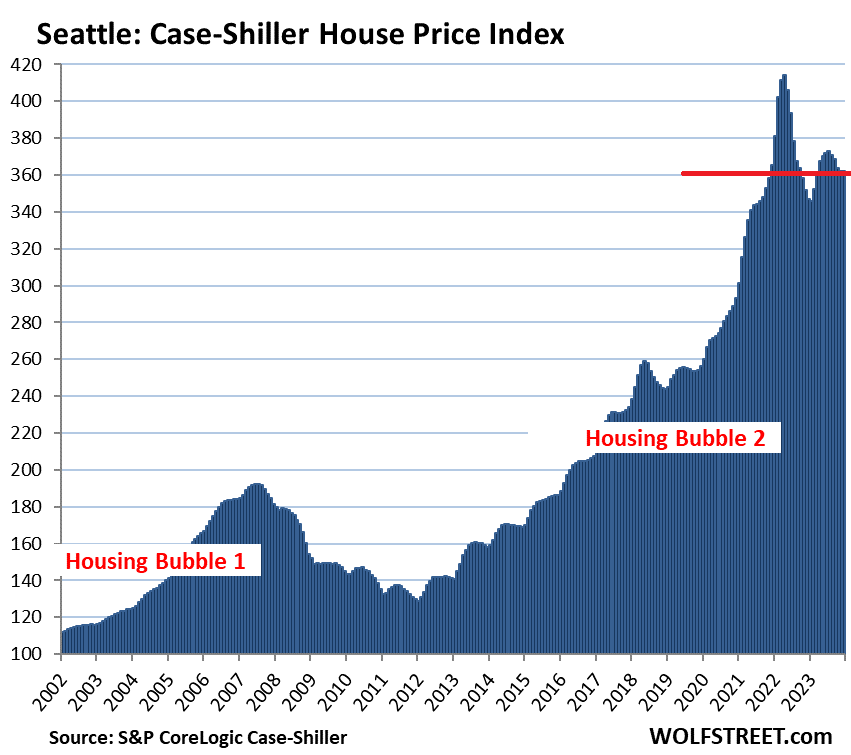
- Seattle: -12.6% (May 2022)
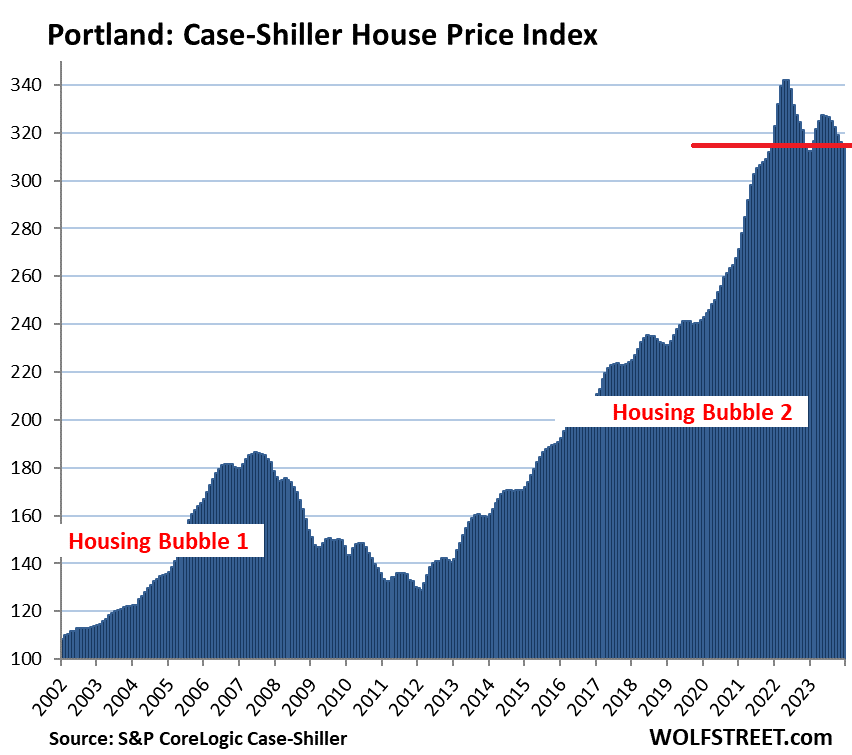
- Portland: -7.9% (May 2022)
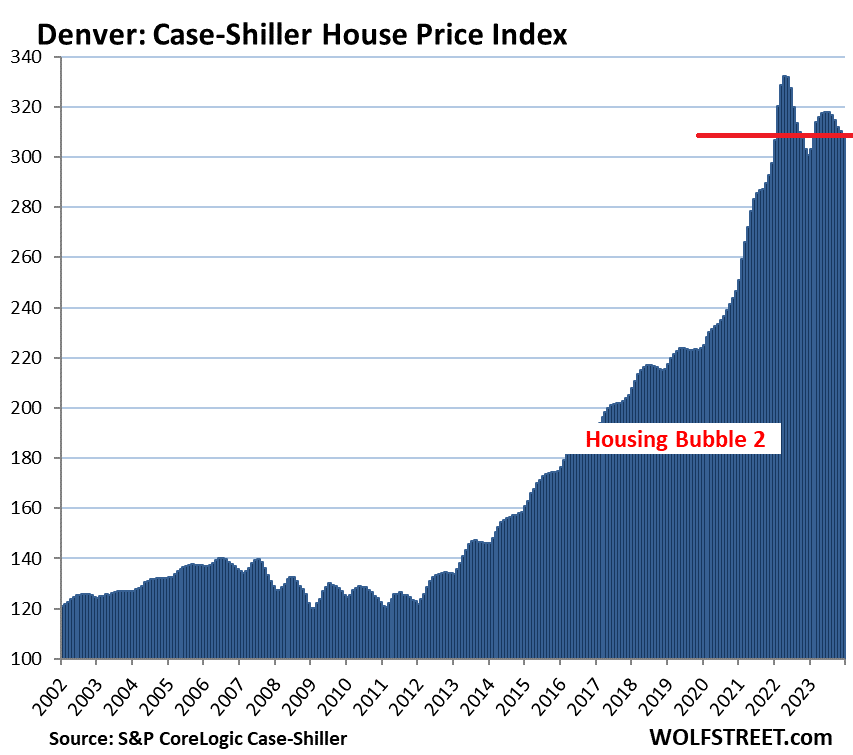
- Denver: -7.1% (May 2022)
- Phoenix: -6.5% (June 2022)
- Dallas: -5.8% (June 2022)
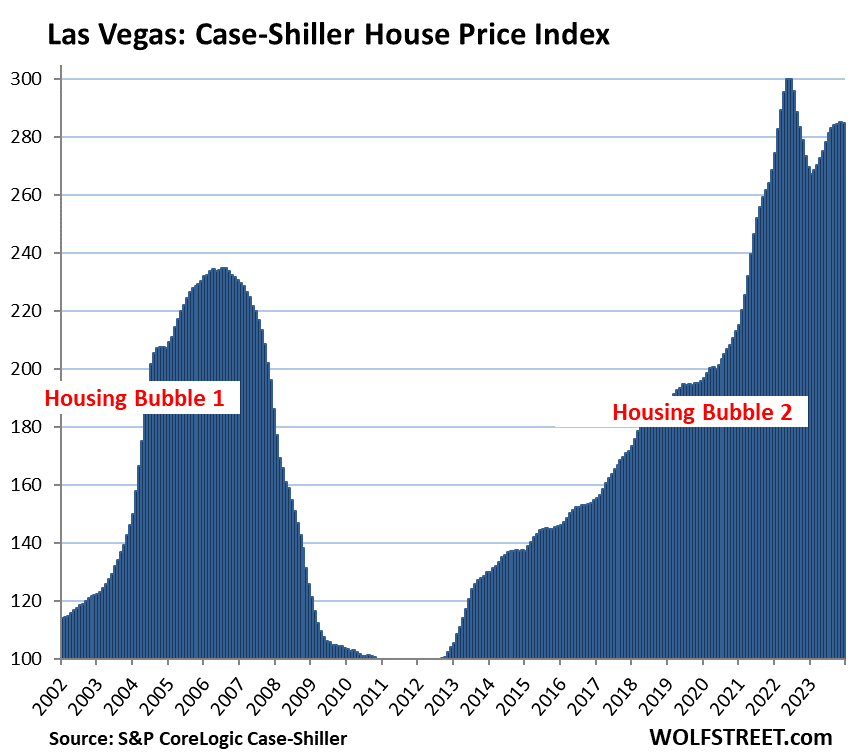
- Las Vegas: -5.1% (July 2022)
- San Diego: -1.5% (May 2022)
- Los Angeles: -0.3% (May 2022)
A few more points:
- Month-to-month declines occurred in 17 of the 20 metros.
- Month-to-month increases occurred in 3 of 20 metros: Washington DC, Los Angeles, and San Diego.
- The indexes for Los Angeles and San Diego remained a tad below the 2022 peaks.
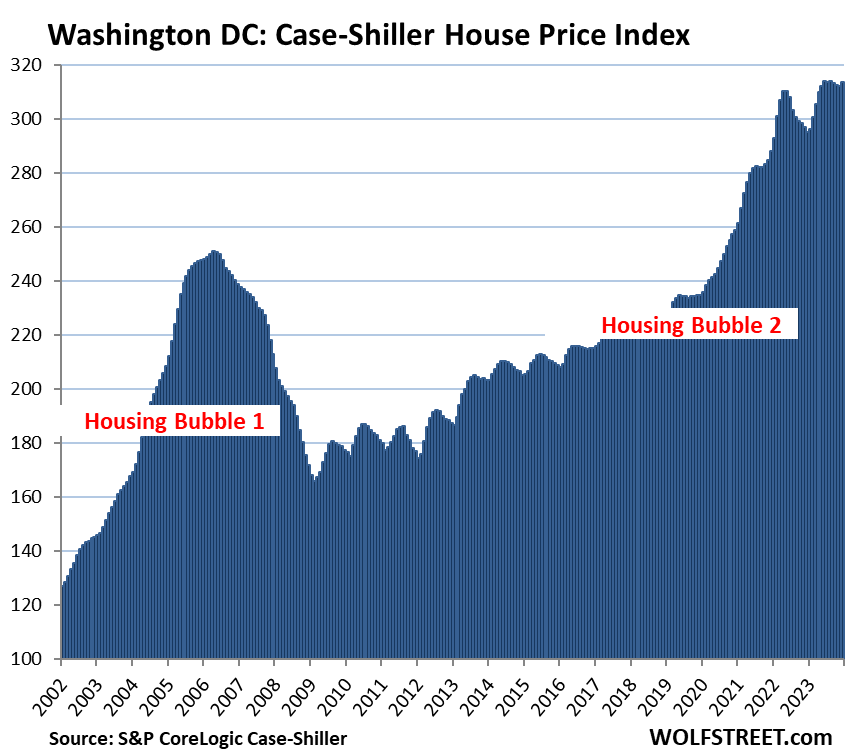
- One metro set a new high in January: Washington DC.
The most splendid housing bubbles by metro.
San Francisco Bay Area single family houses: the San Francisco metro here covers a five-county portion of the nine-county Bay Area (San Francisco, San Mateo, Contra Costa, Alameda, and Marin).
- Month to month: -0.1%
- Year over year: +4.5%
- From the peak in May 2022: -13.4%.
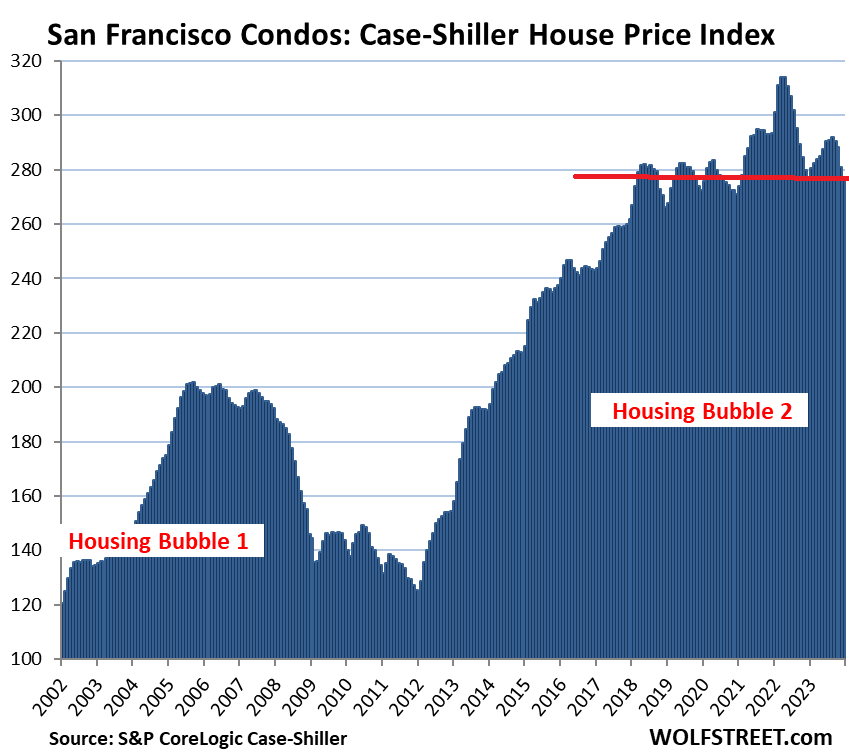
San Francisco Bay Area condos: Condos are a big part of the market in the Bay Area. In San Francisco itself, they dominate the market (data for a five-county portion of the Bay Area).
- Dropped to a level first seen 6 years ago, in April 2018
- Month to month: -1.5%
- Year over year: -0.1%
- From the peak in May 2022: -11.9%.
Seattle metro:
- Month to month: -0.02%.
- Year over year: +4.4%.
- From the peak in May 2022: -12.6%.
Portland metro:
- Month to month: -0.2%.
- Year over year: +0.9%.
- From the peak in May 2022: -7.9%.
Las Vegas metro:
- Month to month: -0.1%.
- Year over year: +5.6%.
- From the peak in July 2022: -5.1%.
Denver metro:
- Month to month: -0.5%.
- Year over year: +2.7%.
- From the peak in May 2022: -7.1%.
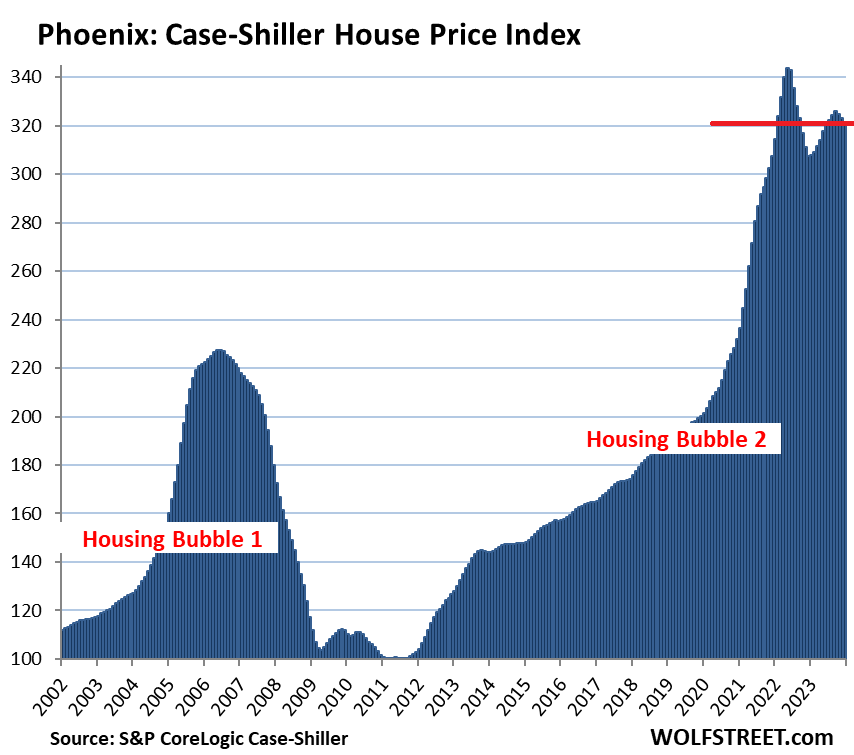
Phoenix metro:
- Month to month: -0.5%.
- Year over year: +4.6%.
- From the peak in June 2022: -6.5%.
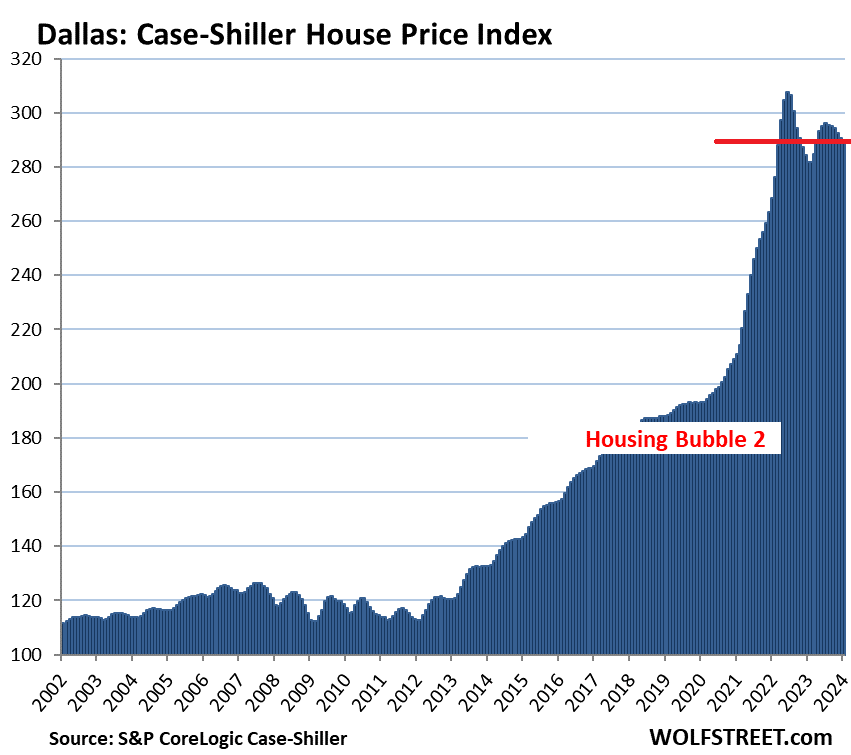
Dallas metro:
- Month to month: -0.2%.
- Year over year: +2.9%.
- From the peak in June 2022: -5.8%.
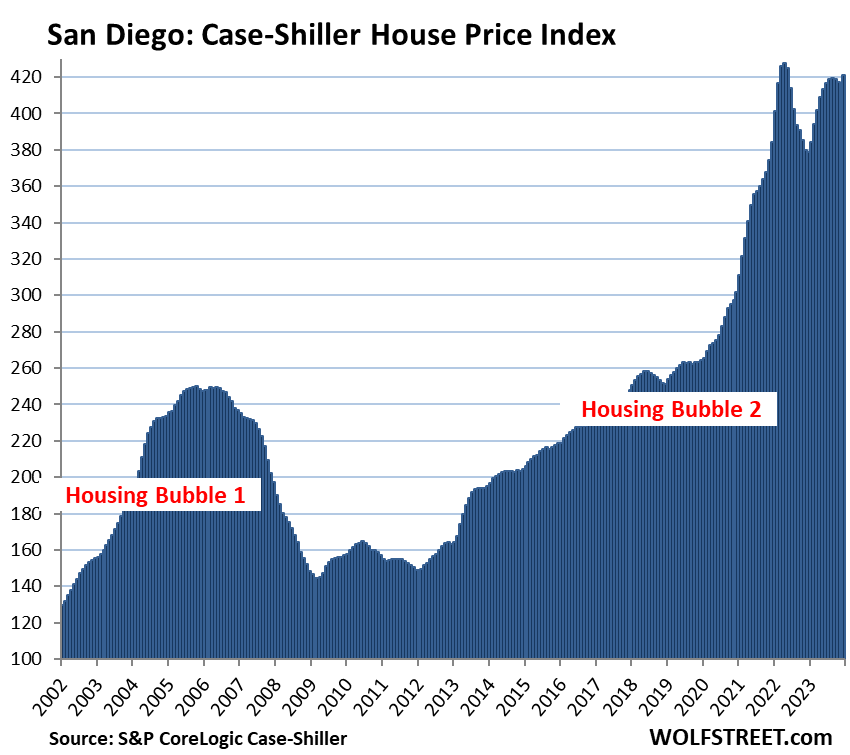
San Diego metro:
- Month to month: +1.8%.
- Year over year: +11.2%.
- From the peak in May 2022: -1.5%.
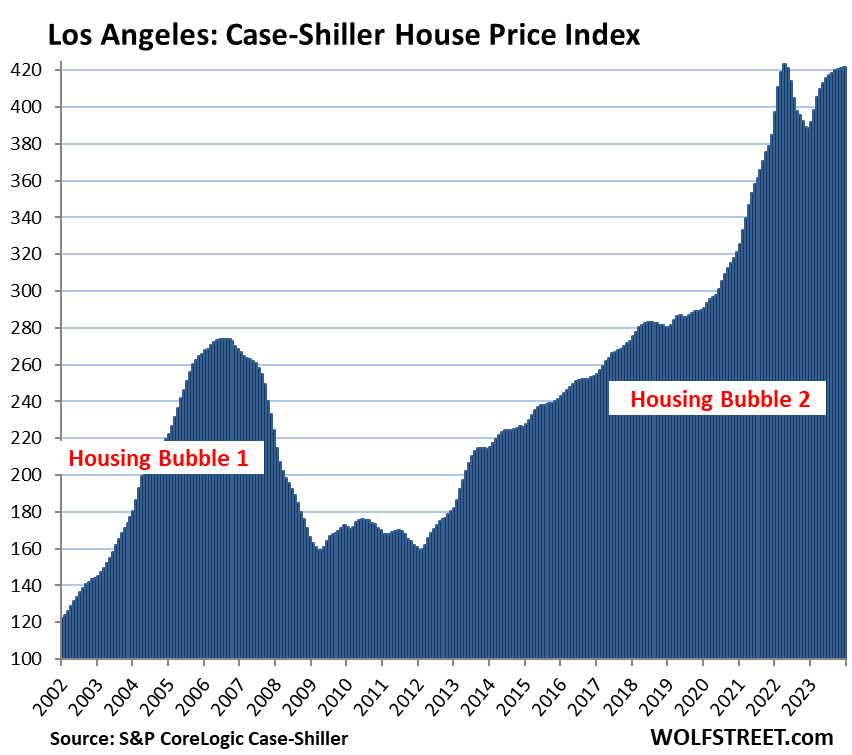
Los Angeles metro
- Month to month: +0.1%.
- Year over year: +8.6%.
- From the peak in May 2022: -0.3%.
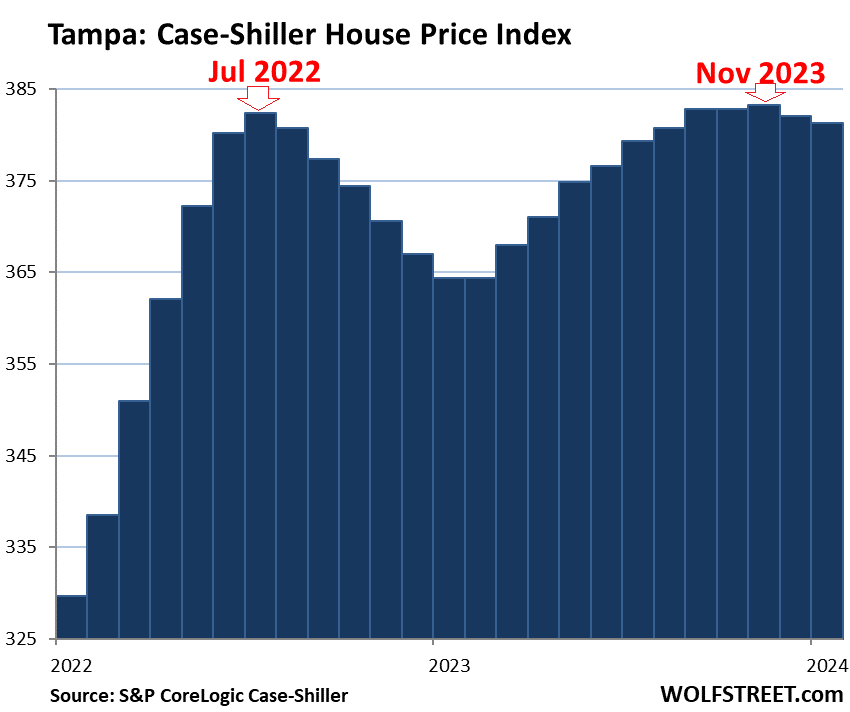
Tampa metro:
- Month to month: -0.2%.
- Year over year: +4.6%.
- From high in November 2023: -0.5%.
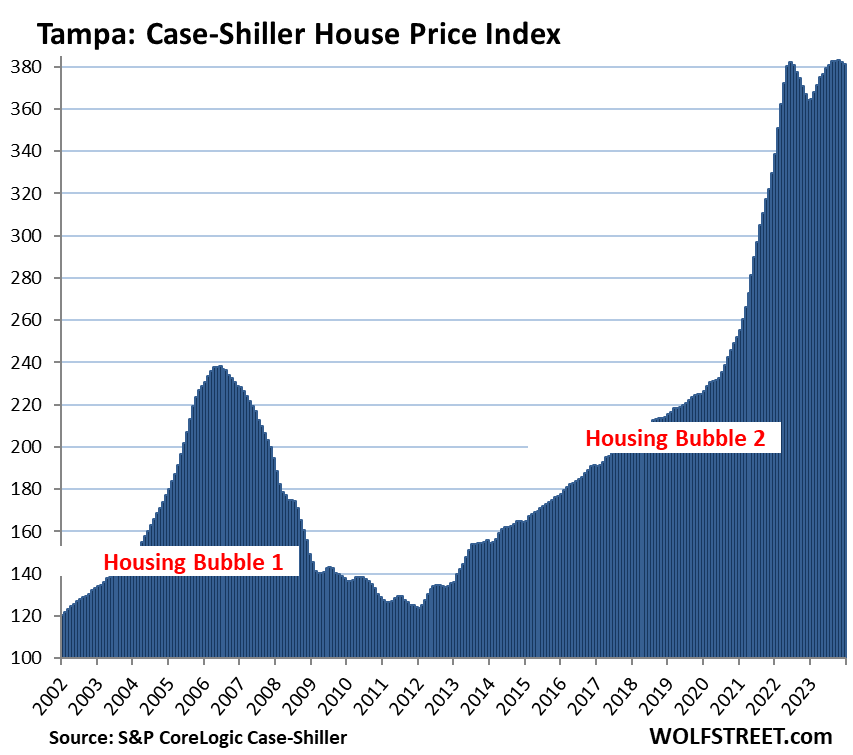
And the close-up of Tampa. It repeats the common theme here: The two highs were in different seasons, and not caused by seasonal factors, thereby creating these odd year-over-year comparisons that will revert over the next few months.
Washington D.C. metro:
- Month to month: +0.5%.
- Year over year: +6.3%.
- Set new high.
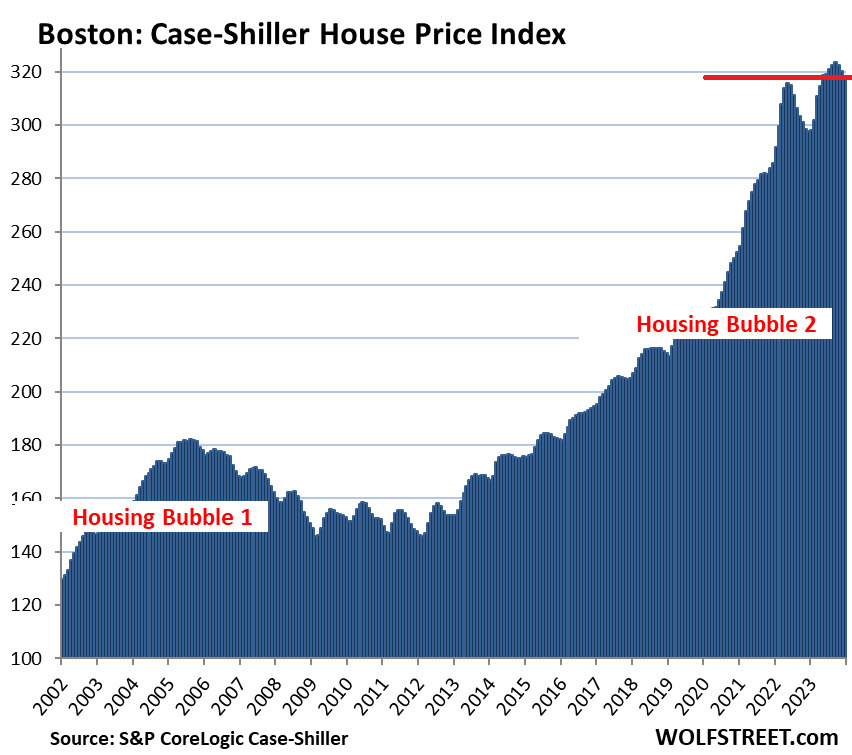
Boston metro:
- Month to month: -0.5%.
- Year over year: +7.0%.
- From high in October 2023: -1.5%.
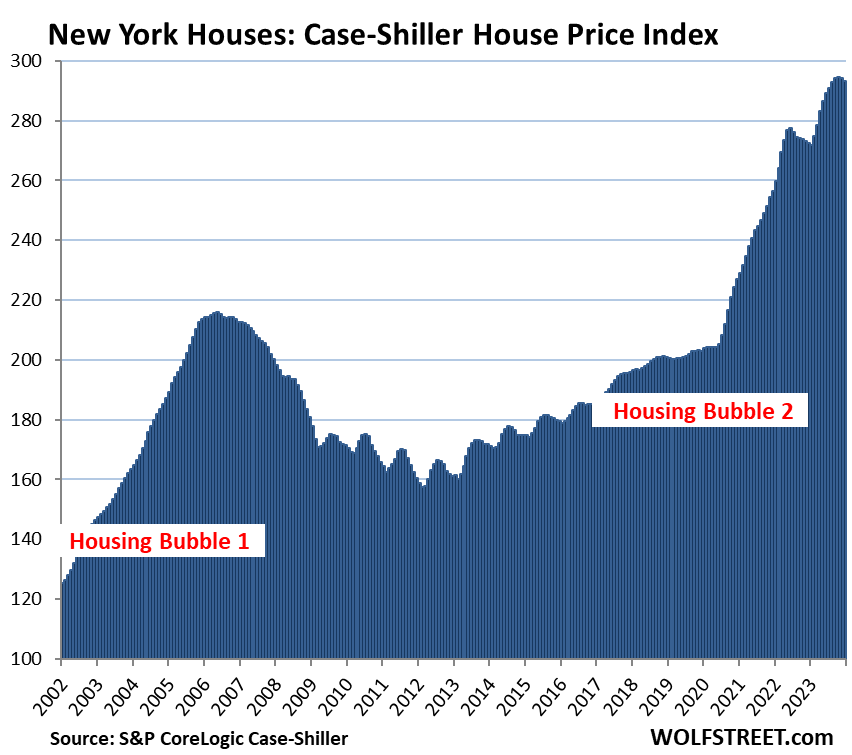
New York metro:
- Month to month: -0.3%.
- Year over year: +7.6%.
- From high in November 2023: -1.4%.
Miami metro:
- Month to month: -0.1%
- Year over year: +7.5%.
- “December” had set a new high.
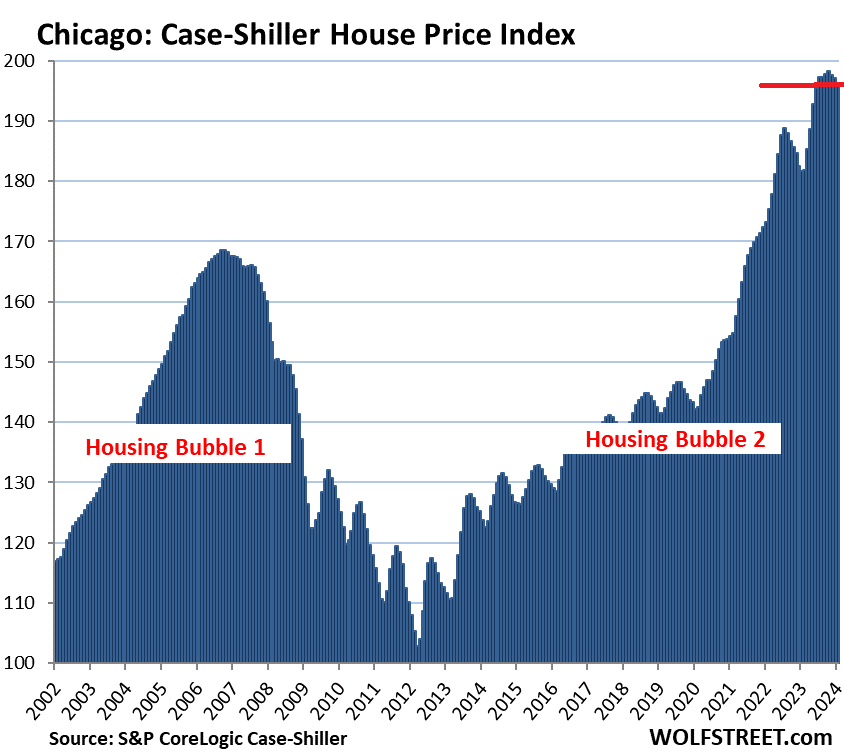
The remaining 6 of the 20 metros in the Case-Shiller index (Chicago, Charlotte, Minneapolis, Atlanta, Detroit, and Cleveland) had less home-price inflation than 180% since 2000, despite the price spikes in recent years.
Chicago, with an index value of 196 is up by 96% from 2000, and therefore is a far cry from qualifying for this list of the Most Splendid Housing Bubbles, but prices shot up majestically between May 2020 and October 2023, and so here is Chicago anyway:
- Month to month: -0.5%
- Year over year: +8.0%.
- From high in October 2023: -1.1%.
Methodology. The Case-Shiller Index uses the “sales pairs” method, comparing sales in the current month to when the same houses were sold previously. The price changes are weighted based on how long ago the prior sale occurred, and adjustments are made for home improvements and other factors. This “sales pairs” method makes the Case-Shiller index a more reliable indicator than median price indices (37-page methodology).
Enjoy reading WOLF STREET and want to support it? You can donate. I appreciate it immensely. Click on the mug to find out how:

![]()
Howdy Folks. Housing Bubble 1 Start to Finish approx 10 Years?
ZIRPed Housing Bubble 2 Start to Finish approx _______ Decades?
Will Disco make a come back by then? It could…. HEE HEE
Please no, we brought that back in the 90s, now we are revisiting the 80s, I want to die without ever seeing another pair of bell bottom jeans again.
Howdy Seba. The Lone Wolfs charts seem to show Bubble 2 still peaking??? How long it peaks and duration of the fall, has me wondering. Just how many fads or fashions could return…..
Flares are still around; better getchyerself buried.
You are starting to remind me of the Carlton Sheets commercials of years ago. All cut from the same cloth, I guess.
I’m not surprised to find Miami topping the list for overheated metros and their housing.
When I was there (on my motorcycle in the Nineties) construction was in a downturn, but there was still plenty of action going on. From what I’ve seen in succeeding decades, condo development in particular has picked up. All the good spots by the beaches are taken, but if you’re willing to go a little further afield, you can get a condo for, ….oh… three quarters of a mil.
Overpriced for your basic W-2 earner or service provider, but cash buyers keep pouring in from the Northeast, Cali and Latin America. Properly priced homes in good condition are selling quickly and at close to listed prices.
Folks who can no longer afford Miami are moving further north (GA, NC, SC) and they’re being replaced immediately by higher earning, wealthier buyers.
If you were really such high a rollin’ dude, you’d never forfeit the west coast for anywhere in Florida — let alone Miami (gross) — I don’t care how much someone hates Californians. Anyone trading a Mediterranean climate for a swamp climate is taking the escalator down.
Florida always has been and always will be ground zero for any kind of scheme-y real estate gimmicks of the day.
You mean money laundering crooks?
John Q. Public is screwed for decades.
1) Their 401K is heavily indexed and primarily in 10 stocks;
2) Anyone who has purchased a new home in the last five years will only see their value decrease.
Is this “really” the best America can do?
It’s no wonder that older Americans who own assets are quite happy while younger Americans who don’t or are having to pay outrageous amounts to own assets are not so happy.
My assumption of happiness is based on consumer confidence, sentiment polls, personal experience, etc
WRONG assumption AD:
”Personal HAPPINESS” has almost nothing to do with external challenges or any other externality!
Has only to do with your forgiveness of your self for all the dumb and dumber ”stuff” you have done to yourself.
Sounds easy, and it is easy, and much more permanent compared with other paths to happy, such as alcohol and other drugs…
Only ”hitch in the giddyup” is that ya gotta do your best to forgive all those who ””’ DONE YA WRONG””
FIRST.
((Apology to Wolf for going off subject of article! ))
This creature, America, which I lovingly call the “fat lady”. Since it’s inception has been programmed to grow and consume. Unlike other countries the “fat lady” has no history to call on for reference so it simply keeps on devouring, sea to sea. Then she gobbles and takes what’s available from other nations and eats. Now it seems the “fat lady” has nothing left to eat so she turns on herself, because that’s all she knows. Crazy
Totally agree with you, Home Toad.
Zerohedge published an article today 3/26 saying that State Farm Insurance would not provide insurance for 72,000 homes in California. Ditto for some of the CREs. The blame was put on some ruckus w/ bureaucrats in Sacramento.
If we interpreted this correctly, it seems to align with the huge CRE/Banking turmoil going on in the US.
The State Farm deal came out in the local and national media 5 days ago. Sometimes ZH is really slow in reposting this stuff.
There are about 39 million people in California, so 72,000 homes is a tiny portion.
But there are big issues, including the risks of wildfires that have burned down whole neighborhoods. And the State is trying to limit outrageous premium increases. So this creates a tug-of-war.
Mo’ over-valuation, mo’ problems…
Unless homeowner’s insurance companies can dramatically jack premium rates (harder in regulated CA, market regulated in hurricane Florida…) then they tend to just lower/drop coverage or exit markets.
Just as housing has its ancillary industries (upkeep, repair, taxation,…insurance…) housing’s ancillary costs zoom as the theoretical valuation of the house zooms. So you’ve got debt leverage and ancillary cost effects when you embrace the “American Dream” of mortgaged home “ownership”.
“Their 401K is heavily indexed and primarily in 10 stocks;”
Fortunately, many companies offer a self-directed 401(k) so your retirement savings don’t have to be tethered to spy.
True, but America has a tendency to run good ideas (indexed diversification via SPY) into the ground (can turn off brain now b/c half-learned how SPY diversification actually works in practice).
Late baby boomers are pouring tons and tons and tons of 401k auto-pilot money into SPY without really knowing what is going on inside SPY.
They may have options…but their finance 101 class in 1990 didn’t get into the guts of indexing in actual practice. They are prisoners of their partial education and mutually reinforcing delusions (index up…must be working…)
(Ditto Russell 3000 where some mind boggling percent of component companies rarely make *any* profits).
Cas127 – So what is the problem with index funds like SPY? What exactly have you gleaned by learning about how indexing actually works?
We always think of housing in such contradictory ways in America. 1- Housing should be affordable, which means there should be enough and at a reasonable price, but somehow at the same time, 2-constantly increase in value as investments that generate good yields. They’re at odds at one another. So maybe people should stop worrying so much about the value of their investment property because there are a lot of people out there who can’t afford basic necessities and housing.
Exactly, when did house flippers and landlords become glamorized.
When my mother and everybody else started watching them on TV. You can’t swing a dead cat without hitting a house flipping show on basic cable.
“Exactly, when did house flippers and landlords become glamorized.”
Yeah, landlords used to twirl their moustaches and tie little Nell to the railroad tracks.
Yes, I’ve been getting screwed over compounding annual returns over 10% for the last 25 years. I hope to continue getting screwed over.
Do these double peaks correlate with any other factors? I apologize in advance if I didn’t RTGDFA.
I imagine we can come up with a pretty good list. I’ve had a couple in mind for a while, as I’ve been struggling with this phenomenon for a while, and I’ve discussed it before in the comments. The phenomenon is really weird. A lot of things have been really weird over the past few years. It’s a lot easier to point out something weird (which is what I did here) than explaining with reasonable certainty WHY it is happening.
Howdy Lone Wolf. I find your truthful charts educating and scary. The future timeline on Housing Bubble 2 is especially troubling to me.
DFB, Please let us all know what you see in your magic future housing timeline. My charts and data all stop at today and don’t predict the future at all.
It’s funny how 100 people can look at the same information and either give 100 different opinions on the future or repeat the same stuff someone else says.
Sledge-
Re: correlation
My vote goes to mortgage rates (or, more broadly, the 10 yr treasury rate).
Big questions about lag effects though…
Yea, they do. The double peak is all speculation because the Fed messed with people’s heads and current buyers think they need to buy before the Fed cuts rates and assets explode in price again.
Rate cut mania did nothing but bring out the RE speculators.
Maybe this was covered in a previous article or discussion but… what’s the definition of “home” for this data? Is it all housing or just single family homes? I would be interested to see if more of the decreases are from condos/townhomes/apartments and if single family homes are holding up better.
All this data here is for single-family houses with exception of the separate condo index for San Francisco, which covers only condos.
Thanks. I admittedly didn’t look at the SF data, just some other cities, and didn’t notice you broke it down for SF specifically.
How do you get SF condo price trends Wolf? Case Shiller doesn’t break that out, does it? And it seems like NY would be another market where the majority of transactions are condos in some shape or form.
1. Download them from S&P. You’ve got to have an account, though.
2. The New York metro in the CS is huge and touches four states — not just New York City. There are about 20 million people in it. It includes: Fairfield CT, New Haven CT, Bergen NJ, Essex NJ, Hudson NJ, Hunterdon NJ, Mercer NJ, Middlesex NJ, Monmouth NJ, Morris NJ, Ocean NJ, Passaic NJ, Somerset NJ, Sussex NJ, Union NJ, Warren NJ, Bronx NY, Dutchess NY, Kings NY, Nassau NY, New York NY, Orange NY, Putnam NY, Queens NY, Richmond NY, Rockland NY, Suffolk NY, Westchester NY, Pike PA
The CS has a condo index for the New York Metro, but as you can see, it extends far beyond New York City. That’s the problem with a huge metro like this, it’s so diverse, and the housing market isn’t monolithic.
Feels like the FED QE Vs QT. The balance sheet ent up at rocket speed but coming down at a snail speed. Oh, I understand, if the down speed is higher, it would have unintended consequences and force the QT to be stopped and hence the house price drop to stop :)
Some random guy on YouTube toured some homes in Miami-Dade county. Bought for $500,000 in 2017, and now wants $2 million for the same property.
Suggest you not waste time on “Random guys” on YouTube for much of anything other than a good laugh, lol.
Key word is “wants”. Will he get that price? Not likely unless he bought for less than 50% of market value. He might double his money though, depending on where he bought, but most big gainers are the multimillion-dollar luxury and waterfront properties New Yorkers are paying up for. You couldn’t even buy a tear-down in a prime area for $500k in 2017.
“it shows a bizarre non-seasonal double top that has never occurred in the history of the index”
Go figure. Three great reasons for this unique occurrence:
1) The Fed has never mucked with 30YFRM mortgages like they did from 3/2020 to 3/2022. $2T+ in MBS purchases & near ZIRP interest rates for WAY TOO LONG.
2) The Fed has never pumped $5T into the economy. And the short period over which this was done is even more mind-blowing.
3) And then Congress follows this crazy intervention by the Fed with another $6T and then goes full on deficit mode to the tune of $3.8T over FY ’23-24.
And to top all of that INSANITY off, Congress passed rent & mortgage relief that has now been solidified into the MMT-based means of managing our economy. And finally, the Fed has telegraphed over the last 4 years that we’re going to backstop nearly EVERYTHING, so the normal market forces that destroy wealth, while still present, are markedly scaled back.
REAL recessions are a thing of the past. The 6-8 week COVID recession was government induced. It’s clear sailing until the bond vigilantes really revolt and push Treasuries WAY higher due to demand that tails off considerably from anything we’ve. When that will be is anyone’s guess.
100% agree, the economy has been hacked by the Fed and government.
Exactly GuessWhat. Item #2 in particular. And the recovery timeline for such an enormous economic heroin dosage is anyone’s guess.
What I see from Wolf’s content is that housing prices in these metros have gone from completely ridiculous to slightly less ridiculous.
But less ridiculous is still ridiculous. I wish more people who are currently in the RE market would realize that.
Right. All they care about is lower sales volume & interest rates.
The first 15%of the 19% that new home are down ONLY lopped off the froth. If new homes prices drop another 20%, then we’ll have had a meaningful downturn. The key, however, is for the Fed to not drop the FFR below 2.5% if we find ourselves in a recession. ZIRP is just as crazy as the stratospheric home prices that remain today.
I agree. A moral hazard created by the Washington elite.
No one thinks asset prices can ever go down. And why would they? Covid and the last four years showed that the Fed and Congress will just print more money.
Look how quick the gov’t stepped in during the banking crisis in early 2023.
“No one thinks asset prices can ever go down. … Look how quick the gov’t stepped in during the banking crisis in early 2023.”
LOL, this BS keeps getting spread? Investors got WIPED OUT in the banking crisis. Investors’ asset prices collapsed to zero, or near zero. Uninsured depositors got bailed out, not investors.
I expected an economic crash. However, the latest, amazing advances in AI and robotics may change everything: e.g. all Chinese-origin products might be made more cheaply in AI controlled, robotic factories in the US, 24/7, within seven years!
Remember, for embodied robots learned skills can be preserved and abilities and performance double every few months. Power generation and getting needed materials are the limitations ultimately.
Random thoughts:
Agree that liquidity/cost of credit are the primary drivers. Concomitantly, as others point out, irrational MMT driven policies and gov’t deficit spending have thrown all fiscal discipline out the window.
Other factors include changes in inventory, changes in local population size, crime rates (real or publicity driven), property tax rates, etc.; these all influence investor/family head buyers and sellers.
Comparing across metro areas may be a leap (not Wolf’s focus in this article). Hard to normalize all of this into a single metric that has explanatory punch.
The slope of the curves leading into the second bubble peak all look to have had a second derivative change starting in 2020-2021. Covid. To include the huge stimmy. Tail-end impacts?
I have a problem with city to city comparisons (confessing I haven’t done deep research on the data collection process): it has traditionally been difficult to break out institutional investors (who pay larger cash buyouts disproportionately influencing price moves; Redfin has some data). How much recent data is influenced by institutional/speculative buyers? Why do these buyers seemingly believe homes/condos remain assets with positive (real not nominative) future asset value growth?
It would be interesting to investigate the causes underlying metro areas that did not have “Bubble 1s”.
In my mind, the double bump reflects continued speculative investor action. There are articles suggesting that other population bump generations (other than boomers; e.g., Gen Y) are buying at higher prices as a last ditch effort to own.
Washington DC is easy to assess: gov’t employment in the DMV region has always been a key driver.
Overall….the chatter strikes me as somewhat arcane. The curves all show one thing clearly: the price of a home/condo has exploded since the bottom of bubble 1 (duh!); changes at the top of bubble 2 are minimal compared to the overall increases since the last bottom.
Holy smokers…whenever the dollar decline begins in earnest….all bets off.
“One metro set a new high in January: Washington DC.”
Yep, even crap is selling here over last year’s price. The bubble is showing no signs of abating. In fact, it’s getting even more extreme as inflation is starting to take off again and the FOMO buyers are out there in a panic. There are no listings and those that come up are snapped up.
If FOMO is still happening, and buyers are pushing each other out of the way, that tells me that these buyers have little faith that the Fed is controlling inflation as much as the Fed would like you to believe.
As a prospecting buyer, this is exactly what I’m worried about. The rational part of my brain feels that this isn’t sustainable, but I’m worried that the fed is going to cut rates too soon and inflation is going to take right back off again. This is why I’m contemplating buying now rather than waiting, but so far no rate cuts yet so at least the fed is still credible IMO.
If you can afford and this is your primary home you should buy and call it a day.
Fed would cut rates for sure and they already transmission this .
The question is when and how many times.
Inflation has already come down a lot .
Based on this, I am expecting we will never hear the end of ..”Not in my area in SoCal and this time IS different…” Urgh…
Los Angeles metro
Month to month: +0.1%.
Year over year: +8.6%.
From the peak in May 2022: -0.3%.
I just put an offer on a home in by the Beach, starting around 1.4, I went 2% over list for initial offer. found out I was last out of 5 offers, 1 offer near 1.5. house comparable were in the 1.35-1.46 range in may – June of last year, and this home was the least upgraded of all of them. this is becoming BS
Why did you even bid???? You’re contributing to this “becoming BS,” as you call it. It’s people like you who are driving prices higher. It’s not the sellers, it’s Millennial and GenZ buyers that are trampling all over each other to outbid each other.
I have run out of patience with people who complain that prices are too stupid high, and then they keep bidding them even higher.
If you think that prices are stupid high, don’t bid, find yourself a nice rental, save $2,000 a month, and live your life.
And if you keep bidding on houses because you want to own something, though prices are stupid high, then don’t complain that are prices are stupid high because you’re in part responsible for them being stupid high. Buy something at this stupid high price and enjoy your life.
Soooo sooo Amen to this…unfortunately there’s no stopping this FOMO train, the whole complaining about walking off the cliff but still walk straight off the ledge mentality drives me nuts…
I guess it’s simply too hard for people to exercise buyer’s strike, this is evident even more so in SoCal sadly, collective insanity to say the least. Or perhaps the shame of being a renter outweighs the thought of earning a nice return on T-bills so buying at all cost is a must…urgh..
People have lost faith in the fed to contain inflation and being asset prices back to sensible levels hence FOMO.
Don’t blame these folks but I hope and wish fed being the asset prices down
It was criminal for fed to buy mbs and lock young and future generations out of shelter for ever.
Spoke with a neighbor and during the conversation he said, “he couldn’t afford to buy the house he’s living in if he were to buy it at the price he could get today”. That says it all.
The craziness will continue until the whole thing explodes. Rates either need to get so high that people just can’t afford it no matter what they do or a deep recession hits that kills all demand for real estate.
I just refuse to participate. I pay $5000 per month for rent and tell myself I’m saving the other $5000 I’d have to pay if I owned the home.
@Inflation – Demand has been killed. Mortgage originations and sales are around HB1 lows right after house price crashed and there is another 30 million people in the US since then.
I am not sure how much more demand can be squashed?
Everything is out of kilter. Usually when housing demand is this low, you are close to a housing bottom.
Also, the FED usually does not cut rates at record low unemployment but that is what everyone is expecting. Governments usually are not increasing spending during a good economy. The FED usually does not cut rates when stock market are at ATHs.
Would this have become BS if you have won the bidding war ?
Personally I think this is the worst time to buy a home but I have been wrong many times .
I am not in the market for any home not at these crazy price.
I am perfectly ok to not buy any home at all.
Yes why did you even bid ..
socalSurfer310 – It is not BS, the largest generation currently in the US are millennials at 28 to 44 years old and they are itching to buy a home. Right behind them are the second largest generation Z at 12 to 27 years old. You really think these generations, whom the oldest of the millennials was 26 when the first bubble burst, have the patience and experience to wait it out for the next downturn? They are going to buy as soon as they are able, just like the generations before them did. There will be another leg up in housing as interest rates drop, and if you think bidding 100k over is crazy you haven’t seen anything yet. Once the millennials and the oldest of generation z have driven up the price of housing to insane levels like we saw the boomers and generation x do in the 2000’s, we will finally see the long awaited bursting of the bubble. So you either buy now before the next leg up or wait until its over, however long that will take is anyone’s guess.
In 2023, the National Association of Realtors said that baby boomers made up 39% of home buyers. Millenials were 28%.
1. Now add Gen Z buyers
2. When boomers buy, they most often also sell their current home, so they’re buyers AND sellers (+1 -1 = 0) with zero impact on the overall market. They’re just churn that Realtors make money off both times. It’s the first-time buyers that drive the market, because they buy WITHOUT also selling.
It’s always amusing to me to hear people complain about the high prices of homes “near the beach”. They’re trying to find a bargain on a lifestyle (not a home) they – apparently – can’t afford.
I would note the price decreases are even more stunning when adjusted for inflation (CPI, PCE, whatever, your choice). The dollar is losing value, so prices should be going UP. This also shows just like Nvidia stock, some housing markets have no idea on value. Using FRED series CSUSHPINSA, USSTHPI, TXSTHPI normalized to year 2000 and adjusted for inflation is also interesting.
The CS is basically an inflation index for homes. You don’t further inflation adjust it.
That’s only true if you assume Inflation is the only factor that causes house prices to change over time.
But if inflation is just one of multiple components, joined by (say) an independent asset appreciation factor that would cause the perceived value to rise regardless of the dollar’s value (such as the area growing economically and being seen as a more desirable place to live), then there does need to be some methodology applied to separate the effect of price inflation on the asset’s price change over time from the other components that contribute to its value.
If it takes more dollars to buy the same house, did the house go up in value or did the dollar go down in value?
The ARTICLE, which I read,
Basically stated overall CPI inflation and CS index inflation since 2000
83% Vs 329%
Meaning homes appreciated 4X more than inflation.
Inflation: Hedged.
Ensuing death, profit taking, etc etc over the next decade will begin to show a “true value” of the real asset, until it finds itself undervalued (2011), and begins to bubble?!? OR who knows what else (with the swan pond we have created?).
CS index value for Miami, up 329%…
So, you can do the math per metro.
Struggler – where do you find the CS index?
Congratulations Wolf’s gang – we’ve made the big time.
This article was among those aggregated on the main business page of google news. I’m not sure how unusual this is, I don’t spend much time on google news, but it is absolutely the big leagues of commenterati.
Well done – now go buy another house
That’s your personal algo based on what you read. It’s always on the top of mine along with other things I read. No one is interested in what I read lol
Read enough articles about the Fed on Google News and eventually WS will show up in your feed. That’s how I got here last year. Ironically I now skip many of the Fed related articles on my Google feed because I already got the straight skinny here and I can see through the spin.
Although the pandemic dramatically changed behavior and economic models, I still think the nature of cyclical waves will show this past five year period to be a bubble — even if, this time is different.
As such, looking at Case Schiller adjusted narrative, I can’t help but be curious as to why cycles influence speculation up to a nebulous point— and then the rug is pulled.
It’s stupid thoughts like that, that end up in me looking at old pointless correlations, probably because, I’m a skeptic that enjoys looking under rocks.
As such, I found two unusual obscure gems from a 2008 IMF paper about the housing cycle:
“ Source: IMF staff calculations.
1 The interest rate elasticity of real residential investment, for example, is the maximum response (in absolute value) of real residential investment to a one-standard-deviation increase in the interest rate divided by the size of the interest rate increase at the time of the shock.”
“ Deviation of real residential investment from trend is calculated as the difference between actual investment (in percent of GDP for the most recent quarter available) and investment predicted by a linear trend beginning in 1970:Q2”
Unfortunately, I’m not an economic professor, but a visit to Fred shows real residential investment to be somewhat asthmatic and anemic — and brings up mystical distortions as to how real GDP will play out, after the fiscal sugar high runs out of steam.
My obtuse conclusion is, that goosing GDP is going to add fuel to inflation growth and continue to fuel home price decline — but that rate of decline will be slow and steady, as rates stay higher for longer — and then, we get a real rug pull.
I think even Shiller predicted real home prices are going to head lower (last year?).
This is an additional old comment from a blog called bonbdad from 2018:
“ Real private residential fixed investment was flat (blue). Measured by the more precise method of its share of the GDP as a whole (red), residential investment actually declined:
According to Prof. Edward Leamer, this typically peaks about 7 quarters before the onset of a recession. As it has not made a new high since four quarters ago, and must be considered a signficant leading indicator of recession at this point.”
I haven’t dug into Leamer, but it’s interesting that his indicator is trending downward. Probably priced in ….
Interestingly, there’s a nice analysis of Leamer and his residential investment theory in this pdf doc from Kansas Fed and I’d paste a relevant section, but the doc is locked up tight.
However, it speaks about interest rate sensitivity related to residential investment and GDP, reiterating how this is a fairly good barometer, used alongside term spreads.
I realize this strays a bit from the exact topic, but it’s actually a nice derivative and dovetails enough to be generally related.
There is always some scientific numbers guy who can invent a complicated formula for everything – usually AFTER the fact because he creates it using back testing that proves the formula.
Markets are really quite simple and are almost 100% based on investor psychology and emotions. Markets often rise on bad news and fall on good news depending on the positive euphoria or negative despair of the masses who are “investing”. We’re past the euphoria phase of real estate, and sentiment is beginning to change, as Wolf’s charts show.
Amazing how the mainstream finance media all parrot the yoy increase as if its the start of the next great re bull market.
The mainstream media thinks any asset price appreciation is good, no matter how much damage it does.
That’s why they call house inflation price “growth.”
They’re evil sycophants.
The mainstream media prints what generates clicks. Market up or down, they sensationalize it to get as many eyeballs on it as possible.
Wolf,
We need you to peer deep into the crystal ball…
And tell us what the future holds…
Will the US have a future that looks a lot like the following:
1) commercial banks having a primary role as warehousers and wholesalers of government debt, with greatly reduced lending to small businesses
2) large businesses primarily obtaining funding by accessing FOMO driven capital markets (not banks), and using most of the money to do leveraged buyouts and/or stock buybacks
3) consolidation of wealth and power into a smaller and smaller subset of the population
4) higher taxes (on people who can’t hire lobbyists to change the tax code to benefit them)
5) higher inflation
6) lower social benefit payments (on a per capita basis–not counting periodic vote buying schemes)
7) higher interest rates
8) lower social cohesion
In other words, looking more and more like many Latin American countries…
What do people think of this, and what is the gameplan to deal with this from a protect your money standpoint?
Or 9
That love will once again defeat most of the first 8.
For instance, too solve the budget deficit, increase the marginal tax rate on the fortunate Americans that have prospered as a result of our society far beyond their wildest dreams.
Problem is that no tax that would actually accomplish this could make it past the current dysfunction in Washington DC…
Increase the marginal tax rate? Have you been listening to what they are proposing? More tax cuts! Yes, indeed, no more fiscal responsibility! Hell, let’s go all the way. No more taxes on anyone. Print it all!
!Que viva la inflacion! No necesitamos impuestos cuando podemos printar.
The US doesn’t have an income problem, but a spending one.
Cut the budget!
I would really like to get Wolf’s take on this as well…
Here’s a prediction for you:
Fed eventually starts cutting later in the year.
Bond vigilantes finally make a return, long yields spike.
Fed is forced into a second tightening cycle in 2025 to regain market confidence.
I eagerly await the day that foreigners and Americans demand 10% interest to buy long dated bonds.
It’s the only thing that will cure our addiction to financial chicanery, instead of real production.
Then you eagerly await a very bad time. You won’t like what happens to *cause* markets to demand 10%. Right now you think you will, but when that happens, and whatever securities you own are down 80%, your dollars saved for downpayment down 50%, and no job….
Unfortunately, you are 100% right about that being the only thing to cure the addiction. These federal budget deals that cut future growth in spending are a joke. How many times in the past have we heard that the budget would be balanced within 5 or 10 years? Answer: lots. And how has that gone? Yeah.
Bond vigilantes finally make a return, long yields spike…
This won’t happen..
Good graphics that clearly indicate that an irrational, I prefer balloon rather than bubble, is miraculously inflated while the Fed relentlessly hacks away at their, still obese balance sheet.
The median citizen still can’t qualify for an FHA guaranteed loan, assuming that credit is hard to get.
It’s not just America.
The world is still juiced up on the implementation of hypothetical monetarist theory, MMT.
That’s without taking into account the rise of the Chinese currency during the QE period.
What the government is doing is worse than MMT. At least MMT calls for tax increases in the face of inflation, which closes the loop, theoretically.
We believe everything is great as long as CPI is targeted at 2% or higher. Nevermind inflation overages of 13% in three years. Nevermind stock and RE prices that inflated 50% to 300% the past decade. The masses are calmed with empathy, perception of choice, and dreams of speculative successes, for now.
MW: Federal Reserve posts record $114.3 BILLION loss in 2023 after soaring interest rates upended the body’s finances
The Federal Reserve posted a record $114.3 billion in 2023 thanks to expenses related to managing the bank’s short-term interest rate target.
I reported this in detail on Jan 12, 2024. Why is this suddenly news again???
https://wolfstreet.com/2024/01/12/fed-reports-operating-loss-of-114-billion-for-2023-as-interest-expense-blows-out/
Because MarketWatch is just now publishing it!
Actually, that was kind of a trick question. The thing that was new, though it didn’t show up in the headline, was “audited annual report.” This was about the Fed’s audited annual report, which was just released and posted on the Fed’s website. What I covered were the “unaudited” preliminary annual results. So the headline should have said, “Fed’s audited annual report confirms $114 billion loss,” or something like that. But that doesn’t make for a headline that people click on.
///
If we normalize the charts based on the slope we get a pretty good match…Too good for my taste. If markets are to be observed as independent markets, which for all purposes they are, they should have significant local discrepancies…
But they dont, at least not as much as I would expect.
The exact same pattern, acceleration, full speed ahead, sudden stop.
///
But what really caught my eye -> the stop and stable. Only controlled processes have this capability (like a PID controlled process). If the process were “more natural” it would have looked different, with less damping, more overshoot and stronger oscillations with a tendency to decrease/increase.
I have seen my fair share of charts and this is by design!
///
ALL markets in the US have some things in common: interest rate repression and QE from 2008 through 2022 (see the price surge). And now QT and higher rates (see the stops and declines). That’s been the common denominator for all housing markets since 2008, and it’s huge. We’ve been screaming about this connection — QE and interest rate repression to asset price inflation — ever since the site was born.
///
Wolf, the graph shows a bi-phasic nature. A steady increase till 2020, looks more or less linear and a sudden 2020-2022 price surge. While I can understand your comment for the data until 2020, the rest sprint-stop-stable I cannot write down under QT and increased interest rates (not even the pandemic can wash this one). It looks like everyone is cheating from the same cheat sheet and getting the same result.
Thanks for the feedback. :)
///
I once was once invincible, having traversed a life that connects the post WW2 influence with now, I feel less certain that my recommendations of how too live a good life is for everyman.
No one expects to suddenly become disabled. The medical insurance program, medicare, is worth saving and expanded.
While the market for existing homes isn’t moving much I wonder what the impact of private equity firms is of putting upward pressure on prices. Seemed like a decent percentage of homes.
LOL, this BS never dies on the internet, does it? Do you think the PE firms are idiots buying houses from stubborn homeowners at these stupid prices? The only thing they’re buying is huge portfolios of rental developments that other PE firms and landlords and homebuilders are selling because THEY see the peak, and those deals aren’t getting made at those stupid prices.
We’ve been through this many times, including here:
https://wolfstreet.com/2021/06/22/no-blackstone-didnt-buy-17000-houses-out-from-under-desperate-homebuyers-and-blackrock-didnt-buy-a-whole-neighborhood-but-built-to-rent-is-a-h/
Same basic data on who owns the US housing stock — note the MINUSCULE number of rental houses owned by large firms:
There are 146 million housing units in the US:
Of the 132 million occupied housing units:
Of the 45 million rented housing units:
Of the 14 million single-family rentals:
(Data via John Burns Research & Consulting, based on its own data and data from the Census Bureau)
Wolf,
In this data, which category does a duplex fall under? Specifically, a duplex with the landlord/owner living on one side, and renting out the other side.
Or is this arrangement not common enough to have its own category?
There is a small category of multifamily that comprises 2-4 units, which includes duplexes. In terms of new construction, 2-4-unit buildings account for 0.9% of total multifamily.
It is not uncommon for the owners of a smaller apartment building to live in the building, and this is very common in San Francisco with older buildings that were designed that way: owner lives on the top floor, each apartment covers a whole floor, and the other units are rented out.
That’s a good question and answer.
Thank you. These are interesting numbers
Are ADU’s built in SFH backyards and granny flats counted the same way? As 2-4 units? Are they even counted?
Are the number of ADU’s growing? There has been deregulation to allow these to grow to alleviate rents.
But dont be surprised if big PE firms have plenty of cash and are waiting to pounce on homes. I think recently JP morgan and some other company partnered with 500mn to buy rental apartments. Can there be more like these?
Rental apartments are “multifamily CRE,” which is in serious trouble. There were some huge defaults of apartment landlords, the biggest one in San Francisco defaulted last year and lost the apartment buildings, someone bought the defaulted loans and got the apartments. The whole sector is in turmoil.
In CRE overall, prices are down 30% to 70% and in some cases 100%. We’ve covered a bunch of this this right here:
https://wolfstreet.com/category/all/commercial-property/
Including 10 days ago:
https://wolfstreet.com/2024/03/18/whos-on-the-hook-for-multifamily-cre-mortgages-1-taxpayers-far-ahead-of-2-banks/
I wasn’t assuming they were buying house by house but moreso by building to rent they reduce the number for sale and puts pressures since fewer homes to buy. Doesn’t seem like that is common enough yet but if it is the future then seems problematic for first time homebuyers. Only a few of those arrangements near me now as most are still just homes for sale. As a current homeowner seems like an advantage as my house is still up significantly from when I bought 8 years ago although just happy if it doesnt go below what I paid. Basically 12 years of rent or less is equal to owning a house and in the end I have something to show for it.
Build to rent housing developments are just apartment buildings tipped on their side. Or garden apartments with one unit per building. Nothing to see here, folks!
This is ignorant BS.
They built one of those “build to rent” developments near me. Acquaintances of ours moved there after selling their SFR. The place reminds me of an upscale trailer park…. stick built homes merely inches apart… no rear yard (a narrow concrete patio) enclosed in a concrete block cubicle… front exposure built to the sidewalk and random parking sprinkled on the narrow streets.
Best word to describe it is claustrophobic.
El Katz, not to defend these corporate profiteers, but maybe that’s all the renters want? Maybe they don’t want a huge yard to maintain, and don’t care about being far from neighbors.
Perhaps one could elaborate on what makes this “ignorant BS”. How is starting from a greenfield and then building a bunch of houses for rent conceptually different from starting from a greenfield and building a garden apartment complex or a multifamily rental high rise?
kramartini,
Build to rent refers to building entire developments of nice single-family houses — NOT apartments – to be rented to people with $150k household incomes that could buy if they wanted to. That’s why your line is ignorant BS. You thoughtlessly dissed something you were clueless about.
Build to rent is targeting “renters of choice” who could buy but don’t want to buy because it’s cheaper and less hassle to rent than to own at today’s prices, and less risky, and provides more flexibility when you have to move.
Even multifamily (apartments) are now nearly all being built for the higher end, for “renters of choice,” with higher incomes that could buy a home but don’t want to. No one is building anything for the lower income spectrum that is forced to rent, unless it’s under a government program.
People with lower incomes have to rent something old or something government-subsidized.
Wolf-
Are you having a bad day? You just flamed me for agreeing with you.
A build to rent community like you describe is precisely analogous to a luxury high-end garden apartment community–like the Gables or Riata in Austin–but with all units being in the form a SFH. (If the units were rows of townhomes rather than detached homes, the analogy would be to a luxury high rise tipped on its side.) Not sure how things are in California, but in Texas, it is quite common to have communities of luxury apartment rentals–many with attached garages–that cater to renters of choice
My comment of “Nothing to see here, folks!” simply acknowledges that these communities are conceptually no different than more traditional high-end rental communities, and that they compete with luxury garden or high rise apartment rentals. They are just taking the idea of luxury rentals to the next level by creating the experience of living in a luxury gated SFH community–but for rent.
Glen,
I am in the same housing boat as you.
The Fed, “primed the pump”, so to speak, drove interest rates to ALL-TIME lows. Someone who purchased more than 5 years ago has a cheaper price point and a VERY low interest rate due to refi’s. Unless they die, divorce, or there is a disaster, they are not motivated to sell and pay A LOT more for a similar(or lesser) housing opportunity.
I think the Fed are geniuses for avoiding a housing crash by their manipulation, unlike 2007. Now, supply has plummeted and demand has lessened with higher interest rates, but no crash is imminent. This is so different than 2008-2012 where the Fed could not keep up with plummeting home prices by lowering rates at a snail’s pace.
The key is for houses not to go below what was paid X (X is the tipping point) number of years ago. There won’t be a panic and housing crash if people are content with their low monthly payments. A few speculators will panic and sell at a loss, but a current homeowner has a ways to go before that happens. I think this is SO different than 2008-2012 when there were so many no money down purchases on speculation and SO many houses underwater that even though rates were slowly dropping, their LTV was underwater so they could not refi.
The other thing I see is that almost Nobody has enough money to purchase a house based on a working wage. The ALL-TIME peaks of the stock market, Bitcoin, AI, is still driving up housing purchases. So much cash available thanks to the Fed with forgiven PPP loans, etc.
A perfectly balanced limited supply along with a limited demand based on stock market, etc value is holding. If the stock market, etc crashes, it will ruin that balance and cause a housing market drop.
Maybe this is conjecture, but a S. CA techie who is buying a house is much more likely to have invested in AI or BTC so house prices will not drop as far. Some tech companies are calling their employees home (Including mine) from Austin and elsewhere so RE prices in that satellite tech areas are dropping. They Bay Area is lower now but I expect post-Covid, it will grow again as employers ( like mine) call people home.
Wolf, I often try to promote you on twitter and elsewhere. When I post link I run into the problem that the links are long, because of the very descriptive and logical URL structure that you use. Long links use up space that I’d rather use to tell people why they should read the article.
Might it be easy to equip each article with a short form version such as wolfstreet.com/CRC32HASH
The crc32 command in linux will make any string/URL into 8 hex digits. Probably unique enough for wolfstreet. Better and more permanence than commercial link compactor sites.
You can use something like bit.ly to shorten URLs
Thanks.
1. I never ever click on shortened URLs because they are just gibberish and I don’t know what I’m clicking on. I want to see where this is coming from and what it is before I click. That is just basic internet security.
2. X (Twitter) doesn’t penalize you for long links. On X, it doesn’t matter how long the link is. I use X all the time, every article goes out on X. This is what this article looks like on X. You see the length of the URL doesn’t matter:
There’s a special place in hell for central bankers who do this to shelter.
Sorry, they don’t think that far ahead…they are enjoying heaven now in their view by getting richer and getting kudos from their wealthy friends, so why would they want to do the hard thing to reverse their own fortune to save the commoners? Plus plenty of asset owners are enjoying the wealth effect so in their view, why rock the boat?
Pow Pow can pretend he gives a flying F about young homebuyers need a break blah blah but yeah we are all getting a break with SoCal crapshack starting at $1M like it’s going out of style…
In 2008, we dreaded the housing crash, we tried to avoid it, but still it happened.
In 2024, everyone desperately roots FOR a crash, but aside from Austin, housing barely dips.
The more self-declared experts and “consultants” predict and root for a crash, the less I believe we’ll see one. Too many people on that side of the boat.
Well — up 60% between 2020 and 2022 and down a miserable 11 percent since.
And Austin was already bubbly pre-pandemic. I’d go for a walk at night and note how heavy the air was with the smells of portable potty cakes and saw dust from all the flipping going on on every street.
A house I paid $450K for in summer of 2013 (down from an original ask of $650k 8 months prior) and subsequently lost in a divorce sold 3 more times between 2015 and 2018, the last sale being 1.2. I liked my house, but there was nothing special going on there…in fact, it was kind of an unusual and unfashionable layout had a lot of serious issues not caught by the inspections I paid for before purchase.
EZ money = weird times:
There are obviously more people expecting the market to go up forever, like you. I see it everywhere including here. If everyone was expecting the market to crash then it would have crashed. Math is not a suggestion, however, and what is not sustainable will not continue and even a grade schooler can see it doesn’t add up. If prices remain stagnate during high inflation then it is still losing value in real terms and they’re still pouring gasoline on the inflation fire. Prices may not go down, but the money is rapidly losing value.
As we have seen, the numbers do not have to make sense in order for overpriced homes to continue selling.
I’m sure you’re familiar with the old saying about markets remaining irrational.
I don’t necessarily believe it’ll go up forever. I said the more people forecasting a crash, the less I believe we’ll get one. Hopefully we do, though!
Locally in Seattle, prices seem to be heating up again over the last couple of months, getting close to peak May 2022 prices as of today. No correction in sight in this local market.
Yes it seems like that.
Something doesn’t add up. Why would LA be so strong despite QT, stubbornly high interest rates and all that development of multi family homes? What would be helpful is to also compare CS index as it correlates to # of transactions. Limited inventory driving up prices higher as idiots keep on bidding up.
Great article and scary scary graphs. Interesting to see the pull push comments depending on personal situations. Some folks want more taxes to pay for received benefits. Others want less. Some like the high housing prices that make them appear wealthy, others want affordability. My main take is the point made on artificial interest rate repression for the last 20+ years. This manufactured volatility has crept into every facet of life. Add in rapid technological change and stir the pot with social media and expensive groceries/housing and feel the disillusionment build. Listened to Richard Haas the other day and he expected a period of ‘troubles’ to occur, much like northern Ireland for 20-30 years. And that was really all about wealth inequality. If people feel they have a fair chance and a route to better themselves it doesn’t happen. Take away affordable housing and all bets are off.
I think the fix is interest rate normalisation, and a build out of housing much like after WW2, all accomplished with Govt incentives. Now the crunch decision is clear. Will the wealthy open their wallets or will they refuse and then complain about dollar devaluation due to deficit spending?
Not graphed, but there is this data :
A history of the top marginal tax rates on the wealthiest Americans:
1940: 81%
1950: 84%
1960: 91%
1970: 72%
1980: 70%
1990: 28%
2000: 40%
2010: 35%
Top marginal tax rate today is now 37%, but hire a good accountant and watch that decline. Then many complain about the deficit, while they talk about the golden era they yearn to return to. A analogous question, who will help pay to rebuild the Baltimore bridge? That bridge that the entire country benefits from as a key piece of the export/import transportation hub? Then add in some other topics like road repair and maintenance, affordable health care, level education opportunities, housing? Affordable food for common citizens?
A country that does not address food and housing for the majority is skating on thin ice, imho.
The marginal tax rates are largely irrelevant in the hugely complex US tax code. That has always been the case. More revealing would be the effective tax rate — taxes actually paid by a household as a percent of that household’s total income. But even that is not revealing because people with a large amount of wealth in the companies they founded, for example, don’t ever have to sell the shares, they can just pledge them as collateral and borrow against them, or they can donate them to their own charity, and get the huge deduction, without ever having paid taxes on the capital gains, which then shelters their other income. These things are not new. Our tax code is designed to benefit those with complex and big financials.
“A country that does not address food and housing for the majority is skating on thin ice, imho.” Seems you’re talking about Canada, LOL
A good accountant can maybe trim the effective tax rate (but not nearly so much as in the 50’s, 60’s, and 70’s–before the 1986 tax reform which got rid of all the really good deductions in exchange for a reduction in marginal rates).
But the marginal tax rate is the marginal tax rate and will be charged on the next dollar of income no matter what.
In a broader sense, home affordability has fallen victim to the pitfalls of democracy and majority rule. Renters are about 35% of the population, so they have no voice, and no capital, generally. The majority of citizens are homeowners are homeowners who want continued price appreciation.
Who should pay to rebuild the bridge? The shipping company. They destroyed it and it’s a known risk a huge ship can lose control/power and destroy things in its path. If they don’t have the money, then the insurance they are required to operate it should. No one else should.
Also, the US tax codes are pretty stacked against people that have to work for their money (W2) even if you cite those marginal rates that very few hit. Those making enough to hit that 37% can likely change how they get paid and carryover and other things (W2 employed docs being a minority that can’t). The big issue is capital gains taxes. It’s not uncommon for retired married couples paying no income taxes on dividends because they have qualified dividends up to $90k…pretty ridiculous to have that take-home with no tax liability. It should all be taxed the same regardless if capital gains or at least tax passive more since it’s requires no effort.
I pulled off a great financial wind fall…….LOL
Instead of buying a house or gold to put away……I bought two bags of Hersey kisses last fall. Thank goodness…….I was thinking my retirement was secure.
The next door neighbor wanted to buy a bag for a cake……no way!
The only problem is that I’ve found that my fortune seems to be evaporating because my wife gets up in the middle of the night and comes to bed with a smell of cocoa.
I’ve attempted to hide the bags but the dam dogs find them every time.
Forget all this talk about housing……how do you hide a real fortune in kisses? Even the little varmint grandchildren want to destroy what I’ve built.
Howdy Fred. HEE HEE You are supposed to save $$$ instead of nuts or anything else. Squirrels Motto Rules……#1. Coins, Cash, save save…
Took me 6 decades and 3 homes to figure out to buy where and what I want to live and live in. Inflation helped a bit along the way although arguably, it impacts selling and buying prices at the same time.
So here I am, with zero debt, living in rural park like setting with distant but fantastic neighbors.
If my place’s value went to zero tomorrow, I couldn’t care less, it is still a fantastic home.
Good luck to the equity chasers, it can sometimes be a miserable existence.
Howdy Imposter. Stay out of Personal Debt, live within you means, and always save some of what you earn. Simple rules but very difficult to follow for most Americans. They were taught just the opposite and ZIRPed to stupidity in so many ways.
As much as the dire situation in San Francisco, the housing market in Silicone Valley, particularly South Bay, has dynamically bounced back closer to the 2022 height. Not sure why. Not sure if the trend will continue.
Inflation will never subside as long as this housing bubble and everything bubble speculative mania continue. Monetary and fiscal policies are not restrictive.
Get ready for another year+ of rich people becoming even more obscenely wealthy than they already are, and the working class and the poor descending into absolute financial misery.
Monetary policy is restrictive. If the FED continues on its current path, then prices will fall in the last half of the year.
Yup.
Speculation continues. The higher rates did nothing because all people are doing now is betting on the Fed cutting soon. It’s insanity.
Something like 62% of Americans live in their own homes (and presumably many of them refinanced in 2021-2022). So this take that only the rich are benefiting from the recent explosion in residential real estate prices, fueled in large part by the Fed’s inane 0 rate policy in 2021-2022, is just silly.
The problem for the middle class/upper middle class folks who do own their own homes (albeit with some debt) is that they can’t sell and “cash in” very easily as their replacement home would likely cost them a lot more (factoring in the much higher debt servicing they’d incur) unless they’d choose to rent…
I know this is not the rite catagory to post this…. But, it just seemed impossible to me that this fed is going full on QT at a time CRE is taking it so hard on the chin with all those empty buildings in all those cities. I don’t see to much of it in tampa, but sanfran is going full tilt with empties. Wouldn’t it be impossible for this fed to go QT when somebody must be paying off all those commercial backed mortgage security bonds, and collateralized backed bonds. I mean what is it, is the fed tightening , or is this fed making good on these bond payments that empty buildings cannot make, paying the monthly coupon, which would mean more QE in my eyes?
Investors have been losing their shirts in CRE, and lots of investments have gotten wiped out just fine. We’ve been documenting it for about two years — and retail CRE since 2017. A lot of this has hit CMBS and CLO holders, but also mortgage REITs, PE firms, life insurers, etc. The Fed has zero problems with investors in CRE taking big losses. Banks have taken some losses, but a lot of those have been foreign banks, so to heck with them. Some smaller banks will fail because of CRE, but so what, and none have failed yet due to CRE. So the Fed is tightening just fine, while investors are losing their shirts, that’s the answer to your question.
I appreciate the response, but many of these ‘investors’ are pension funds that represent teachers, auto workers and the like from the US. Also as these tranches of cdo’s and clo’s slowly fall in value the credit default swaps that insure these tranches start to blow out and spreads widen. Certainly the fed must respond in some fashion here to avoid the 2008 debacle. Kind of like dejavu all over again…
Wolf, i’ve often thought it would be very interesting to show home Prices over a long time horizon, standardizing them for average interest rates and household income.
The standardized interest rates would hope for a comparison between the 80s when the interest rates were up in the high teens, and more recently when they were down below 3%.
The household income is partly just a way to adjust for inflation, but also to show that there was a period of time when more households became dual income, which increased spending power.
Hard to imagine that substantially more households would gain a new provider in the future, so I think that catalyst is pretty much done.
But it would have made a large impact over the longer time horizon as families moved from primarily single income towards dual income.
There are obviously other factors, including second homes, investment properties, etc., but it feels like you could explain a lot of home price appreciation on a church/graph through interest rates and household incomes.
I am pretty sure this is been done somewhere before, but I don’t think I’ve ever seen it.
your logic is kind of funny. You’re saying in effect that because households now have two earners they SHOULD pay twice as much for the same home, that the fact that both have incomes justifies the doubling of home prices.
This is precisely why so many people are so pissed off — and you can see that here in the comments.
Not that they *should* pay twice as much, but that they *will* pay twice as much. The inflationary mindset only works if buyers have the dollars to back it up. A buyer can’t push a price beyond what they can afford or at least what they can qualify for. If the per-capita household income goes up as productivity goes up and more members generate incomes, then families have more dollars to throw at a house and/or more income with which to support a larger mortgage. Some folks are disciplined savers, but let’s face it, the average person treats money like it’s burning a hole in their pocket. If they have more, they’ll spend more, and they’ll gladly compete with people who have similarly growing incomes.
Could be profitable shorting this mess when it all implodes.
I see there are some inverse REIT ETF’s. While they may not be a direct correlation to housing per se, I suppose with contagion they are still likely to ride the wave lower.
REK (Proshares Short Real Estate)
SRS (Proshares UltraShort Real Estate)
DRV (Direxion Daily Real Estate Bear 3X)
Regarding SFR, wake me up when prices revert to 20219 levels.
Regarding CRE, my company was just hired to prepare and list a 28,000 sq ft industrial building for sale that foreclosed upon by a regional bank. CRE foreclosures in SoCal are slowly climbing.
Well if the value of the dollar falls isn’t that a different scenario that can explain what is happening.
How does the base effect you mentioned in last months splendid report work into this double digit yoy for San Diego. I predicted this and was pretty much shouted down. From various sources in San Diego, Feb mom is coming in at around 5%, from which I expect case Schiller to show around 3-4 with their sales pair method, which will end up being a 14-15 yoy for the April splendid report. San Diego will certainly exceed its 2022 all time high in your next splendid report. March appreciation in SD has slowed a tremendous amount but still has some growth. There will be double digit increase yoy numbers for a few more months at least at which point, I suspect, the base effect will slow it to single digit increases, but increases none the less.
I figured I’d wait til the new post came out and post here near the end so as to not prematurely ruffle the various commenters feathers.
RTGDFA
It explains that the double peaks are NOT seasonal. In San Diego, which has zero seasonality in the CS, the all-time high was in May 2022, and it still holds. The second peak was in September, and now there is this January bounce, which remains below the all-time high of May 2022 and below September 2023. These two highs are 16 months apart, not 12 months, nothing lines up seasonally because there are no seasons in the CS for San Diego. And there is a trough in between that is not seasonal because the CS for San Diego has zero seasonality. And the bottom of that nonseasonal trough is January 2023. And so now January lines up with the trough that is not seasonal. So you will see the year-over-year increase get eaten up in the coming months. That’s why year-over-year is meaningless, unless the data is very seasonal. Which is why I give you a picture so I don’t have to listen to this BS.
I get what you’re saying, that the second peak, as it levels out across the next several months will basically flat line or even go down, which will make yoy become zero or drop. Where the difference of opinion is, is that I believe the January “bounce” was a precursor to a February “bounce” and that starting March things won’t flatline or go down. Most folks in the industry in San Diego feel that through the rest of the year a small appreciation, but appreciation none the less, will happen. I’m an outlier among that pier group and think the yoy in June, sept and Jan will be higher than they think it will be. The bottom line, though, is that I don’t see the second “peak” as a peak and see it as part of a general upward trend.
Wolf, your closeup chart looks different than the long term chart above.
Th Bob, in both the closeup and the chart above, lower highs are clearly being shown (stock market chart analysis which could be classified as pseudoscience).
My conclusion: Housing market appreciation is running out of steam. There is a higher chance that housing appreciation continues to come down (in most places) vs continuing to go up.
“Wolf, your closeup chart looks different than the long term chart above.”
yes, it’s a closeup. If you have a big screen, enlarge to long chart, and you’ll see.
Anecdote:
Realtor.com is now actively advertising Assumable Mortgages on their platform. This is opening up that world to others who may not have known that was a thing. That will result in some funky deals (I was involved in one back in 2012, cold hard cash on the side between friends in order to assume the mortgage). It will probably not move the needle much, but will result in slightly more churn than if this was not being advertised/promoted.
Listing’s this spring around me are similar to last year in terms of numbers and listing price. The difference is the homes are now sitting for 30+ days. The standoff between sellers and buyers continues.
The only thing that will end this bubble is a banking crisis just like last time.