More QT and fewer rate hikes?
By Wolf Richter for WOLF STREET.
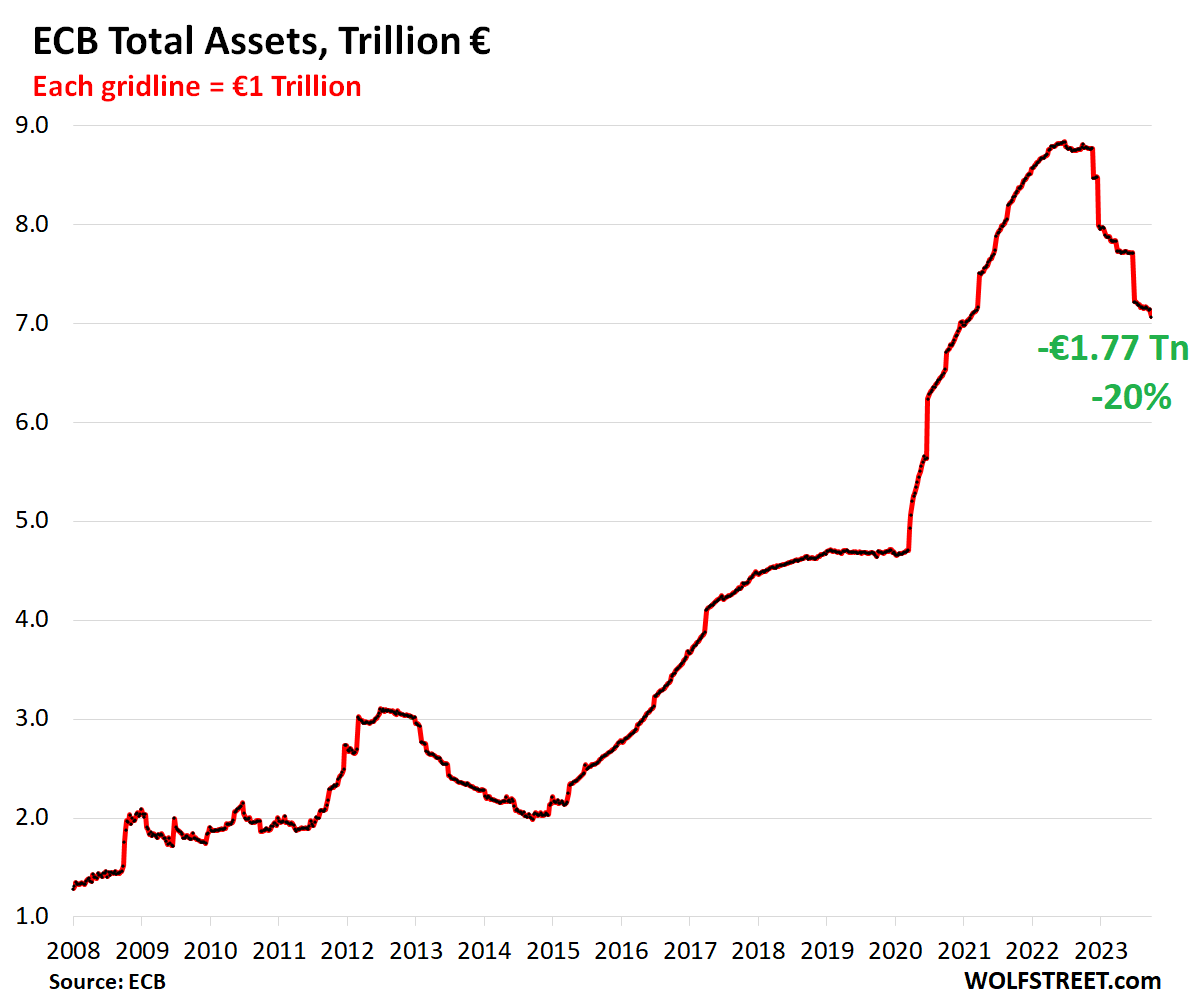
Quantitative tightening (QT) powers along in the euro area. Total assets on the ECB’s weekly balance sheet plunged by another €75 billion over the week, to €7.07 trillion, the lowest level since December 2020. The ECB has now shed €1.77 trillion ($1.86 trillion), or 20%, of its total assets since the peak in June 2022.
The ECB has now shed 42.7% of the €4.15 trillion in assets it had piled on during the pandemic.
The ECB had two big categories of QE, that are now being reversed:
- It offered loans under very favorable conditions to banks, ultimately handing banks €2.22 trillion in cash to deploy.
- It purchased government bonds, corporate bonds, and asset-backed securities, ultimately handing the financial markets €4.96 trillion in cash.
This two-pronged approach to QE caused asset prices to spike across Europe, including home prices, and it caused bond prices to reach such high levels that many government and corporate bond yields dropped into the negative, which was a historic absurdity.
That was then, and this is now. Now, as the balance sheet plunges, this stuff is reversing. Have a look at my chart of German home prices versus the ECB’s balance sheet: “QE Giveth, QT Taketh Away: German Home Prices vs. ECB Balance Sheet”
About a year ago, the ECB announced the first steps of QT, when it made the loan terms unattractive, and when it opened more windows for banks to pay back those loans, which caused the banks to pay back those loans in big waves, thereby removing liquidity via the banks and from whatever markets they’d placed this liquidity into.
In December last year, it announced the initial steps on unwinding its bond holdings, which started in March 2023 and has accelerated since then.
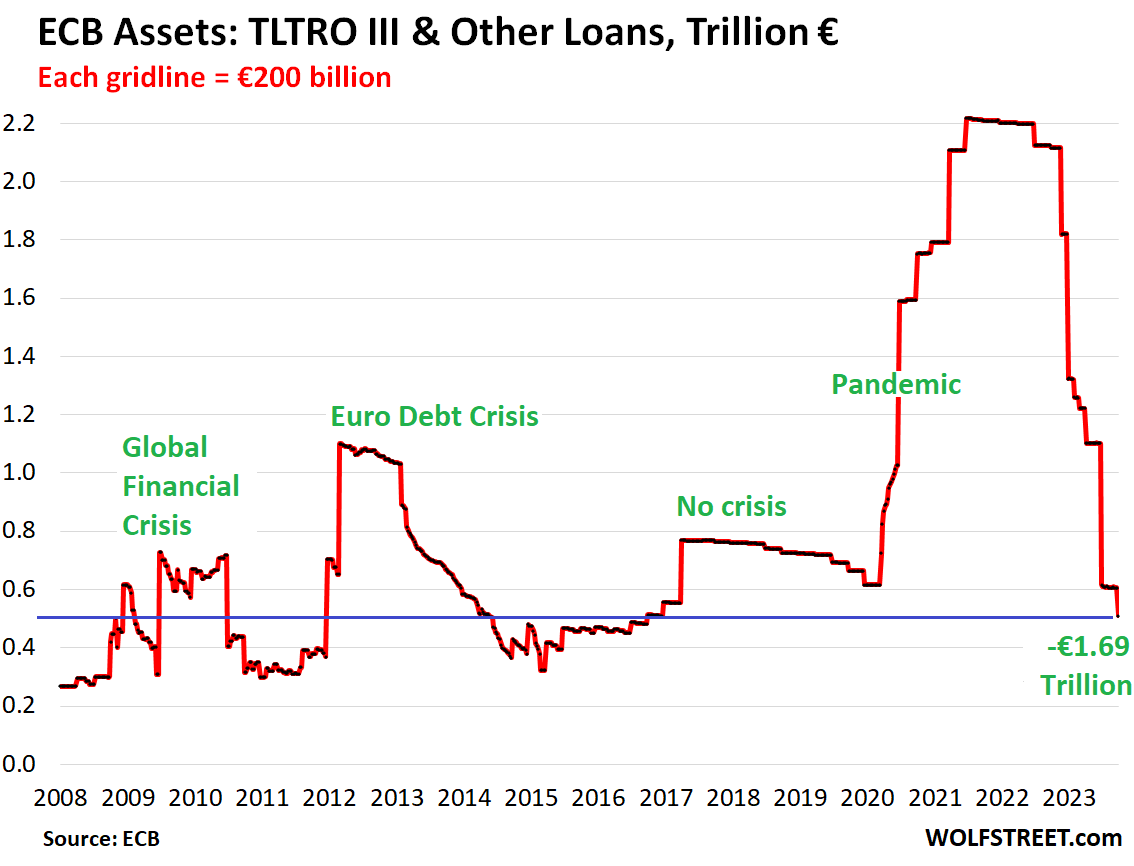
Entire pandemic loan QT unwound, plus some: -€1.69 trillion
The ECB has always handled QE via loans, its waves of Longer-Term Refinancing Operations (LTRO) and then Targeted Longer-Term Refinancing Operations (TLTRO) – including during the Financial Crisis, the Euro Debt Crisis that came afterwards, the no-crisis phase in 2017, and the pandemic.
During the pandemic, the ECB expanded these lending operations further and called them TLTRO III. These pandemic-era TLTRO III loans amounted to €1.6 trillion at the peak, on top of the still outstanding prior loans, to total at the peak €2.2 trillion in loans to the banks.
In the week of the current balance sheet through September 29, banks paid back another €96 billion in loans, bringing the total reduction of loans to €1.69 trillion so far, with only €510 billion in loans remaining, the lowest since November 2016. But dealing with the banks, that was the easy lifting:
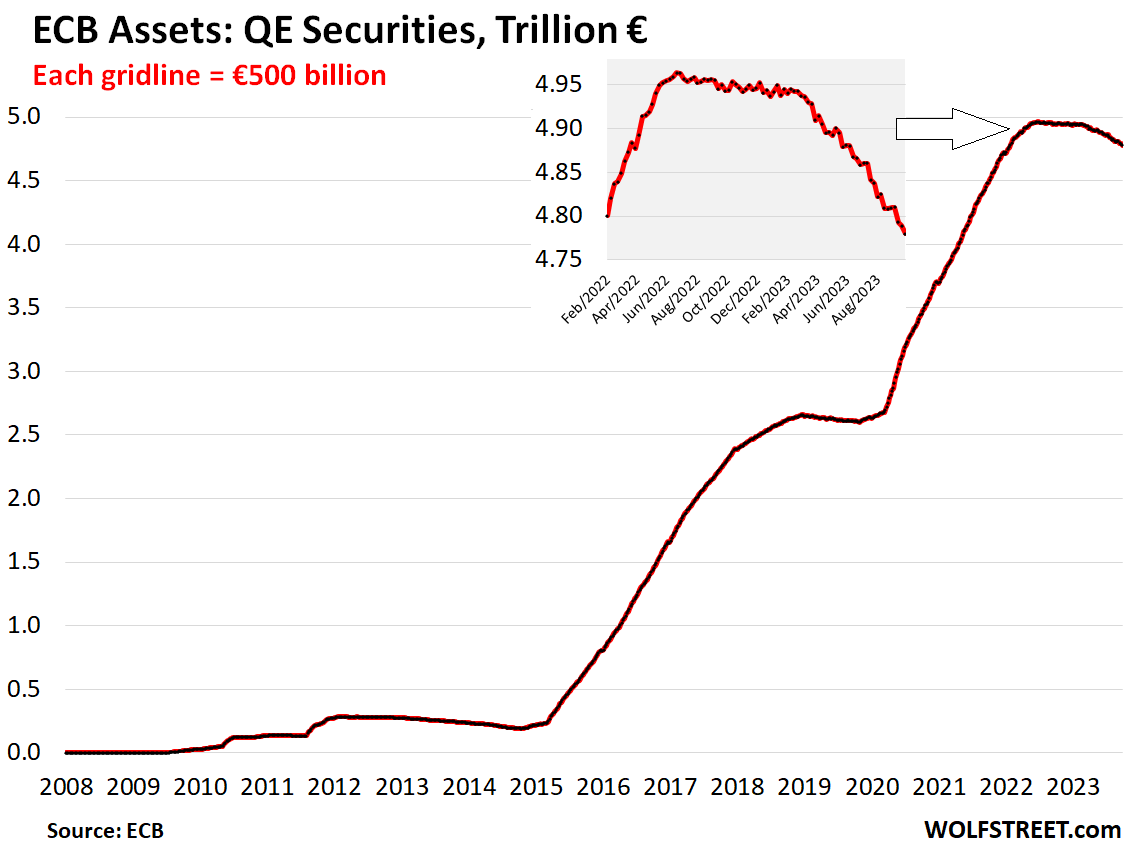
Bond QT speeds up: -€184 billion
The heavy and much trickier lifting are the bonds. The ECB had bought bonds under two programs: APP (asset purchase programme), starting in 2014; and PEPP (pandemic emergency purchase programme), which started in March 2020.
The current roll-off is limited to the APP bonds. But there have been public discussions by various ECB governors about starting to unwind the PEPP holdings as well.
The theory is that an accelerated bond QT should do some of the work instead of higher short-term interest rates, and that with an accelerated bond QT, it might not be necessary to hike policy rates much further.
The APP roll-off was initially capped at €15 billion a month when it started in March through June. In July, the cap was removed, and all APP bonds that mature roll off.
In September, €30 billion in bonds rolled off. Since the beginning of this bond QT in March, €163 billion in bonds rolled off. An additional €21 billion rolled off after the peak in June 2022, for a total of €184 billion since the peak:
Enjoy reading WOLF STREET and want to support it? You can donate. I appreciate it immensely. Click on the mug to find out how:

![]()
Hey Wolf,
I love your column and appreciate your insights. Got a question for you which might be stupid… the assets on the ECB balance sheet have dropped in value and you seem to attribute that to QT… but isn’t a chunk of that just a drop in the mark-to-market given the move up in rates? For all we know, they could be doing QE again (I don’t think so, but just for example) and the asset value would still be dropping given the rate move. I know the ECB has a lot of Greek govies that had super-long maturities… they must be getting clobbered right now.
No.
Loans are never marked to market. That’s where the biggest drop is. Read the article, chart #2.
And the ECB doesn’t mark the APP and PEPP bonds to market.
Instead of measuring QE from the start of the pandemic, I think we should measure QE from the start of QE (or possibly from Bernanke’s implementation of the Wealth Effect). Moreover, I agree that QT can do some of the work of additional interest rate increases, provided the Fed increases the rate of QT to $125 billion per month or more.
Not sure how much of a difference $125bb a month from $90bb a month really will make in the grand scheme of things. Fed’s assets below $8T today. Hopefully we don’t have some liquidity crisis like in March so it can keep going down. O/N RRP under $1.3T today as well, too.
The last time I suggested increasing the roll-off rate without mentioning a specific number, someone replied to the effect that everything will break if the Fed immediately liquidates its holdings of L-T bonds. I don’t know what the magic figure should be (that is, faster without blowing up the world), but $125 billion seems better than $90 billion. Also, I would eliminate the separate caps for MBS and Treasury bonds.
For what it’s worth. ICE (Formally Black Knight) released their October 2023 Mortgage monitor. I am just passing some info along based on their research. I read their free report each month.
» Nationally, home prices are now 2.5% above the record highs set in 2022, on a seasonally adjusted basis, with prices in two thirds of major markets surpassing 2022 peaks
» The areas pressing the furthest above 2022 levels are primarily in the
Northeast and Midwest, including Hartford (+11.1%), Cincinnati (+7.8%), Milwaukee (+7.8%), Providence (+7.5%), and Philadelphia (+7.1%), with more than one third of markets now at least 5% above 2022 highs
» In the western U.S., along with pandemic boomtowns in the South and
Southwest, prices largely remain below their 2022 highs; however those gaps have been closing quickly as prices heated up again in recent months
» Los Angeles and San Diego are notable exceptions in the West, having fully reversed the corrections in prices seen late last year, with prices returning to all-time highs.
-Delinquency rates are down 4 bps to 3.17% and this is near record lows.
-Foreclosure starts are up 21.3% but still remain 13% below pre-pandemic levels.
-Prepayment Activity is +6.3%
Basically means higher for longer for FED I guess.
Still too much liquidity around the economy.
Yep. They need to make sure QT keeps moving along.
But there are some cracks. Like the mortgage applications dropping to the range of all time lows. Also, mortgage and refinance applications “denials” are increasing. I guess many of those denials are based on the income qualifications. What is also interesting is a lot of refinances loans are being denied.
Why are people refinancing at all. They probably need the cash for some expenses?
Some cracks for sure as you mentioned, but the home prices are also not going down as mentioned by you.
I was in a new sub division last week, fully sold homes, at $550K, and median income for that city is $40Kish.
It’s crazy out there per me.
If I had to guess, the people refinancing are probably people who bought years ago, so their acquisition mortgage was way below the market value today. So they’re trying to take cash out. I wouldn’t borrow against my home at 8%, but better than credit cards at 24.99%, I suppose.
Hot off the press:
https://wolfstreet.com/2023/10/05/fed-balance-sheet-qt-down-1-0-trillion-from-peak-to-7-96-trillion-lowest-since-june-2021-in-september-alone-146-billion/
Much is said about the fact the Fed doesnt have to account for the losses in their MBS portfolio.
But the WINNERS on the other side of the “trade”, those who have the mortgages at ultra low levels are the reason for the low levels of inventory.
So the losses do indeed have a financial impact. The Fed’s unrealized losses are the unrealized gains for others. ..and the real reason the real estate market is broken. IMO
Still extremely high when compared to 2008-2015 (see last graph), even in real terms. Just eyeballing the current curve, it might drop to those historical levels by around 2030, assuming no great disasters (a rash assumption). Much more work to do.
Economies driven by central planners (like the ECB and Fed) remind me in some ways of the Soviet Union, the ultimate centrally planned economy, which, as we all know, completely collapsed.
That you cannot tell the difference between the USA, the EU and the Soviet Union says more about you than it does about any of those economies.
Seriously.
The verticals :
1) Fifteen years ago, in Oct 2008, the ECB raided European bank accounts during the financial crisis. The second raid started in Mar 2020.
2) Madam ECB might be more powerful than Scholz and Macron.
3) US yield curve shifted to the left : US 10Y is higher than US 5Y. In
few months US 3Y might produce an inverted hump. US 10Y poked at
5%, but failed to reach it.
5) Japan 3M is (-)0.3%. Japan 10Y is 0.8%, the 30Y is 1.8%.
The German 10Y is 2.88. // Gravity with Germany and Japan pulls US
10Y down.
Anybody reading that first chart would have to expect QE to kick in again over the next few years. It reflects a parabolic uptrend. Let’s see what happens during the next swift asset price drop.
You’re counting on another pandemic, and on another monetary overreaction to a pandemic. There has been only one in my lifetime so far. And if there is ever a second pandemic in my lifetime, there likely will not be another monetary overreaction because by now everyone can see what that did: unleashing the long-contained furies of inflation.
Great article. I strongly believe that the asset prices are tightly connected the central bank balance sheets. With all the mistakes ECB did, encouraging the banks to pay their loans early was a smart idea. I think FED should do that as well for BTFP and shut it down afterwards.
I think the thing most central banks know, but pretend they don’t is that QEs inflate asset prices, which translates to CPI afterwards. It also increases inequality because ridiculously sized, reckless and irresponsible money printing during the pandemic inflated the asset prices 50% to 100%, but the people at the bottom of the pyramid were not able to increase their incomes nowhere near these values. So the rich, who hold assets got much richer and the others who struggle is in worse condition (although most have a job).
The only cure to rollback this reckless QE is fast and determined QT. Wall Street will cry a lot but the average citizen will take a relief with such a QT.
“I think the thing most central banks know, but pretend they don’t is that QEs inflate asset prices…”
Actually, that was the explicitly stated goal of QE by the Fed. Ben Bernanke wrote an op-ed in the Washington Post advocating the policy on November 5, 2010. Here’s a paragraph from that op-ed:
“This approach [purchasing long-term Treasury securities] eased financial conditions in the past and, so far, looks to be effective again. Stock prices rose and long-term interest rates fell when investors began to anticipate this additional action. Easier financial conditions will promote economic growth. For example, lower mortgage rates will make housing more affordable and allow more homeowners to refinance. Lower corporate bond rates will encourage investment. And higher stock prices will boost consumer wealth and help increase confidence, which can also spur spending. Increased spending will lead to higher incomes and profits that, in a virtuous circle, will further support economic expansion.”
I agree it increased wealth inequality significantly, but that was actually the policy goal. As horrible as the policy is/was, they were transparent I guess.
The average citizen is currently benefitting from a slow and gradual QT.
Years of QE (and loose monetary policy) helped capital (asset owners). Now the unwinding of that is benefitting wage earners (the average citizen). Asset prices are gradually falling and wages are outpacing inflation.
A fast unwinding of QE would cause lots of economic pain and likely result in lots of layoffs and unemployment. A deep recession would really hurt the average person because there is a decent chance they would be jobless.
Slow and gradual is the way to go.
Agreed.
The coming supply of NEW debt will handle the rates……supply and demand….WHAT A CONCEPT!
The Fed can sit pat……and watch the politicians blame reality of economics for the high rates.
Sorry, this was meant to be in reply to Jason at 6:44 pm.
Repost it in reply to the correct comment, and I might then delete the original.
Done, thank you Wolf.
Wolf, in your other article titled “QE Giveth, QT Taketh Away: German Home Prices vs. ECB Balance Sheet” you juxtaposed the ECB total assets graph and the German home price index to illustrate the strong correlation (and perhaps to suggest, also by the title, that the balance sheet increase was responsible for the home price increases – alas, correlation is not causation, as they say..). In this article you break down the ECB assets into two categories: TLTRO & other covid era lending measures vs Bonds and the graphs suggest that much of the QT happened in the former category (and is picking up pace in Bonds now that the former is essentially down to naught). But then, going back to the too perfect comparison with German home price index, would your prior argument not suggest that the home price gains and now the drop were correlating (or, horrors, caused by) the covid era lending measures more so than the Bond purchases/sales? Which would raise the question of how those, supposedly business sustenance, loans were actually used? Isn’t that the right implication from these two articles? Thoughts? Thanks.
In other words that business owners and their kin feeding at the CB trough (TLTR or PPP) knowingly took advantage of cheap loans, or shall we say laundered the free (note the PPP cancellation…) money), others did not have access to converting it into hard assets viz. RE and the CB are now doing the mop-up op by punishing everyone who did not benefit (while loudly claiming, also on these pages at times that folks are a-flush with covid stimi need to be reined in) ? Looking Columbo-ish: How am I doing so far?
A simpler and less conspiratorial explanation would be that ZIRP (or NIRP as it were) was responsible for an explosion in mortgage loan origination funding the fabulous home price increases and, symmetrically, the rising rates are responsible for the recent drop in home prices. So nothing to do with CB balance sheet per se. (As we noted correlation is not causation.) This should be easy to illustrate or to disprove with mortgage origination volume, or outstanding mortgage principal aggregates vs home price index comparison.
My reports on the ECB balance sheet, which I have done all year, maybe longer, have split out loans and bonds from get-go, and so this was no surprise to me, and my thinking has been based on this all year, and nothing changed, except it was confirmed.
The cash from the loans to the banks was not used to plow into mortgages, or else this liquidity could not come back like this; it would instead be out there for years.
The banks used this ECB cash to buy some assets that then can be sold, or to lend short term, etc. But the cash was not lent out long term.
What impacted German home prices (any home prices) are long-term interest rates (financing a home gets cheaper) and asset prices (people feeling rich, have more collateral, etc.). QE inflates prices, and thereby pushes down yields (long-term interest rates), which pushed mortgage rates close to 0% in Germany. That’s not the ECB’s short-term rates that did that, but long-term rates that got pushed down via QE. Now all that has reversed, every part of it.
Wolf, thank you for this article.
What I did not know and now learned is that the ECB seeks to compensate for its low interest rates with a more aggressive QT.
There really is a point to it.
Thank you again!