Fed’s favored inflation measures get a big upward revision going back across this bout of inflation.
By Wolf Richter for WOLF STREET.
The Bureau of Economic Analysis has adjusted its Personal Consumption Expenditure data going back to Adam and Eve as part of its “comprehensive update of the National Economic Accounts.” With these adjustments, the new versions of the PCE price index, the “core” PCE price index, and the “core services” PCE price index were revised higher across this bout of inflation. In other words, inflation has been hotter.
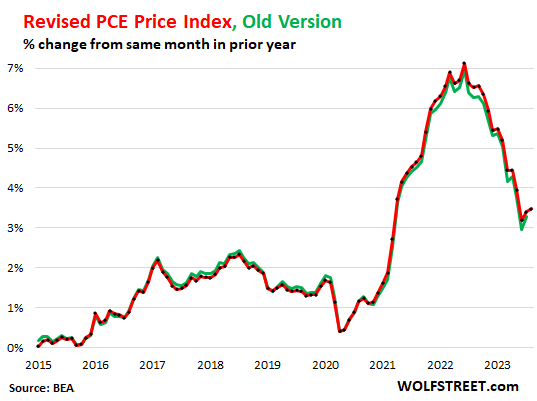
The revised PCE price index accelerated to 3.5% in August, from the revised 3.4% in July. The old version’s July reading had come in at 3.3%.
The new version’s June was raised higher to 3.2%, from the old version of 3.0%. The new version’s peak in June 2022 was revised higher to 7.12%, up from 6.98% for the old version. The chart shows the new revised index through August in red and the old data through July in green:
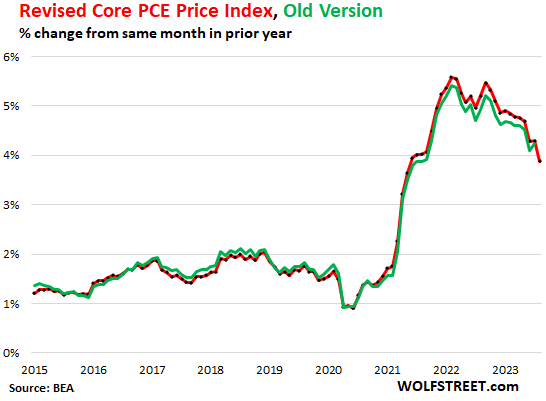
The revised “core” PCE price index (excludes food and energy products) rose 3.9% year-over-year for August, still nearly double the Fed’s target. But it was a deceleration from the revised 4.3% in July.
The revised July of 4.3% was up from the old July of 4.2%. The revised version (red) had topped out at 5.6% in February 2022, while the old version (green) had topped out at 5.4%.
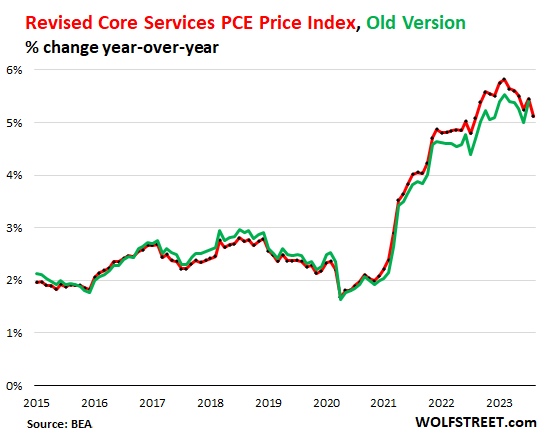
“Core services” PCE price Index (services without energy services), a crucial metric because it shows where underlying inflation has gotten entrenched, was revised substantially higher for the years back through 2020.
The original version (green) had peaked at 5.54% in February 2023, which has now been revised to 5.82% (red). These are big upward revisions!
July was revised up from 5.40% to 5.45%. June was revised up from 5.00% to 5.24%.
Today’s core services PCE price index for August rose by 5.1%, a decelerating from the revised July.
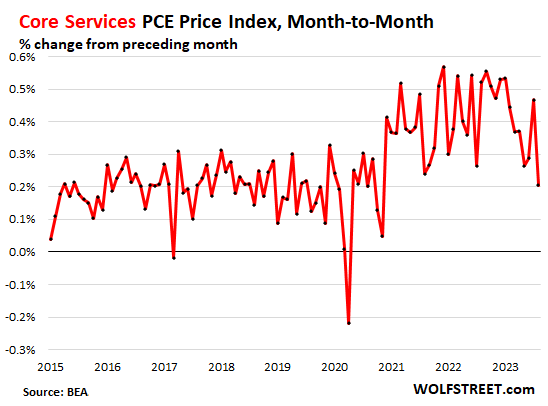
On a month-to-month basis, the new core services PCE price index rose by 0.2% in August. A deceleration from the 0.5% spike in July, in hugely volatile month-to-month data:
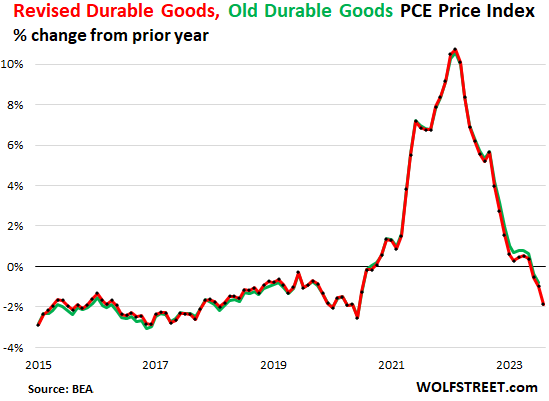
The durable goods PCE price index was also revised going back to Adam and Eve, but not by significant amounts.
In August, the index fell by 1.9% from a year ago, unwinding the monster spike, driven by a drop in prices for motor vehicles, household furnishings, recreational goods and vehicles, and other goods (revised = red; old = green):
Enjoy reading WOLF STREET and want to support it? You can donate. I appreciate it immensely. Click on the mug to find out how:

![]()
Thanks WR for this report.
So, this revision is always upward.
I can see how this data is being manipulated in various ways.
It was revised downward for the 3 years before 2020. It was revised upward for the years before 2017, etc. So you can cheery-pick to suit your narrative 🤣
don’t they set the TIPS rate using these numbers
if so then TIPS folks were under paid on their interest
CPI (not the PCE price index) is used to calculate TIPS inflation compensation. But yes, similarly, the odious health insurance adjustment in CPI for the past 11 months caused them to be underpaid. But a year earlier, they were overpaid because of the same issue in the opposite direction.
you never get true inflation numbers from governments, especially with large outstanding debt…..
Numbers generated to justify Fed not raising interest in August despite CPI reversing course seem to be very popular with wallstreet and mainstream media.
I see a Depth Charge rant coming any time now…
and it’s welcomed.
A .15 percent increase in core PCE would round to .2 percent.
A .14 percent increase in core PCE would round to .1 percent.
I wish the government would give us the data to two decimal places.
Maybe Wolf can provide us a link to the actual numbers from which the percent change is calculated, so we can calculate the percent change ourselves. I can find the CPI numbers, but not the PCE numbers.
Month-to-month:
PCE: +0.24%
Core PCE: +0.14%
Core services PCE: +0.20%
Durable Goods PCE: -0.33%
Thanks Wolf.
Thanks for the info, Wolf.
Why do these revisions happen so long after initial estimates?
These revisions went back many years. In addition they also shifted the index scale to move the value of “100” from 2012 to 2017, which then shifts the scale all the way back to the beginning of the data series. I had to revise my entire data set going back to the 1950s, LOL.
They do this every five years. Yesterday the revisions for GDP and its components came out, going back many years.
The best thing is to just grin and bear it since it happens every five years.
Id watch a documentary of you managing all your spreadsheets and data
Do you suffer from insomnia? 😆
It’s all done at your fingertips, right wolf? We all know you rarely sleep too.
Oh, this actually (sorta) makes sense. Here I had been waiting for the punch line as to what was being manipulated and why. But maybe it’s legit…
Why do they do thee revisions of the scale Wolf?
You see that the biggest revisions were for 2020-2022. And for services, not goods. This was during the horrendous and sudden spike of inflation, with rents blowing out. Just totally nuts. Any time there is such a huge and sudden shock, the data can go off the rails. The measures used to capture the data are not designed to capture those kinds of shocks. We saw that in other data during and after the lockdown across the board where there were sudden shocks.
looks like there is a big discrepancy between PCE core service and CPI core service. CPI service without the massive healthcare adjustment is still accelerating much higher.
I saw the revision to July, but not all the other revisions in the reporting I read this morning. This may explain the relative collapse in long-term yields early and subsequent rebound later in the day as all of the actual data was processed. I was paying particular attention to the 20-year treasury. Or maybe it was just random. Thanks for the detailed report Wolf.
Today’s news is that core PCE yoy came in at 3.9% in Aug (+0.1% mom) down from 4.3% in July (+0.2 mom).
Core PCE MoM was .14%, as Wolf noted in the comments above. Just .01% more and it would have been .15%, which would round to .2%, same as last month. But I guess the media needs something to whoop about.
For about last 6 months, the main stream media has always been highlighting the headline inflation, and gave the core in details.
Today, almost all of them highlighted the core PCE, which is falling, and touched the headline PCE, which is rising, in the details. They all suddenly started emphasizing the core PCE.
And it’s always a monthly number while GDP is always annualized.
They use whichever one allows them to be more delusional about a Fed pivot.
But CNBC just said all is well with gumdrops and unicorns on PCE and The Fed will be happy! (I’m being facetious). Thanks, Wolf for explaining all of this data.
Core PCE going down. Good news. And this is the most relevant new data. M2M even better than estimates. I’m good.
Is it useful or simply a manipulative game for the govt to drop out energy and food in some of the govt inflation measures?
Since humans need four things to survive, basically food, water, energy, and shelter; why is it useful to drop out 50% of what is needed by our species in order to calculate the direction of financial pain/theft, which we politely label as inflation? Too “volatile” and thus unpredictable at times, yet isn’t that the definition of life…unpredictable and volatile at times?
Perhaps an inflation metric indexed to weather change is more useful? How about a political inflation metrics, a war inflation metrics, a Fed inflation metric???
Fascinating yet extremely difficult to calculate, yes, but not by future A.I. which drives our human emotional hype train at the moment…
I would add education to your basic four. Maybe a reflection of values, but education is a necessity in modern society IMHO. (And education costs are rising at an insane rate…..)
Yort,
“Is it useful or simply a manipulative game for the govt to drop out energy and food in some of the govt inflation measures?”
This is nonsense on several levels. Too many 🍺 to early in the day?
1. There are always both measures, PCE price index, and the core PCE price index, so you can see. Both have their own charts here.
2. EVERYONE knows that food and energy prices are very volatile, UNRELATED to underlying inflation. Energy prices PLUNGED starting in mid-2022, and they PUSHED DOWN headline PCE price index and headline CPI, but core PCE and core CPI stayed high and we knew that inflation didn’t go away just because gasoline prices plunged.
3. That’s why we have and why you can see here “core PCE” and “core services PCE” and “durables goods PCE” etc.
3. I must have explained this a million times.
Is there any reason why everyone must rely on government/Fed authorities to do produce such a “real inflation rate”? And if these High Lords of Data refuse to do so, are there no alternatives? Surely there’s data that people can gather up and publish which can get you the “real” inflation ratings you think (as do I) better represent reality, volatile or not?
By the way, a question for Wolf, if I may tack one on here. You wrote in a comment, “…they also shifted the index scale to move the value of “100” from 2012 to 2017…They do this every five years.”
Question: does this mean they’ll do another revision, using a new index scale based on the year 2022? And what might using 2022 do to that future index (given that the base year 2022’s “100” has much more persistent inflation than, say, 2017 or 2012’s? Thank you.
“Question: does this mean they’ll do another revision…”
They’ll shift the index scale again in 2028, by shifting “100” to 2022.
Shifting the index scale itself does not change any of the percentages.
It’s the other revisions that change the percentages, up or down.
Good pick up Wolf
Not reading it any where else
Core is nearly double the target rate. Do you really think they will keep rates the same? Really? For how long? This is going to take a long time.
Higher for longer as the 10 year plus starts to rise going into high demand for Q4
Howdy BS. Higher for forever? Maybe
try the TLT Etf if you want to see the real bloodbath.
Invest in the US government and lose 50% in two years. Nice.
It’s a clear sign monetary policy has been tremendously mismanaged.
Since Jerome Powell is so distressed about inflation, then it should be appropriate for news conferences to ask him if this means 2 (two) interest rate increases this year. Certainly, he would want to fix that pause mistake (in hindsight) and get right on back on track.
“Since Jerome Powell is so distressed about inflation,”
The false narrative is that a return to 2% is a victory. Lost is the fact there is about a 12% overshoot of the “target” for the period of the past 2.5 years. What is Powell to do about that?
….you don’t push interest rates to a 1,000 year low with out some ‘kick back’.
There have already been more than 2 (two) interest rate increases this year (annum).
Howdy folks and Lone Wolf. Adam and Eve. HEE HEE. Glad you are keeping your sense of humor. Explaining the truth to US is wonderful. Thanks
“If you can’t hit the target, move it!”
B
God I love this post. Back to Adam and Eve. 😂
Not to take away from the good humor, (Since nobody is going to do what I, or anyone else wants, might as well have a laugh), but I’d like to go a ways further back and see if God was kinda thinking about creating a Universe for a while first, or if He just woke up one morning and was inspired to do it over breakfast…(We ARE made in his image, right?)…maybe got it in a dream or something.
BTW; I don’t like that “Big Bang explanation” any better, mostly because they are all too strung out on making the math work out right, or getting their Nobel Prizes and more pay. There are greedy people everywhere….just a matter of degree.
But those Hubble pics really are incredible, as is, NO doubts there, as are the pics of our ball in space from the Moon landing era.
It’s all the identity I need.
All this to say: The $32.50/hr. I make today is equivalent to about $20/hr in 2003 dollars.
I made $20/hr at my summer job for the years before that…
Shoulda stayed out of college and kept mowing lawns?
Instead I am responsible for the upkeep of (today’s price) about 1/4 Billion dollars of real estate. My boss likes hiring undocumented (unskilled, some English) help: “Because he doesn’t have to pay for the benefits.”
Also my company is international and owned by a billionaire.
Sad.
In the end it always goes up. Just like aging, it is invisible until it’s obvious.
That’s why I always used loans to buy real estate.
Asset prices should be included in the price indices:
“Researchers examined the median home prices last year for roughly 575 U.S. counties and found that home prices in 99% of those areas are beyond the reach of the average income earner, who makes $71,214 a year, according to ATTOM..”
This is “consumer price inflation,” and it includes housing costs (“shelter”) as a service.
In terms of “asset price inflation”:
If you want to look at “home price inflation,” go here:
https://wolfstreet.com/2023/09/26/the-most-splendid-housing-bubbles-in-america-september-update-spring-bounce-fades-20-city-index-0-6-from-peak-in-2022-flat-year-over-year/
If you want to see “stock price inflation,” go look at a 20-year chart of the S&P 500.
YoY Core is the most significant number (according to the Fed).
5.4 – 2 = 3.4 ie, core needed to drop 3.4% to get to 2%
5.4 – 3.9 = 1.5 today’s numbers, core has only dropped 1.5%
Inflation still needs to drop by more than 50% to reach 2%. The Fed should not be taking any victory laps here. It raised rates 5% to get less than 1/2 way to the goal.
Side note addedum:
It’s kind of funny how Congress delegates inflation control to the Fed. As if they have no impact on inflation.