Prices in New York City condo market, San Francisco Bay Area, Seattle down to early 2018 levels. Chicago nearly flat from year ago. Other markets rise. Phoenix, Tampa, Charlotte surge.
By Wolf Richter for WOLF STREET.
Reports have been circulating for a while about the deterioration in the Manhattan housing market, including a report in December that studied condo towers with 30 or more units, built after 2015, in total 7,727 condos, nearly half of which the developers have been unable to sell. Much of the new inventory is at the luxury end.
The median price of luxury condos and co-ops in Manhattan (median means half of the units sold for more, and half sold for less) in Q4 2019 plunged 24% from Q4 2018, to $4.8 million, according to the Elliman Report, and is down 27% from Q4 2016, which was the peak. The median price of all condos and coops in Manhattan in Q4, at $999,000, was flat compared to Q4 2018, but was down 6% from Q4 2017.
So today, the S&P CoreLogic Case-Shiller Home Price Index was released. The way the index is structured, it is much kinder and gentler, and far less volatile, than median price indices. For the New York metro, it offers two indices, one for single-family houses and one for condos. It uses a custom area for New York City that includes numerous counties in the states of New York, New Jersey, and Connecticut “with significant populations that commonly commute to New York City for employment purposes.” This is far larger and more diverse than Manhattan. Condo prices in the metro fell 0.9% in November from a year earlier, below where they’d first been in February 2018:
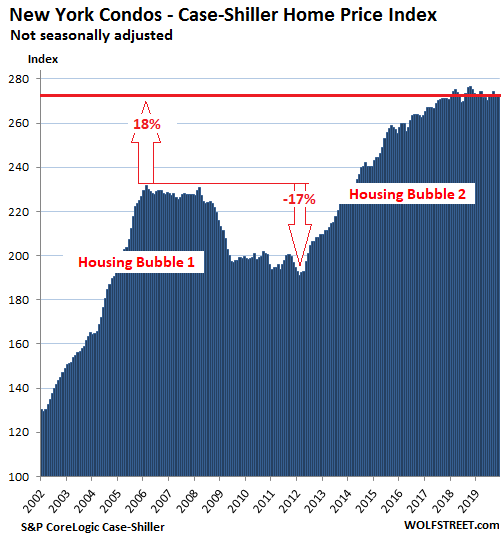
The Case-Shiller Index is a rolling three-month average. Today’s release includes closings that were entered into public records in September, October, and November. The index was set at 100 for January 2000. The New York condo index value of 273 means prices have soared 173% since January 2000.
San Francisco Bay Area House Prices
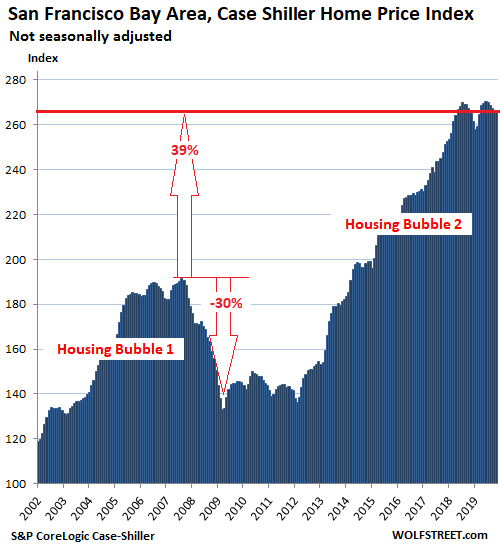
The Case-Shiller Index for single-family houses in the five-county San Francisco Bay Area – the counties of San Francisco, San Mateo (northern part of Silicon Valley), Alameda and Contra Costa (East Bay), and Marin (North Bay) – ticked up 0.2% in November from October and was up 0.5% year-over-year, but was below where it had first been in May 2018. Note the double peak:
All charts here are on the same scale, with the vertical axis ranging from 100 to 290. This has the visual effect that there is more white space above the curve in markets where prices have soared less than they have in Manhattan, Los Angeles, San Francisco, Seattle, or Miami. From these charts it’s also clear that there is no “national” housing market but that all markets are local, each with its own dynamics; but that all of them are also subject to national dynamics, such as the Fed’s loosey-goosey monetary policies.
Seattle House Prices:
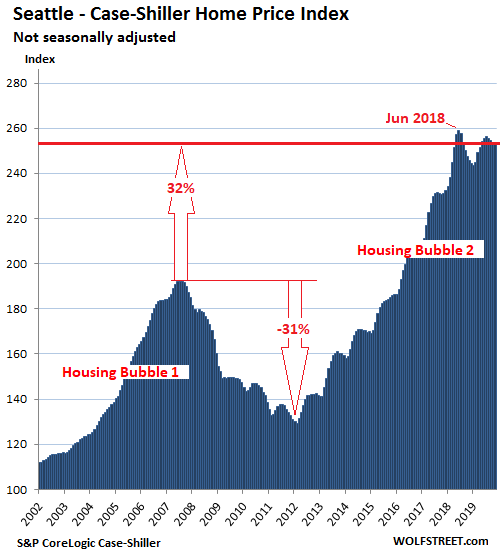
House prices in the Seattle metro were unchanged in November from October, and where down 2.0% from the peak in June 2018. This put them below where they’d first been in May 2018. Note the double peak:
The Case-Shiller Index methodology is based on “sales pairs,” comparing the sales price of a house that sold in the current month to the price of the same house when it sold previously. This method dodges some of the problems other indices have: Median-price indices can be skewed by “mix”; and average-price indices can be skewed by a few big outliers.
Los Angeles House Prices:
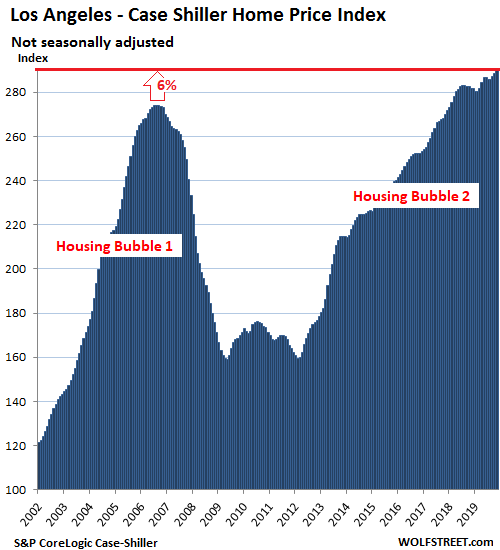
House prices in the Los Angeles metro rose 0.3% in November from October to a new record and were up 2.7% year-over-year. Los Angeles is now the market in the 20-city Case-Shiller Index where house prices have risen the most – by a dizzying 189% – since January 2000:
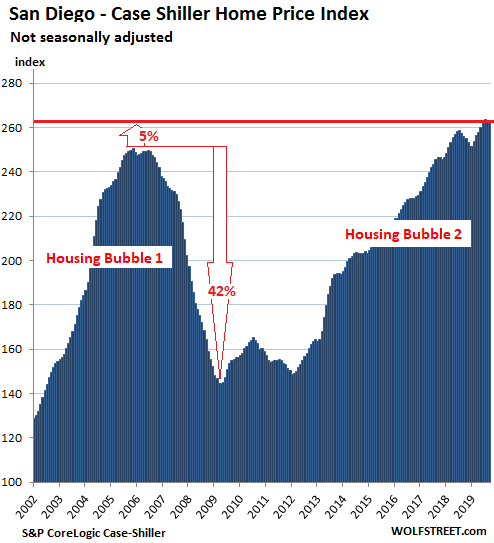
San Diego House Prices:
In the San Diego metro, house prices ticked up 0.3% in November from October, and are up 3.9% year-over-year, but remained a tad below where they’d been in July 2019:
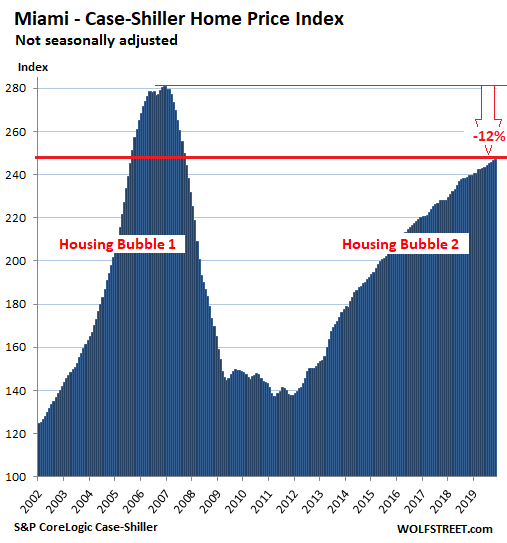
Miami House Prices:
House prices in the Miami metro rose 0.2% in November from October and 3.1% year-over-year. The index remains down 12% from the splendid insanity at the end of 2006 but is trying hard to get back to those levels. I want to emphasize that these are single-family-house prices in the vast Miami metro, and not condo prices, particularly the higher end near the waterfront, where Manhattan-like dynamics are playing out.
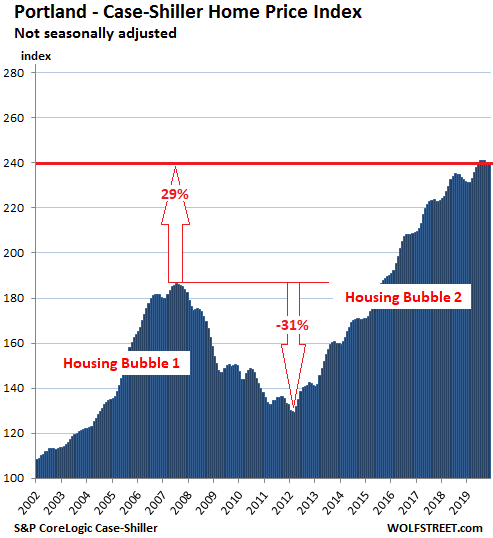
Portland House Prices:
The Case-Shiller index for the Portland metro was about flat in November compared to October and was up 3.3% year-over-year. At 240, the index is up 140% from January 2000:
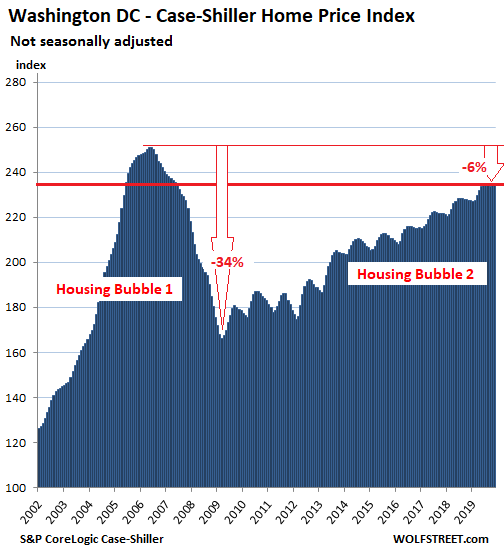
Washington DC:
House prices in the Washington D.C. metro ticked up 0.2% in November from October and were up 3.2% year-over-year:
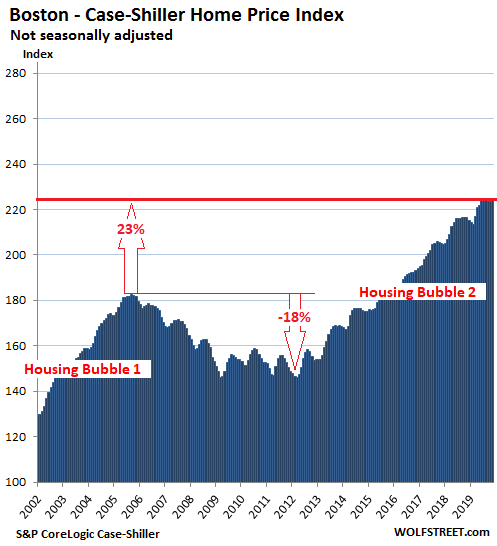
Boston House Prices:
House prices in the Boston metro rose 0.5% in November from October. Year-over-year, prices rose 3.8%:
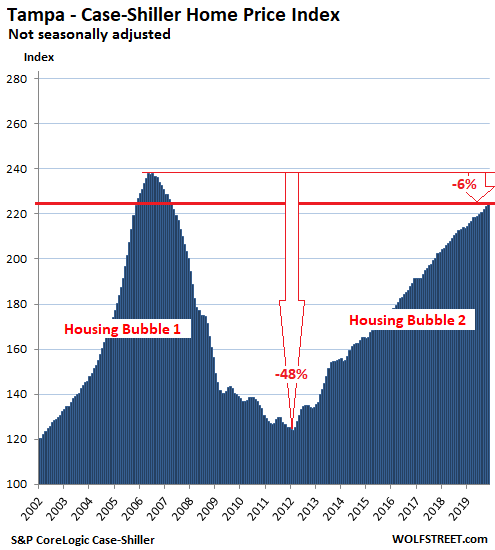
Tampa House Prices:
House prices in the Tampa metro rose 0.5% in November from October and were up 5.0% year-over-year, the third-largest year-over-year increase of the metros in the 20-City index, behind Phoenix (+5.9%) and Charlotte (+5.2%). The index is closing in on the craziness in 2006:
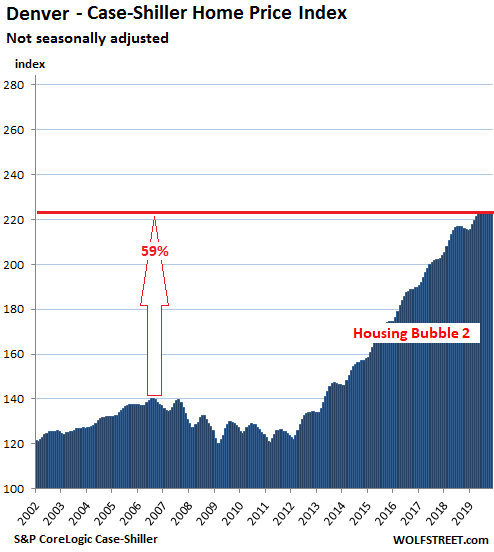
Denver House Prices:
House prices in the Denver metro were flat in November compared to October, and were flat for the past six months, but were still up 3.7% year-over-year:
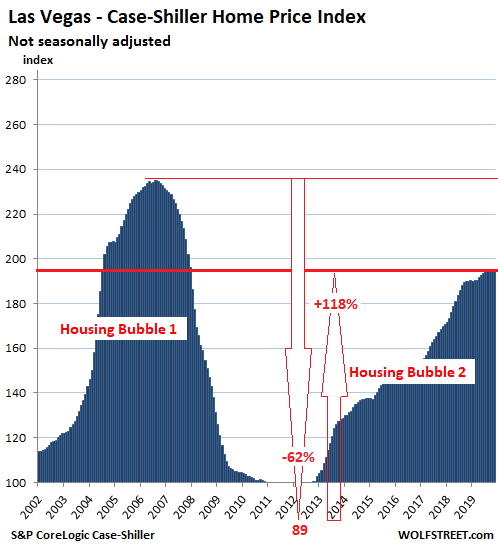
Las Vegas House Prices:
House prices in the Las Vegas metro rose 0.4% in November from October and gained 2.6% year-over-year, but for the past five months remained roughly flat:
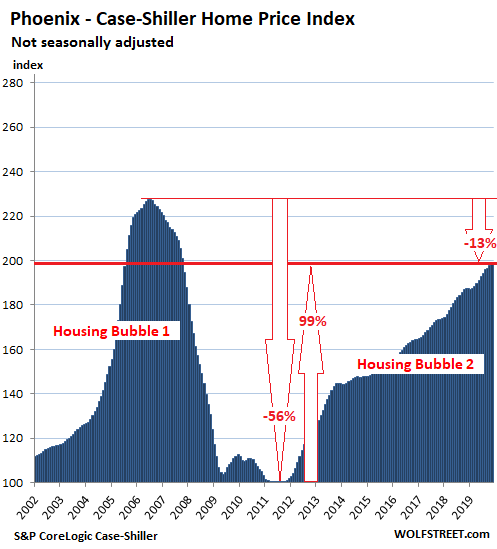
Phoenix House Prices:
The Case-Shiller index for the Phoenix metro rose 0.4% in November from October and was up 5.9% from November last year, the fastest year-over-year growth among the metros in the 20-City Index. And it’s fast approaching the crazy level of 2006, having almost doubled since September 2011:
Dallas-Fort Worth House Prices:
In the Dallas-Fort Worth metro – the counties of Collin, Dallas, Delta, Denton, Ellis, Hunt, Johnson, Kaufman, Parker, Rockwall, Tarrant, and Wise – house prices ticked up 0.2% in November from October, to a new record, and are up 2.8% year-over-year:

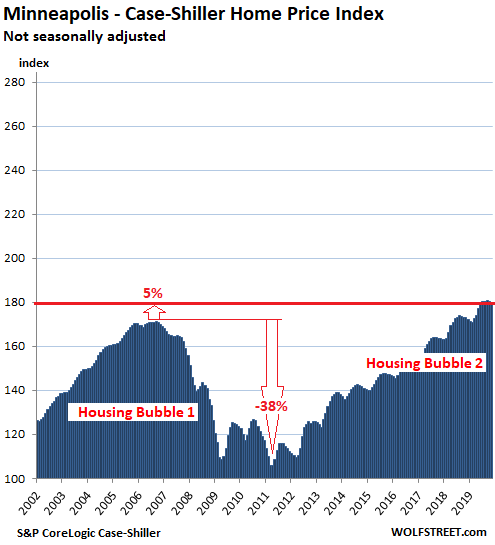
Minneapolis house prices:
House prices in the Minneapolis metro fell 0.5% in November from October and were up 3.9% year-over-year:
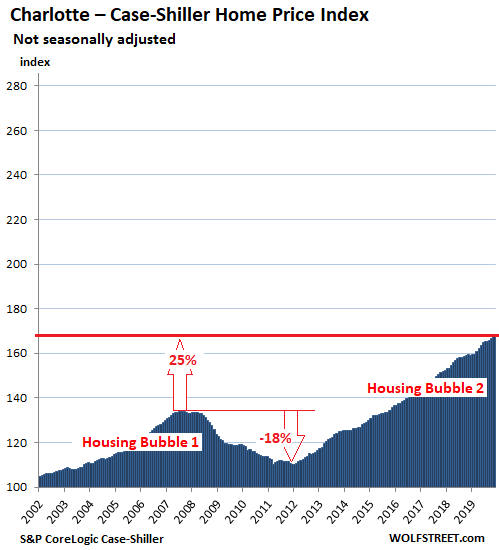
Charlotte house prices:
The Case-Shiller Index for the Charlotte metro rose 0.6% in November from October, and 5.2% year-over-year, the second-biggest year-over-year gain in the 20-City Index, behind Phoenix:
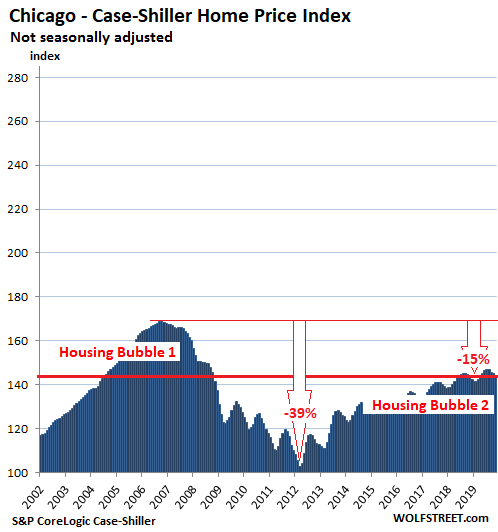
Chicago House Prices:
House prices in the Chicago metro – the counties of Cook, DeKalb, Du Page, Grundy, Kane, Kendal, McHenry, and Will – fell 0.6% in November from October, whittling down the year-over-year gain to just 0.4%:
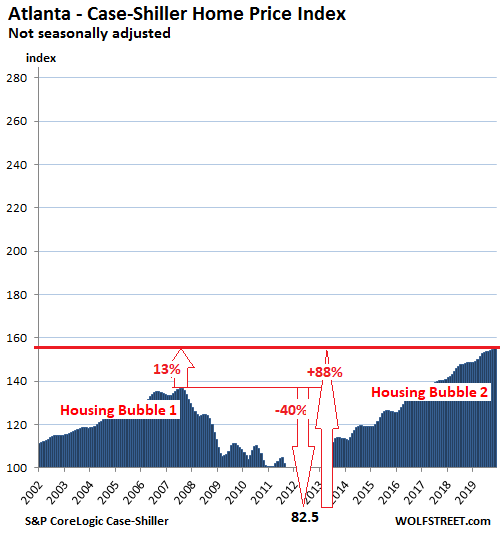
Atlanta house prices:
House prices in the Atlanta metro ticked up 0.2% in November from October and rose 4.2% year-over-year. During Housing Bust 1, the index had plunged 40% to an index value of 82.5 in March 2012, back where it had been in 1996. But since then, it has surged 88%:
What are we looking at here? House price inflation.
The Case-Shiller Index compares the sales price of a house in the current month to the price of the same house when it sold previously. In other words, it tracks how many dollars it takes over time to buy the same house. The house doesn’t change much, it just gets older. What changes is the purchasing power of the dollar with regards to houses. This makes the Case-Shiller index a measure of “house-price inflation”: When house prices shoot up, it means the dollar is more rapidly losing its purchasing power with regards to houses. And when house prices fall, it means that the dollar is gaining purchasing power with regards to houses.
Even as the Fed floods the market with $400 billion in four months, with stocks at record highs, and reality pooh-pooed as irrelevant. What’s different this time? Read... Housing Bubble 2 in San Francisco & Silicon Valley Has Lost its Mojo. Why?
Enjoy reading WOLF STREET and want to support it? You can donate. I appreciate it immensely. Click on the mug to find out how:

![]()
Look at those charts. This is crazy. There are some BIG winners and BIG losers geographically. The percentages from bottom to top are crazy in some areas. We have one very messed up situation with single family housing in this country, and it is not doing the country any good. I have no problem with markets dictating the price, but this is bigger than supply/demand.
Supply and demand on a local level explains it though. So… what?
Not that hard to look at coastal vs heartland supply and demand even for a applicable broadscope. Or rural/city. Where the money(jobs) at?
It doesn’t help to have artificially low interest rates that introduce malinvestment.
Does Chinese money still affect these markets?
“this is bigger than supply/demand.”
When the gvt manipulates the money supply (which in reality means always printing it, to dilute their own and others’ debts), interest rates fall (interest being the “price” of borrowing money, the supply of which the DC master forgers continually increase).
With two *decades* of ZIRP debasement, the gvt has suckered tens of millions of Americans into buying (then going bankrupt in) homes with grossly inflated prices – which are transiently “affordable” because of the ZIRP gutted mortgage rates.
But there are no subsequent buyers at these ZIRP inflated prices – the supply of fools runs thin (even Bubble 2 has only seen sales volumes at about half that of Bubble 1) – and ruined earlier buyers are probably out of the mkt for the rest of their lives.
And the fear of normalized rates (which would be at least double of ZIRP rates) keeps everyone else on the sidelines – because doubled interest rates would probably cause an 75 pct fall in home prices (Bubble 1 saw 60 pct losses before the gvt ruined the dollar to stop the collapse)
Thank God we have government to “stabilize” the crucial mkts in our lives…
Government runs the fed, got it.
If wages increased equally no issue.
It’s amazing how price/wage controls has been so successful.
Refer to the fall of Rome.
The wealth effect of the housing bubbles has created quite a divide.
How about a price/median mortgage rate
to see the impact of rates on prices vs supply and demand.
The Fed fomented massive inequality and turned houses into casino chips, forcing families to move when they can no longer afford the neighborhoods they grew up in or raised their families in. Others are forced to risk their entire financial lives just to afford a home. That’s no way to build a cohesive society.
Either a “cohesive society” is not their goal, or we are just WAY more genius than the Fed think-tank is with their unlimited R&D budget and access to pretty much anything they want. Hey Occam, what’s that thing you always say? Barring better explanations, the simplest explanation is likely the right one? I forget.
Of course they know what we all know, they just don’t prioritize what we prioritize because they are the ones playing chess and WE are not.
The Fed has said that addressing wealth inequality is not its job, even though the Fed creates that inequality through experimental policies. If you say this is irresponsible I wouldn’t argue with you.
Bobber (and others):
When a child I’d go shopping with my mother (SF); for meat we would have fav place to go because in too many “butcher shops” the usually owner/operators have what we called, “….a heavy thumb”. When weighing your purchase hidden from the shopper he would use his (hidden) thumb to press down on the scale and charge pure profit over and above the regular sale price.
That’s what the FED has been doing in the interests of the financial world………..
When basic human needs like housing or healthcare become subject of speculation at the Wall Street casino.. it’s time to get out.
Tyler, are you suggesting that homeowners should get out of their homes to go live on the streets and the sick should stop seeking health care?
Is that what you think he means, “Blockhead”? Or do you think he means, “to as much as possible insulate yourself from this system as much as possible.”
I think the later.
Those graphs show consistent upwards trends in many cities, a levelling off in a few, and a drop only in the SF Bay Area and NYC. Are these two areas harbingers of what is to come nationally, or just anomalies?
I wish I knew.
I had what I thought was a wonderful idea this last weekend. Rather than try to buy a three bedroom townhouse in Cupertino, which I could only afford if I mortgaged my life away, I could go for a two bedroom, which I can afford more comfortably, and buy a class B RV to park in the garage and use as a third bedroom that I could also drive on vacations.
Then I found out that no townhouse garages will fit a 9 ft 4 inch RV. Darn. My hopes came crashing down.
Correction: I guess Seattle is as down as NYC and SF Bay, so that’s three, not two.
Chicago will be next if the current trend in the data persists. We may see this play out over the next few months. But RE in some other cities is booming. For now there is no national trend. For now, everything is local.
Correct me if I’m wrong, but among the cities graphed above only Chicago has the screaming hair-on-fire astronomical property tax and government pensions detonation fuse lit, and they are only in the beginning of it.
Dallas also has high property taxes and public pension funding issues.
Chicago shall go down in flames as reduced pension retirees can’t pay their continually increasing property taxes. Solution: move to lower tax state and have Illinois mail the checks. Sarcastic solution: tax politicians 120% of income.
Nice unit. I have a restored ’81 Westfalia. One of it’s designations is part of our family emergency preparedness plan, although relatives do sleep in it in the summer. Seriously, it is stocked with supplies including vhf and Hf radio gear, fishing tackle, and camping stuff. If the ‘big one’ hits we have a place to stay. No earthquake?, we’ll continue to use it for camping travels. Yukon, this summer. Plus, a Westie will fit into any garage. :-)
Last weekend me and my buddy were passing through Palmdale/Lancaster California heading towards Mojave. On the outskirts of town there are several “Winnebegos” parked in the desert. My buddy was telling me that they are squatters. We passed through there back in September also. The number of Winnebegos is increasing.
Wolf removed the link. It was to a Winnebago Travago.
Er I mean Winnebago TRAVATO. Wolf feel free to delete these posts and anything else I post :)
That Winnebago was for sale, and your link promoted it. Total no-no here. I also shred links to houses-for-sale, etc. If people want to know what a Winnebago looks like (and I understand that this was your intent here), they can google it.
Sorry, I didn’t look closely at the link. I just searched for the model, the first hit looked like a product info page on a quick glance, but I guess it was a vendor site or something. Anyway I have no problem with the moderating you did. Carry on!
Well if you bought in Cupertino last year, you would already be 200K in the hole. Everybody, let that sink in.
Holy Moley, those 2nd bubble levels are high…scary high.
Anecdotal for Vancouver Island suffering from Vancouver housing refugee relocation pressure. Prices rising, rental vacancies non-existent, even storage (mini storage) in short to no supply. Employment opportunities falling and starting to smell, but housing remains unaffordable.
Newly built apartment units rented before construction is complete. In Victoria, no rentals available to speak of.
I just zipped through what I would call a rural crap shack. They had been asking 340K, then 320, 300…finally sold, for how much I don’t know…don’t want to know. My son was stripping out non-conforming electrical for the seller, as a sale condition. There is no foundation, and the living room floor sagged and bounced. That somebody bought it, is unbelievable. There are two acres, of which more than half is underwater due to busy beavers. I would have offered 100K…maybe. I’m sure it went for closer to 300K.
I believe an RE reset will only occur after a recession/depression. These low interest rates produce too much buying pressure and price distortion.
In many (if not most) areas the numbers aren’t quite as “scary high” as Buuble #1 because remember that they are not adjusted for overall inflation. A 2019 dollar does not equal a 2007 dollar since its overall purchasing power has eroded 26% since 2007.
Consumer price inflation is totally irrelevant to house price inflation. Consumer price inflation just takes more money away from the budget to pay for housing. If you want to compare two inflation measures, compare local house price inflation to local wage inflation.
US median income grew about 22% during this span.
Would love to see these charts inflation adjusted.
These charts are inflation charts — that’s all they are: charts of house price inflation. See last paragraph. There is nothing else going on here. So you want to see which is worse, house price inflation or consumer price inflation? That’s all an “inflation-adjusted” chart shows you, which of the two is worse.
Wolf,
I think you need an audio file linked these home price charts that screams, “These charts are inflation charts!!! — that’s all they are: charts of house price inflation!!!”
That would cover the deaf and the blind. There’s probably no helping the dumb, so….
No offence, sc7
Max, if your numbers are accurate-ish 26% overall inflation vs 22% median income growth means the housing numbers are WORSE than these housing numbers show by themselves. No?
Keep your eye on CA, if AG Becerra’s Prop 13 repeal (disguised on the ballot as “Education and Local Government Funding”) is voted in by the uniformed and those who do not own property, property taxes will skyrocket. I suspect many will want to or have to unload, driving down prices.
That proposition only applies to industrial and commercial properties.
Companies are people too!
I read the prop 13 ballot and all it says is that if borrows $15 billion in general obligation bonds to spend on public schools, and it allows public schools to borrow more.
If it repealed prop 13 I’d vote for it in a heartbeat, but I don’t think it does.
As for dumping more money into our school system and allowing them to borrow more … I just see that as another way to siphon money toward the pension system to make up for under-performance from decades of financial repression. I doubt it will do anything to help young families, students, or teachers.
Please don’t propagate misinfomation. The bill affects “industrial” and “commercial” properties only – and it’s about time that was fixed.
Of course, the big money (industrial and commercial property owners) are pouring lots of fear onto the Internet, hoping people will fall for it.
Really? You want to get rid of prop 13? So homeowners can be slaves forever and never “own” their properties? Even for commercial, do you really think all the small restaurants and business tenants can take on a huge increase in property tax expense, considering all the other inflated costs they have and ever rising minimum wage?
Oh the horror! Maybe even the techies can afford a place to call home lol
A manufactured home was built for half the price of a stick built home. A masonry home is more expensive than a stick built home.
Nationwide home prices rose 3.5% YOY in the recent reporting period. This is outpacing the CPI that does not include housing prices.
US stock market prices have grown faster than inflation over the long term. I have an index fund as part of my portfolio that I have been holding long term. I designated other funds for trading.
In Seattle ( where I manage a 32 unit rooming house )
a slew of new laws have made our lives miserable.
I’m not allowed to know/consider a potential tenant’s
criminal history, for example.
Like it or not, leases transition to month-to-month,
a.k.a. “tenant in perpetuity” ( seriously ).
Eviction for bad behavior, and/or not paying
for damages and/or fees, is nearly impossible.
The eviction sheriff knows me well;
ditto for policemen and repairmen.
A young University of Washington student
got pepper-sprayed when he asked
a fellow tenant ( fresh from Ethiopia )
to turn his music down, Sunday night.
When I confronted him about it,
he pulled a knife on me.
The police are useless, in this case,
because ” it’s a civil matter “;
had I called them,
they would’ve shown up 3 days later.
Also, he broke ( yet another ) window
3 days after I fixed it.
He buys and sells stolen goods;
he smokes crack and meth.
Drug dealers come and go constantly;
my room vibrates at 4 a.m.,
as if a dance bar were next door.
We’ve been trying to evict him for months;
he’s extremely defiant.
Catholic charities pay his rent;
the city provides him with lawyers.
Meanwhile, better tenants move(d) out.
Once, one of his homeless friends
spit in the landlord’s face; we called 911,
reporting the attack; they never showed up.
Imagine if you were chained to a lovely lady;
sooner or later, you’d get sick of it.
Hence, “no-fault” divorce.
For similar reasons ( up until recently )
either party could terminate a rental agreement.
Basically, Seattle does everything in its power
to make sure the problem belongs to us,
so it doesn’t have to deal with it.
Call the DEA.
When Seattle police find drugs on such people,
they do nothing… I’ve seen it myself.
The drug-addled perpetrator should’ve been
put in a psych ward, at least — everyone would benefit;
but Seattle won’t pay for it; instead, it’s our problem.
Some guys rack up 40 arrests, and 30 convictions,
by age 20, and then kill innocent bystanders;
it’s a joke for them, they like the attention.
See: William Tolliver, Seattle
Time to sell.
I once worked as rafter rat carpenter (running up and down rafters, as opposed to sideways which anyone can do) for a couple of weeks; did not get paid, so I quit and was paid, per state law, the following Friday; none of the folks still working were paid.
For some reason, all 12 of the buildings, in various stages, burned to the ground that weekend, and then everyone was paid from insurances…
Just saying, NOT recommending any particular actions, or trying to sell anything Wolf!
Analyzing U.S. census data, the report showed that the 5.9 million single-family homes built between 2012 and 2019 do not offset the 9.8 million new households formed during that time. Even with an above average pace of construction, it would take builders between four and five years to get back to a balanced market. CNBC by way of CBBB. Looking at my area, LA/SD B2 has not approached B1. State mandates affordable housing and almost none of it is. Then FED revisits OP Twist, 2011, which is where the bottom B1/B2 rests. Did you think they were going to hold Tbills indefinitely? Bullish on housing and a more sane immigration policy. Mi-ami:Tsun-ami??
Ambrose Bierce,
“…report showed that the 5.9 million single-family homes built between 2012 and 2019 do not offset the 9.8 million new households formed during that time.”
You’re forgetting the building boom in condos and apartments. You’re just comparing new single-family houses to total household creation. Now add the millions of multi-family housing units (apartments and condos) that have been built over those years.
Condo’s are for entry level buyers who when they mature want housing? The case for HB2, Noland sees one big bubble. Homeowners leave low lying areas, waterless deserts, and fire risk zones, stocks back off, insurance reserves drop, companies feel the pinch, cut coverage. It all gets 1970s interesting when things went to heck, but not everything.
Condos are for empty-nesters. Condos are for small families that don’t want to spend hours commuting every day. High-rise condos are for people who love panoramic views and for people in wheel chairs because high-rise condos have elevators and ramps. The median price of a condo in San Francisco is $1.1 million. In Manhattan it’s $1 million. High-end condos sell for tens of millions. Not exactly the fodder for entry-level buyers.
“not offset the 9.8 million new households”
Wolf,
He is also forgetting the excess supply from Bubble 1.
And HH formation may be a lot more flexible than thought – if young people can not find jobs, they stay at home and HH formation craters.
Only to unpredictably recover as jobs become available.
That said, the soaring apartment rents throughout most of the country (see Zumper, ApartmentList, or RentJungle surveys) over the last three years strongly suggests inadequate supply.
The supply has been improving, but not as fast as necessary and not everywhere.
Landlords and lenders are now taking back the pounds of flesh they lost in Bubble 1.
Correct Wolf,,, unfortunately, many of the SFRs have been swallowed up by the PE ( so called private equity, of course using our $$ as explained here ) folks paying cash and asap… we ran into that for the first time in summer 15, when we had to relocate back to TPA bay area to take care of very elderly parents,,, almost all of the really likely good performers/advancers gone within hours ( and, as a former serious flipper in Berzerleley I was very familiar with the process)
Just wanted to be sure that it is very clear the PE folks have dealt this market a serious distortion blow, similar to so many other markets they have distorted in the last few decades after paying their puppet politicians to change laws, codes, and other rules and regulations so that they could do legally what had been done previously without legal support.
Not that I care personally,,, we found a cash deal, and are ”up” about 150% so far…
I can offer some color on the Manhattan residential real estate condo market following it for the 37 years I have lived here. Case-Shiller as Wolf clearly described accurately does not IMO describe the worsening condition of this market at all.
Upper end sales (over $4/5 million) as per Miller Samuel a superb data and appraisal firm calls this part of the market in free fall for many years. Drops of 35% are fairly routine. As you go down in price, the price drops get less to around 10% in what this lunatic market calls reasonably priced ~ $2 million and lower.
The inventory can be counted in years depending if you consider all the new supply being offered, and very many years when you count the new units not being counted that developers hold off showing to keep the supply down relative to the sales. The Wall Street Journal has reported this condition.
For some anecdotal observations around my neighborhood, I have never seen more vacant demolished spaces in large plots that took years, maybe decades to assemble with no construction going forward. This has been going on since at least summer of 2019 and seems to be getting worse. In my own condo there have been numerous open houses every weekend, a first in this building. Speaking to a friendly broker who was trying to buy a unit for herself at a knockdown price to hopefully flip she said business has only proceeded if the seller meets the much reduced offers.
Retail vacant space that Wolf has done an excellent job going over, seems only to be getting worse. In some of the most desirable areas, south of Houston on Broadway in SoHo the vacancies are piling up faster than you can count. Truly getting worse in a fast way, and I am not even counting all the pop-up stores that come and go all the time. The Manhattan real estate market which used to be immune to this is in a very difficult way. And with all this going on there is millions of square feet being added! Hudson Yards, the Westfield mall in the new Freedom Tower area, and many more including the new large off price mall in Staten Island which can’t seem to ever complete with vacant space!
I think I have just painted a much more accurate picture of the real market in Manhattan than Case-Shiller. What will change this with interest rates at ~1000 year lows is not something I can vision. What will happen if and when rates go up?
I am not sure what you are worried about if you owned your apt for more than 30 years, if anything. I did not buy in Manhattan because I preferred to live in the suburbs in a house with a yard for LESS money. At least my city has an EXPRESS Metro North to Grand Central (one stop) and one can chose to live as far NORTH near the border of NY far away from the crowd.
I hope you own your home free and clear and don’t have to worry about mortgage payments. You can view the Property Tax as some kind of rent. All in all, I still believe we’re probably better off than the Average Joe and I don’t understand what the problem is all about. The price I paid for my house 30 years ago was a godsend compared to prices today.
I still read the NYC papers and read a few stories about luxury stores coming to Madison Ave and the 57 St area. One of the stories cited the rent for one store at 35% lower than asking.
Today, I read on the internets that former Fed officials know that the QE has nothing to do with rising stock prices.
Stock prices are rising, the internets, say, because everything is awesome. Stocks are awesome the economy is awesome interest rates are awesome.
Assets bubbles are just conspiracy theories.
That was a JPM analyst, rumored to be the bank which blew up REPO in Sept. YC is not steepening; Fed giveth and taketh (may reinvert). Rumors about a Romney/Warren affair. Can we have fiscal growth with monetary restraint? Or at least pay our bills. https://www.nytimes.com/2019/08/21/us/politics/deficit-will-reach-1-trillion-next-year-budget-office-predicts.html We are heading for crisis, just not the one we imagined.
Haven’t we had deficits at the $1T a year level for 2018 and 2019? What’s the big significance? Any good student of debt knows there are NEW challenges to raising $1T new money in 2020. That’s the real surprise.
In my opinion, this is where the pundits are failing – explaining our options in raising debt. Debt ain’t automatic.
If the next Prez is not an (R), the R party will scream holly molly to high heave if the new Prez has to borrow one single penny and try for a debt limit default, unless we cut SS & Medicare which (un) informed comments here tell is causing the deficits in the first place.
But the (D)’s will secretly love being told this because they support 95% of the same thing the (R)’s do, anyways.
And there will be lots of comments here saying “I told you so it’s all because of SS & Medicare.”
And will start a few more wars or something any nobody will say they cause deficits
Policy is to expand the rate of spending, improve GDP and debt pays for itself. When GDP starts to drop, expand spending, which is where current economic policy is off the rails. USG is only serving old debt. Fed knows the problem, they dropped rates, now the fiscal side needs to kick in. They slammed revenues with tax cuts so we approach a crisis, by way of the “small government” party. Crash the (government spending) system and take a victory lap.
Apparently Phoenix has become the most expensive city to live and drive in. The combination of housing and transportation costs accounts for over 50% of average household income. Not surprising considering the sprawl. Unless of course it’s fake news. So hard to tell these days…
Fake news, at least when wages vs costs of everything needed to live is included…
Hawaii is far and way,,, as in, far shore,, the worst today according to all I read, and my elder son and family in Kauai support this result…
If you measure housing cost as a percentage of income, Los Angeles is least affordable, with the rest of urban coastal California and then the inland parts of CA close behind, followed by the urban northeast. The rest of the country is far more affordable, Phoenix is not in the top 20 by this measure. The monthly housing costs range from several thousand to several hundred dollars, a vast range, almost 10 fold from least to most affordable.
Transportation costs by comparison are much lower and less variable, ranging from 500-1,000$ monthly, and the metro areas with highest costs are small metros like Greeley Colorado that are really spread out or far commuter towns like Vallejo in the Bay Area. NYC is the most affordable for monthly commute on average.
California cities fair worse than most other states for commute costs because the cost of gasoline is substantially higher, and because some metros there have especially long super commutes. Phoenix is not top 20 on this measure either.
Here’s the suspect chart.
https://usa.streetsblog.org/wp-content/uploads/sites/5/2020/01/Housing-and-transportation-affordability-as-a-percentage-of-income.png
That data is from 2016….. A lot has changed in 3 years.
As far as Phoenix goes, I wonder what impact the retirees living on fixed income have on that data. If they’re living off SS and savings, their income figures will be skewed even though they may have no mortgage and significant assets.
Wow, IOR/IOER raised to 1.6% from 1.55%.
Why would the banks lend lower?
Thanks. This confirms why my son is going nowhere fast in NYC. He loves his job though. Everything he earns goes to rent, food & booze, and subway rides.
Fed extends timeline for it’s not-temporary, temporary Repo operations which is a not-QE, QE program.
No it didn’t. Powell gave us a clearer idea what will happen: Repos will come down, T-bills will go up, MBS will come down. He gave a lower limit on reserves ($1.5 trillion), now surpassed. Sometime during Q2 (which starts Apr 1), this show is likely to end, he said.
Yup. Yield curve has inverted again for 1, 3, 6 month bills vs 10 year.
Wolf this is my fave thx for the update
I think this analysis is telling me to do a bunch of zero down investing in hot markets right now, which I’m doing aggressively as it’s so easy to get cheap financing. Closing on two Miami condos next week with offers on four more.
My experience on the ground in Charlotte matches the C-S numbers. Since I moved here last year there have been multiple new downtown (“uptown”) high rise office buildings completed and/or started.
Driving main arteries through the some of the “good school district” parts of town to downtown you can see what were formerly acre lots being frantically parceled in 2-4 new lots, soon followed by 4000+ sf McMansions sprouting like mushrooms. Gaudy, out of place architectural styles (Mediterranean villas, lol), sometimes attached… Million $ glorified townhouses; who would want to live in that?
“Million $ glorified townhouses; who would want to live in that?”
Same people as Bubble 1 – McMansions for McMorons.
Was hoping to see a graphic of Hawaii our little market. Great work!
Unfortunately, none of the 20 cities in the Case-Shiller index are in Hawaii. Texans have complained for years that only one of their huge metros is included in the Case-Shiller :-]
Wolf,
The Shiller Index is very limited in terms of the number of metros covered.
Might I suggest an imperfect housing mkt status proxy…the various apt rental mkt surveys (Zumper, ApartmentList, and RentJungle for historical data).
Each has a minimum of 100 measured metros.
Home buying is a creature unto itself but median rental stats do provide *some* insight into local housing mkt status and trends.
Cas127,
I regularly cover the rental market separately, using Zumper’s data. This also includes a searchable list of the 100 most expensive markets. Here is the last one:
https://wolfstreet.com/2019/10/31/apartment-rents-fall-in-25-markets-including-southern-california-seattle-miami-san-francisco-san-jose-chicago-honolulu/
Thanks for the article it answered the question why are Household Debt here https://fred.stlouisfed.org/series/TDSP so low relevant to other periods. Lending is stricter not.Yet look at housing starts here https://fred.stlouisfed.org/series/HOUSTW and you see a rather gentle upward slope as in 1992-2002. We haven’t reached the 500,000 level in new starts yet but even then there was a 3-5 year window at the “magic” 500 level before the market tanked.
It maybe we are in a digestion period for prices at this time before we move higher as in the 91-2006 period.
So sorry about the punctuation errors in the last post. Insanity price appreciation was the run Japanese RE did in the late 80’s where the Emperors Imperial Grounds were worth more than the RE of California combined. I would add that I was waiting for a major city RE market to run 100% in one year in the 2006-2008 period. Las Vegas was the closest at plus 50% in 1 year. So I would look for the metro market that meets or exceeds that level in a 1 year period. So far I don’t see it.
It may not show in the chart yet, but Seattle appears on the verge of another large up tick, market has been very hot through the fall and winter and inventories are falling. Starting to feel like it did a few years back. The slowdown lined up with raising rates and now that rates are WAY down demand seems back.