Price gains down to trickle in Chicago. Red-hot Dallas slows. Charlotte & Minneapolis surge. Crushed Detroit and Cleveland hit new highs.
Housing market dynamics are local. Just how much they differ from market to market is depicted by the 20-city CoreLogic Case-Shiller Home Price Index. I divide these 20 markets into two parts: The Most Splendid Housing Bubbles in America, where home prices have more than doubled since January 2000, and in some cases nearly tripled; and the remaining markets where prices have not yet doubled since January 2000, including markets that had been totally crushed and, while up in percentage terms, remain relatively low.
Chicago House Prices:
In the Chicago metro, prices of single-family houses rose 0.4% in July from June, and were up 1.6% from July last year, according to the CoreLogic Case-Shiller Home Price Index for Chicago which is comprised of the counties of Cook (includes the City of Chicago), DeKalb, Du Page, Grundy, Kane, Kendal, McHenry, and Will. The index remained down 13% from the crazy peak during Housing Bubble 1:
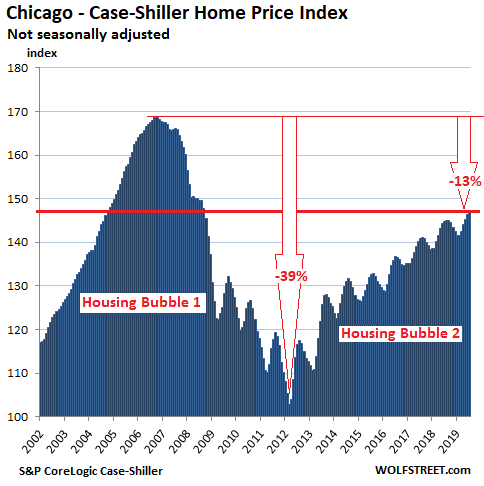
The Case-Shiller Index was set at 100 for January 2000. Chicago’s peak index value of 169 during Housing Bubble 1 indicates that house prices had risen 69% between January 2000 and September 2006.
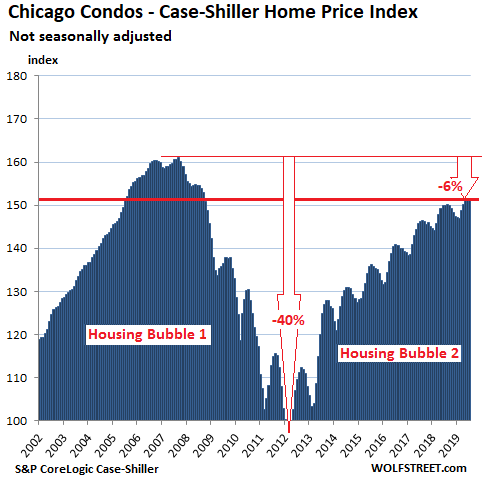
Chicago Condo Prices:
Condo prices in the Chicago metro declined a tad in July from June, after having been flat in the prior month. This further whittled down the year-over-year gain to just 0.7%:
The charts here are on the same scale, with the vertical axis going from 100 to 180. This makes price moves easier to compare from market to market. The exceptions are Dallas and Detroit: Dallas because the house price boom since 2012 has overshot 180 by a wide margin; and Detroit because the plunge during Housing Bust 1, from already low levels, has pushed the index far below 100.
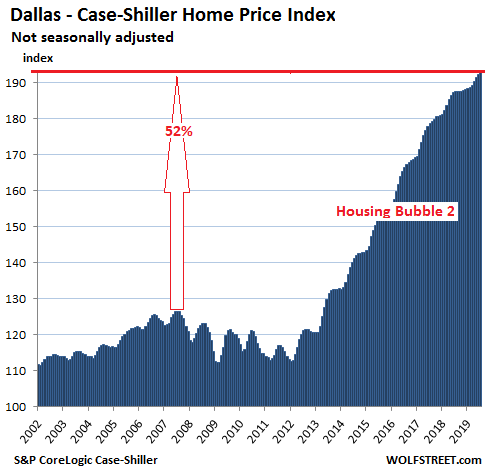
Dallas-Fort Worth House Prices:
The Dallas-Fort Worth metro – the counties of Collin, Dallas, Delta, Denton, Ellis, Hunt, Johnson, Kaufman, Parker, Rockwall, Tarrant, and Wise – managed to miss the full beauty of Housing Bubble 1, and so also missed the full beauty of Housing Bust 1. But since January 2012 house prices have skyrocketed by 71%!
Over the past 12 months, the pace of the increases has slowed. In July, the index ticked up 0.2% from June and was up 2.7% over the past 12 months. This compares to 12-month price increases in the 5% to 10%+ range between 2013 and 2018:
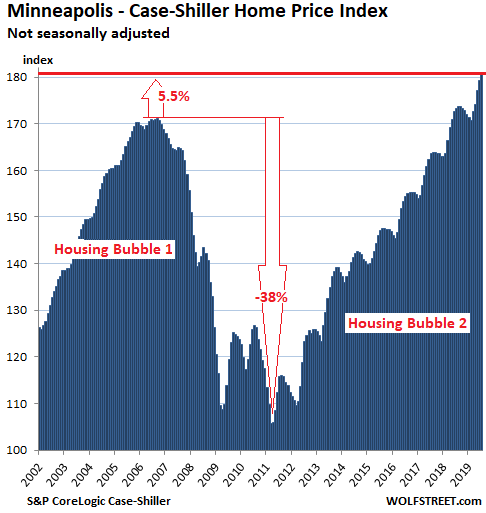
Minneapolis house prices:
House prices in the Minneapolis metro rose 0.7% in July from June, and were up 4.2% year-over-year. Note how Minneapolis and Chicago ran in parallel through Housing Bubble 1 and Housing Bust 1 but have diverged afterwards: Prices in Minneapolis are 5.5% above the peak of Housing Bubble 1; prices in Chicago are 13% below the peak:
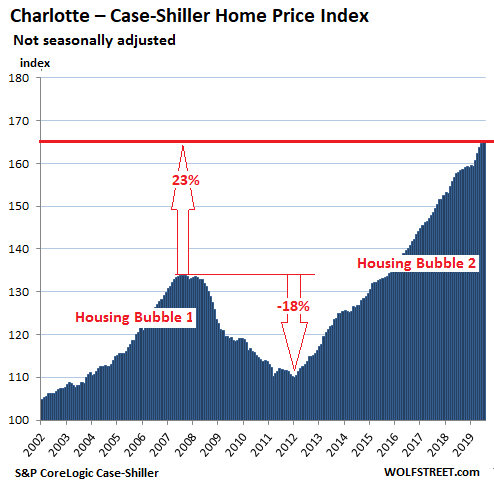
Charlotte house prices:
In the Charlotte metro, house prices rose 0.3% in July from June and were up 4.6% year-over-year, continuing a relentless price boom that started in early 2012:
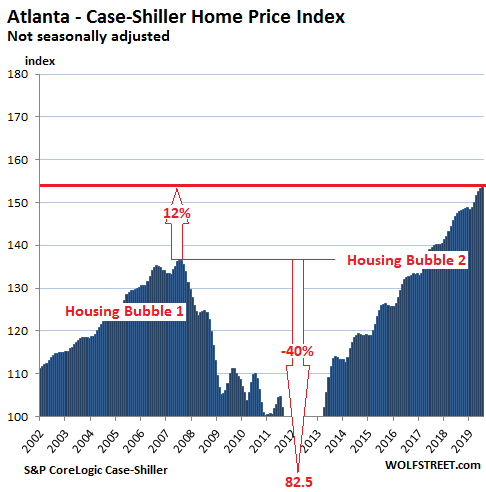
Atlanta house prices:
House prices in the Atlanta metro barely budged in July (+0.09%) compared to June. This reduced the year-over-year gain to 4.0%. While still a large, it was the smallest such gain since September 2012, when Atlanta emerged from Housing Bust 1.
In the Atlanta metro house prices plunged 40% during Housing Bust 1, with the Case-Shiller index hitting a value of 82.5 by early 2012, a value first seen in 1996. Note the larger amount of white space compared to the above charts, which are on the same scale (except Dallas):
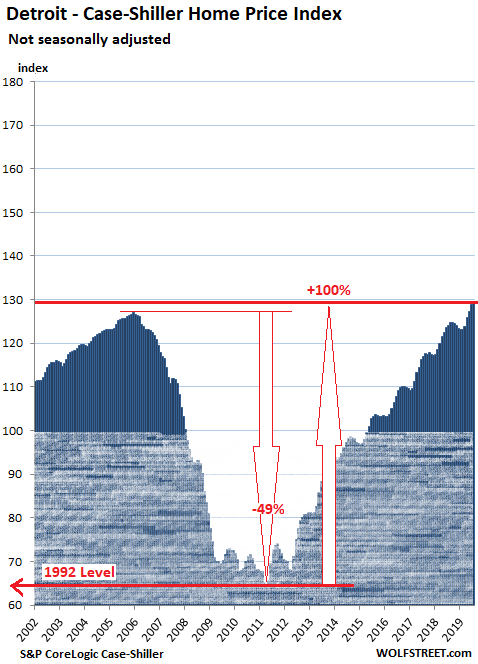
Detroit house prices:
House prices in the Detroit metro ticked up 0.2% in July from June and are up 4.1% year-over-year, hitting an all-time record for the third month in a row, now 1.7% above the old high set in December 2005. The Detroit metro is comprised of the counties of Lapeer, Livingston, Macomb, Oakland, Saint Clair, and Wayne (includes the City of Detroit).
During Housing Bust 1, this housing market collapsed from already low-ish levels to levels first seen in 1992, which included a total collapse of the housing market in the City of Detroit. To show how far prices plunged, and to what extent they have soared since then, I have extended the scale to where it starts at 60 instead of 100 (value in January 2000), marked by the shaded area. The index has doubled in less than eight years since hitting bottom:
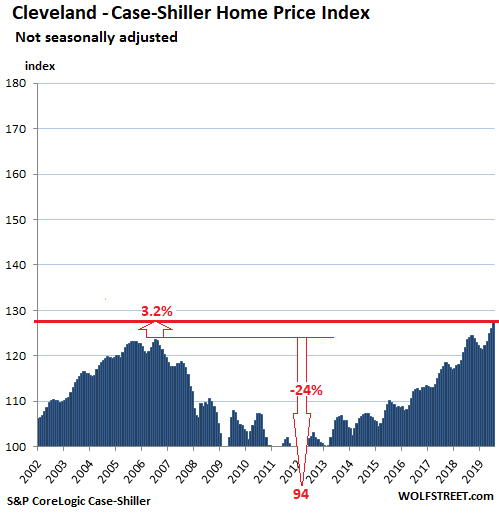
Cleveland house prices:
House prices in the Cleveland metro rose 1.1% in July from June and were up 3.2% year-over-year, setting a new record for the third month in a row, now up 3.2% from the old record set during Housing Bubble 1 in 2006. Since January 2000, the Case-Shiller Index for Detroit has risen 27%, which was, in our era of housing bubbles and bust, smallest such increase among the 20 metros covered by the Case-Shiller Index:
By comparison, the record biggest and fastest price increases among the 20 metros in the Case-Shiller Index is held by the Miami metro, where prices in the span of six years — between January 2000 and December 2006 — skyrocketed by 193%, before collapsing. The record for price increases between January 2000 and July 2019 is held by the Los Angeles metro, where prices over the 19-year period increased by 186%
Seattle house prices fell year-over-year for the third month in a row. New York condo prices have been flat for 24 months. San Francisco Bay Area prices have been flat for 12 months despite all the startup millionaires. Los Angeles barely ticked up from a year ago. Other metros had larger gains. Read…The Most Splendid Housing Bubbles in America, Sep. Update
Enjoy reading WOLF STREET and want to support it? You can donate. I appreciate it immensely. Click on the mug to find out how:

![]()
what about Seattle?
Different article
Top entry in the prior article about the MOST Splendid Housing Bubbles…
https://wolfstreet.com/2019/09/24/the-most-splendid-housing-bubbles-in-america-september-update/
If news reports that the Fed is now implementing term repos for the first time since 2009, has had to lend the banks up to $400 billion total thus far, and now has overnight repos of $160 billion per night, are right, will this not collapse RE markets? See https://www.wsj.com/articles/fed-adds-75-billion-to-financial-system-in-latest-transaction-11569416576
The banks will have to reduce their holdings and stay liquid if there is a liquidity crunch. Thus, they will be less willing to lend for RE loans to purchase homes. Also, the unwillingness to lend to fellow banks except at inflated interest rates (which is the root cause of the need for the repo subsidies of the Fed) means a dire economic event may be on its way.
I’m leaning towards agreeing with others who have questioned weather it is appropriate to refer to current housing prices as “bubble 2.” Because, now that we can see Super Ultra Dove Deluxe-ism has an iron grip on the Fed, which appears may be slowly normalizing the lower bound or negative rates – it’s not a bubble. It’s a new normal?
Still a bubble, just might inflate to a bigger one… which means a bigger pop when it finally goes.
sc7 – This isn’t a bubble because there are clear fundamental drivers behind this housing recovery. Interest rates, unemployment, and inventory are all at historic lows and these factors are very favorable for real estate.
Now that we know the future is negative mortgage rates, housing might double or quadruple again over the next 20 years.
Lending standards are also very tight this time around.
I’d say it’s a bubble, but one that will be popped politically rather than economically.
The central banks will do their best to ensure a world of high asset prices, with a side effect of ever more concentrated asset ownership, increasing numbers of people being marginalized or excluded from our economic system entirely, and heightened public rage.
Political change is a big roll of the dice as it can take many forms, but the pressure is being felt. I really think people stretching to afford today’s housing prices will find they have little to no equity in 10 years, assuming their jobs are stable enough to keep up with the hefty payments.
Herb Stein ‘What cannot go on will stop’
Here’s why I think this is a bubble: I’m in the Bay Area renting a house for 50% more than I was paying in CT before moving to CA (the house in CT was also twice as big on a lot ten times bigger). I’m making a little more in CA but nowhere near 50% more. So based on a reasonable tech salary, I’m stretching to live here. But if I wanted to buy the house I am renting, my monthly payments would be 3 times my rental amount. There’s no way any regular couple can afford that. The disconnect between house prices and salaries is why I consider this a bubble. Sure there are the occasional iPod millionaires but there is a ton of foreign money and a lot of people making irrational decisions that if they don’t buy now they will be priced out forever. I just don’t understand who these people plan to sell their house to eventually.
Josh:
“….. just don’t understand who these people plan to sell their house to eventually.”
“Unicorn Babies”…..LOL!
FYI – Delta county Texas has a population of about 6,000 people. Not sure anyone really considers it part of the DFW Metroplex.
More like a bubble, it varies so much city to city it might as well be bubble warp. Pop a bubble in a city? No worries there are more bubbles!
Wolf, what it would take for a huge crash? Hidden debt?
Location, location, location.
The bubble will pop outward, instead of inward.
It will deflate in real terms, but inflate in nominal.
So if your house is worth $400,000, it may be worth a cool $1,000,000 in 10 years.
However, a burger will cost $50 instead of $5, so go figure if it’s that cool after all.