We’re overestimating growth, thinking of it as heading towards low growth. In reality, we’re heading towards negative growth, once adjusted for inflation.
By Stephen Punwasi, Better Dwelling:
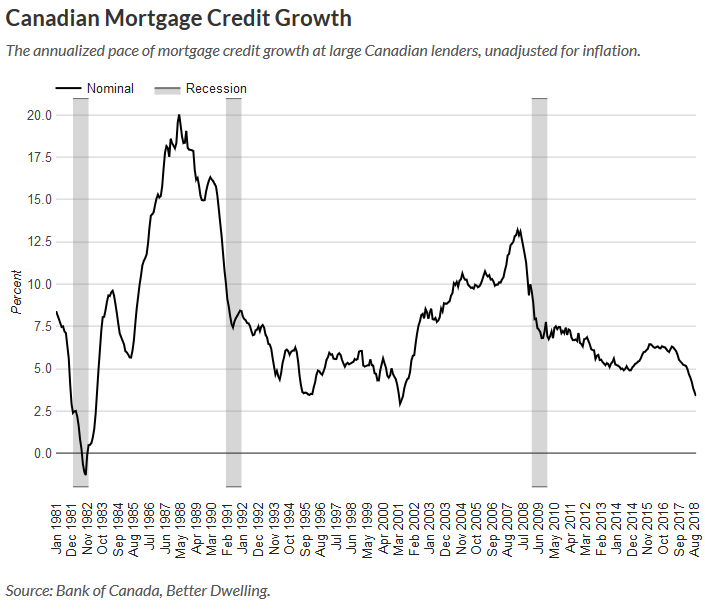
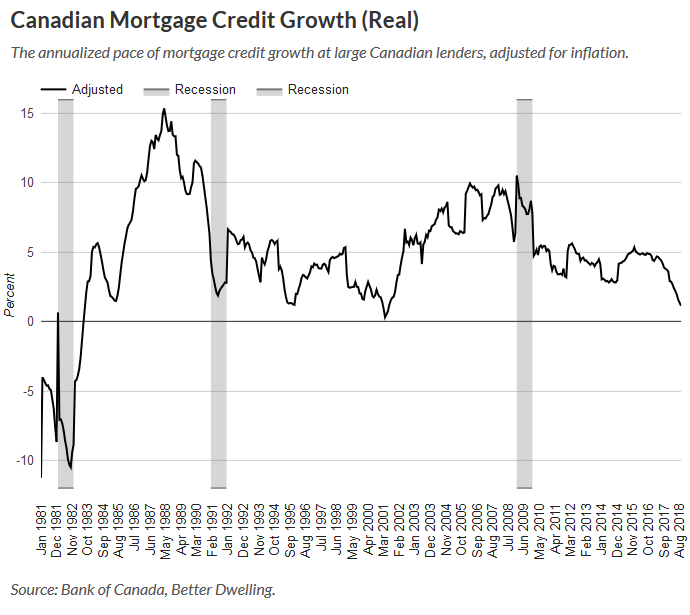
Canadian mortgage credit growth is falling, but how bad is it in real terms? People are comparing today’s low growth numbers to the mid-1990s. While there are some parallels, it more accurately resembles the early 1980s. Mortgage credit growth, when adjusted for inflation, is heading towards negative numbers. We haven’t actually experienced negative real growth in over 30 years.
Why Real Mortgage Credit Is Important
In order to more accurately observe trends, analysts will sometimes inflation adjust dollar amounts. Inflation is the decrease in power of money, caused by rising or falling prices in goods. Inflation tends to obfuscate the true trend over long periods of time. Did the currency go to s**t, or did we see a behavioral change? Was it low growth, or negative growth? To get a better picture, it’s sometimes (almost always) useful to adjust for inflation. When numbers are adjusted for inflation, they’re called real numbers.
Looking at real numbers allows us to observe the trend, without the distortion of currency value at the time. This is particularly important when looking at the early 1980s for Canada. During that period, inflation was totally out of control. Today we often think of that period as low growth, with a brief negative contraction. In actuality, it was a very large contraction in real terms.
Okay, no one thinks about the early 1980s rate of credit growth, but some of you should!
Canadian Mortgage Credit Growth Is Over 3%
Canadian mortgage credit growth is pretty weak when looking at unadjusted numbers. The annual pace of growth fell to 3.4% in September, down 38% from last year. This is the lowest pace since June 2001, and on target to head lower according to recent performance. It’s low growth, but at least it’s not negative is what most are thinking.
Real Canadian Mortgage Credit Growth Is Almost 1%
When adjusted for inflation, the picture is getting a little more dreary for lenders. Real mortgage credit is at 1.14% growth in September, 71% lower than last year. The rate is falling at nearly twice the pace most people are expecting. Real credit growth hasn’t been this low since 2001, and even then it was only this low for 4 months.
The low growth will most likely to turn negative, considering the current trend. In 2001, the last time real credit growth was this low, interest rates were slashed to stimulate growth. That helped reverse the downward spiral after 4 months. Today, that’s not on the table.
The Bank of Canada’s most recent hike occurred less than a month ago. Typically, the bank’s own research shows it takes between six and twelve months to adjust to a policy hike. The full impact of the hike won’t be felt for another half a year at least. The bank is also on the path to rate normalization, which means the policy rate needs to rise another 42%. That four month window in 2001 is probably looking pretty good to lenders right now.
We’re currently overestimating growth, and thinking of it as heading towards low growth. In reality, we’re heading towards negative growth, once adjusted for inflation. That includes the record amount of immigration we’re trying to use as credit growth stimulus. By Stephen Punwasi, Better Dwelling
A massive survey of recent homebuyers reveals all. Read… Foreign Buyers Made Me Do It: Canada Reflects Back on its Housing Bubble
Enjoy reading WOLF STREET and want to support it? You can donate. I appreciate it immensely. Click on the mug to find out how:

![]()
What’s with the graph’s crazy time scale?
Four years (1981, 1992,2003, 2014) have 2 data-points – the other 34 years have a single data-point.
Data-points for a given year are not from the same month – different years use different months to represent the full year (presumably there is some seasonality).
Grade on real estate data graphing: F
I disagree. Those years had some ups and downs that would be missed if not shown. 81′ for example goes from below -10 to above 0 to below -5 in one year.
It may not be necessary but it is interesting information.
No.
The macro point being made by Punwasi in the article is probably on-target because the Canadian mortgage trend (which IS NOT GRAPHED IN THE ABOVE ARTICLE) is really that dramatic. Ok, point taken.
However, speaking as a retired CFO (used to both data & cherry picking), if you have years indicated by an individual month, and the collective 34 data-points contain all 12 months of the year, you don’t have a trend analysis, you have a set of cherry-picked events.
Prairies, to your point, I would suggest starting with a graph of each month over the 38 years, with some technique of smoothing (regression, trailing-12-month, trailing 6-month, etc)
It may indeed be of interest to discuss a couple cherry-picket data-points, but generally speaking, you need a trend analysis to identify the cherry-picked “outliers.
Javert Chip,
Only sightly “crazy time scale,” the way it looks, but in fact, all data points are 11 months apart.
This is a common spreadsheet thing when you let it choose the scale automatically. The scale has one data point every 11 months. So Jan 1981, Dec 1981, Nov 1982, Oct 1983, Sep 1984… Each time the first data point falls on January, the next one falls on December, and in those years (1981, 1992, 2003, etc.) you have the appearance of two data points in the same calendar year. But in fact, they’re all 11 months apart.
Understood (I’ve done the same goofy thing…plus quite a number of others).
Data points are not “cherry picked”. In fact, upon closer inspection, the graph has many more than 38 data-points, so I understand graph supports the mortgage-meltdown story with 38-years of wobbles & wiggles.
///
Thanks for the article, very informative. I hope you don’t mind a line or two of criticism.
///
When the graph has an endpoint that is of relevance, but the grid lines are too far apart (5% in our case), it would nice to place the final/most recent value on the chart itself.
///
A sentence or two on what and how to understand what “Canadian Mortgage Credit” is, where is it measured and who measured it would have been nice. Have in mind there are economics amateurs reading these articles, like me ;)
///
Dr. Alan Greenspan & Dr. Ben Bernanke are Economics amateurs too but at least you are reading wolfstreet for clues which automatically makes you smarter than Alan Greenspan & Ben Bernanke IMHO.
Canadian Mortgage Credit is determined via formula and past credit history. Money & the ability to fog a mirror are key determinants to ownership. Heck, if you have money the banks don’t really care if you can fog a mirror.
MOU
What’s US mortgage credit growth doing? The point of the Fed rolling off MBS is moot if new MBS is created, but if mortgage growth stumbles then the largest source of private credit? is actually contracting. That scenario has some interesting implications, when new USG bonds replace (or crowd out) private credit the prospects for growth are impaired. Government has more trouble raising revenue, more bond buyers have fewer choices, and rates fall. While QE was one GSE holding impaired securities, (OFFBALANCE SHEET) QE(everybody) means we all hold the bad paper, incl Wall St crybabies, who suddenly cannot collateralize enough to move the squirrel cage higher.
I had to drop off something down Island today and listened to talk radio while driving. It was on Vancouver RE. Apparently, Van RE sales listing prices and completion rate is now at #46 for luxury units for sale world wide, just behind Istanbul. Luxury defined was stated to be 3 mil plus, (if memory serves me right). Units at 3-6 million Cdn $ have dropped into the toilet, not being sold at all…no offers despite numerous price reductions. In some cases prices have been reduced 50% in one year.
Of course luxury units most likely do not need a mortgage if money laundering and money refuge is in play. Apparently, crackdowns have really put the brakes on this sector.
The expert shook a cautionary finger at those still holding on; those depending on price increases for retirement funds. I believe the implication was, “Rots of ruck”.
“We’re currently overestimating growth, and thinking of it as heading towards low growth. In reality, we’re heading towards negative growth, once adjusted for inflation.”
Again, this is the mistake most economists are making. They are assuming we’re still living in a normal economy with normal price discovery mechanisms etc. Any semblance of normal was thrown out the window with central bank distortions throughout the markets. There will be implications for years, perhaps decades to come. QE will ultimately prove to be an abysmal failure because it is just a wealth extraction/transfer mechanism. You can’t throw trillions of taxpayer dollars at a corrupt system and expect pleasant, benign results.
CANADA’s housing portfolio is far too skewed bimodally between the high end mode of Vancouver & Toronto and the rest of the country. If speculators garnering hot money out of the excesses of mainland China and their hemorrhaging Central Bank actually had their way we would see Chinese hot money launderers buying up the entirety of the high end RE in CANADA which is a National Security Risk that I am not willing to allow room to operate.
CANADA’s BofC is looking long term to attempt ushering back in rate normalization as are all the Central Banks in the entire Western Banking System.
After a decade of QE following two full decades of Greenspan Puts we need to slow down the RE market and legislate regulation with teeth to prevent the speckers that emanate out of mainland China from taking over our housing portfolio via leverage out of their current Late Stage Ponzi Capitalism whereby their own housing portfolio is considered to be nothing more than a Potemkin Village & façade of real markets.
China’s hot money laundering is problematic for the USA too. Frankly, it is better for system stability if we get tough with the speckers & hot money laundering circuits.
China’s finance largesse is triple that of the USA & EU. China is a direct threat to National Security when it comes to their purchases of RE with contraband dollars.
MOU
This. The US critics always talk about how the US exchanges worthless FIAT dollars for Chinese goods. Who’s the fool though when those US dollars are used to buy US real estate? China is winning, beating the US at their own game.
I’m very please to learn that Canadian real estate (RE) markets have been melting down and in the bubble bursting for the past one+ year. I live in the GTA (Greater Toronto Area) and have seen phenomenal prices hikes in the RE around here for the past five or six years. The results are that housing and even renting became very un-affordable for many people here comparing to real income of people. I am welcome substantial drop in RE as much as 70% of the current prices.
An old bungalow home in a working class neighbourhood such as Scarborough where it’s about 15+ km east of Toronto is listing at CAD 700-800K where the majority of the neighbourhood have been occupied by immigrants from India, Jamaica, Afghanistan, Bangladesh, Nepal and Philippines. To me, those old 70+ years bungalows in working class Scarborough should be listed at around CAD 350-400K… LOL
The point about trying to sustain ‘growth’ through low-quality immigration is of immense importance.
Everyone’s trying it – even the little tiny Basque Country is in on the act these days, much to the consternation of the citizenry who ask how unskilled Africans and Gypsies can really be needed or useful, and reasonably point to the 37-100% unemployment levels among the new arrivals, and certain unfortunate social aspects which we all know well.
Of course, governments can’t be candid and explain that the immigrants don’t even have to work in order to fulfill their function: which is to maintain – merely by their presence – the illusion of healthy demand for basic goods and services.
A foolish policy, of course, but this is the era of grasping at straws.
Cynic
Well, call me skeptical…
You say:
1) low-quality immigration
2) unskilled Africans and Gypsies
3) 37-100% unemployment levels …lead to…
4) the illusion of healthy demand for basic goods and services.
I’m not buying that’s the grand plan. Most of those immigrants simply want to get out of the shit-hole countries (Trump’s accurate words) they come from.
– What I would like to see is the growth of total canadian credit growth. That gives me a better insight what’s happening with the canadian economy.
– With mortgage debt growth slowing (e.g. in Canada) it’s a signal the canadian economy is/could be already in a (deep) recession.
– Those who have studied/followed the work of one Steve Keen knows why the rate of credit growth is so important.
I live in Toronto, and there is a myriad of data about the housing market, with numbers upon numbers proving that the market has
‘stabilized’. And it did – at ~50% volume for single family homes vs. the 10-yr. trend. Look at the number of SFH sales in Toronto over the past 11 years (for the Jan – Oct period). Some of the buyers did move to “cheaper” condo market, but even including all the dwelling types would result in ~30% loss of volume. Can one imagine an automobile market where sales volumes of family cars/SUVs drop by 50% and including those people whi moved to mopeds, still the overall vehicle sales dropped by 30%? Carmageddon, I guess. Or the prices go down.
Sales (Jan-Oct)
Year All SFH %SHF in the Mix
2008 27788 9794 35%
2009 30649 11151 36%
2010 30881 10818 35%
2011 31971 11098 35%
2012 29668 10702 36%
2013 29556 10505 36%
2014 31915 11198 35%
2015 33568 11124 33%
2016 33950 11028 32%
2017 25934 7841 30%
2018 23135 6565 28%
Numbers from toronto.listing.ca
Is that tax aimed at foreign investors just a Vancouver thing, or something broader? I wonder where that blocked FI money will land, if not in Vancouver.
Blocking foreign investment has been happening in Toronto and Vancouver for over a year now. The speculators claimed foreigners weren’t to blame but it seems rather odd that all the money left those cities and went to Montreal and Ottawa not long after the tax was applied. Montreal and Ottawa don’t have that foreign tax but I have seen a few news articles pop up that Montreal wants to tax the foreign investment to cool the sudden heat wave in housing.
FWIW, I just got one of those flyers from my friendly neighborhood realtor here in Portland Oregon, on which they list the lates listings, pendings and sales for the neighborhood. Almost all of the sold homes went for less than list. About 7.3% less, on average (for the 10 listings).