Treasury yield curve survives rate hike upright. Yield curves steepen in China, Japan & Germany. Era of NIRP scheduled to end.
The Fed raised its target range by a quarter point on Wednesday, but had already been completely baked in: US Treasury yields barely budged. And the “yield curve” – that monster that tends to “invert” late in the rate-hike cycle, where short-term yields are higher than long-term yields, which tends to be followed by recessions or worse – hasn’t inverted yet because long-term yields have risen in parallel. That was not a given two months ago.
The chart below shows the yield curves on September 28 at the close (red line) and on December 14, 2016, when the Fed got serious about raising rates (blue line). The red line has “flattened” compared to the black line, especially from the 2-year yield on out, and the 24-basis-point spread between the 2-year and the 10-year markers has shriveled to 24 basis points, from the 127-basis-point spread on December 14, 2016:
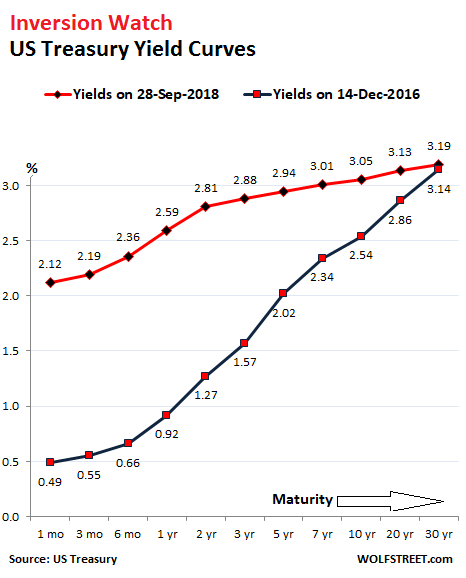
While the Fed has succeeded in pushing up shorter-term yields, the effects have been less and less the longer the maturities get, to where the 30-year yield hasn’t budged at all since December 2016.
The Fed leads, other central banks follow – and markets expect it. The ECB is now gingerly communicating that future rate increases are coming, that the era of QE will end this year, and that the era of NIRP (negative interest rate policy) will end next year. Even the Bank of Japan is making noises about giving long-term yields – which it specifically controls via its “yield curve targeting” model – more room to move; and its negative short-term yields are under pressure from Japanese banks.
As a result, in both NIRP bailiwicks, long-term yields have started to rise, even as short-term yields remain locked in place for now, and yield curves have steepened.
Dancing the global yield curve tango?
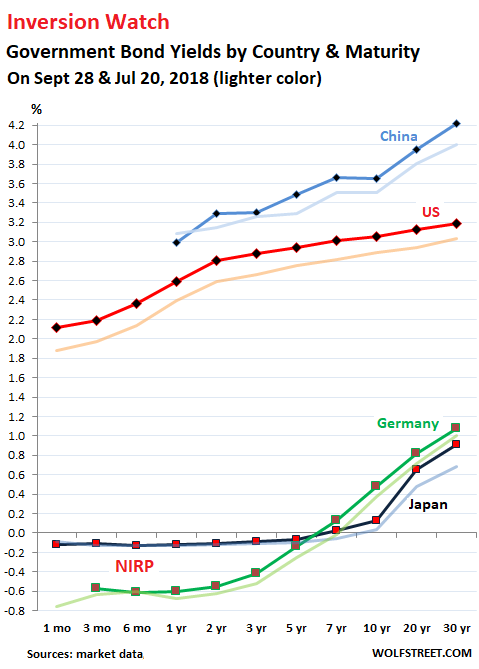
The chart below shows the yield curves of the four largest economies. Yields on September 29 are in brighter colors and the yields on July 20 are in washed-out colors. Note that all longer-term yields have risen, even in Germany and Japan where short-term yields are still cemented into the NIRP absurdity:
Some observations:
In the US Treasury market (red line), the entire yield curve has risen in near-parallel since July 20, with all yields rising by similar amounts. This is what has kept the yield curve from inverting when the Fed’s move pushed up short-term yields.
In the Chinese government bond market (light blue line), the yield curve has steepened, as the 1-year yield has inched down since July 20, while all other yields have risen. Chinese 30-year yields are now at 4.2%.
Japanese yields (dark blue line) for maturities up to 5 years are totally flat and a notch below zero. Then they begin to rise, turning positive at around 6 years. The 7-year yield was still negative on July 20 (-0.01%). By Friday it had risen to positive 0.024%. The 10-year yield has risen to 0.13%. And beyond it, the curve steepens sharply. The entire JGB market is under iron-fisted control of the Bank of Japan, which owns nearly half of them, and we can assume that the yield curve is exactly where the BOJ wants it with its “yield curve targeting.” Nothing is allowed to happen by market forces, which have died.
German yields (green line) are now positive from about 6 years out. A month ago, the 7-year yield was still negative (-0.025). By Friday, it had risen to positive 0.124%. But short-term yields remain deeply mired in the negative, thanks to the ECB’s NIRP, with the 3-month to 2-year yields hovering around negative -0.6%.
The ECB’s QE is scheduled to end in December, and NIRP is scheduled to go on the chopping block next year. The Fed has been “removing accommodation” since December 2015, albeit at a glacial, or rather “gradual” pace. Even the BOJ, despite declarations to the contrary, has been sporadically dialing back its QQE program. Markets might still be in denial, and the way back to some sort of normalcy, if that’s the right word, will be long and arduous, and might never quite get there, but it would be a start.
The US is “on an unsustainable fiscal path, there’s no hiding from it,” explained Fed Chairman Jerome Powell at the press conference, along with some other key concepts. Read… The Fed’s Not Backing Off: Powell’s Standouts & Zingers at the Press Conference
Enjoy reading WOLF STREET and want to support it? You can donate. I appreciate it immensely. Click on the mug to find out how:

![]()
The old “new normal” is history, the “new, new normal” is on the stove heating up. Meanwhile, on the other side is my pot heating oil and kernels,..just waiting for something to POP !
There must be some correlation between the yield curve inverting in a rising rate or a falling rate environment. Seems like the US yield curve tends to flatten faster when rates are dropping perhaps only because the rate hike program is a constant, not a market variable.
The normal process of getting to an inverted yield curve, prior to all this NIRP and QE, was a collapse in long term interest rates.
Germany and Japan look like a couple of sea creatures trying to keep their heads out of the water.
Or a couple of sea creatures lucky enough to be underwater. They are getting paid to borrow money. I still find this incredible. I don’t really understand why anyone would do that when they could simply hold the cash in a bank and earn, admittedly, very small interest.
As far as I remember for EU, the ECB set deposit rates with it lower still. Banks also use bonds to park their money so they come out slightly less negative than on deposit with the ECB, plus the ECB has been buying up national debt at a set ratio between EU countries to bring yields down… some go negative for that “but its ok” because as yield sinks negative it just means their price has increased… a profit for banks or investors who hold them as long as they have a buyer of last resort. I expect many banks plan to hold to maturity as AAAAAAA assets etc. so they aren’t even bothered too much if prices go down later … not sure. This is maybe going to be something to watch if/when rates rise – how EU extracts this basically unreal accounting . Maybe they will buy up negative yielding debt as prices of it lower ( works inverse to yield) , letting banks roll in new positive yielding debt… I am guessing… equally with the size of the ECB balance sheet now they will just hold a short press conference and declare ” sorry folks, we won and its all ours”, who knows. Negative yields is just a government deal though, in real world for the average slob they are always positive, even though there were a few unique contracts that went negative somewhere once in some small corner ( if I remember).
I guess the moral of the story is government good with lots of money, ECB good with lots of money and helping debtors keep EU intact by turning them into savers for borrowing, EU good by making sure owners of wealth don’t lose it all ( except for Greece and Cyprus but it’s their fault anyway (/s)) Everyone else has had a ten year view of the drain as they circle it, just as a small reminder what happens if they don’t respect someone who has “flush” written on their wallet.
Well, that is exuberant Europe for you, a novel account of pressing concerns over how to fit into a common size and profit from the experience… only bankers and politicians need apply, the rest are only there to show their level of gratitude.
Wolf,
Don’t you think that the FED’s unwinding or QT (quantitive tighening) has caused the yield curve to steepen or at least stay the same this time around? October 1, 2018 the unwinding should be accelerating, correct? Aren’t the selling of 2s and 10s (besides MBS) pushing up long term yields? Wouldn’t that have a stronger impact on long term yields than the effective federal funds manipulation, which appears to have a strong correlation on the 3month T Bill?
Lastly, what is the distibution of 2s and 10s that that the FED bought up for QE as well as MBS securities (subprime or just 30 year fix)? Is that data even public?
Yes, I think the QE unwind has something to do with keeping the curve from inverting. To go a step further, if the Fed wanted to, it could prevent the curve from inverting by announcing that it would sell the longest maturities outright into the market at strategic times, and then watch the 10-year yield jump.
The Fed’s Treasury holdings are public. They’re all listed, including CUSIP, amounts, coupons, and maturity dates. You can look them up (click on “T-notes and T-Bonds”; if you want the whole schmear, you can download the data as an Excel spreadsheet:
https://www.newyorkfed.org/markets/soma/sysopen_accholdings.html
It all sounds like after ten years, we are finally out of the woods (figuratively of course, as a whole bunch of trees were felled to feed the economy).
I am going to put the champagne into the fridge, for tonight.
Negative rates are the historical norm, prior to the fossil fuel era. Only virtual assets are able to earn interest indefinitely. Real wealth either rots or rusts, has to be stored, obeys the Second Law of thermodynamics. That’s why usury was a sin. Only cheap energy made paying interest on a massive scale even theoretically possible. We are heading toward a medieval version of FarmVille .
Wolf you raise an interesting point here. The Fed can sell 10 year bonds and steepen the yield curve at will.
So does the yield curve remain a significant data point once the Fed starts doing that?
Do we know that they haven’t yet started to do so, and that the yield curve would have already inverted but for the Fed’s intervention?
I’m in the camp that doubts that the yield curve still has meaningful predictive qualities, given the distortions of QE and the QE unwind. However, I’m also in the camp of those who believe that the business cycle still exists and that we will get a recession at some time. The Fed seems to be convinced of that too. And they want to get ready for it.
The Fed has not yet targeted the yield curve specifically. The first thing they would do is make pronouncements to that effect, because this is really about market manipulation, and so that’s where they would start. They could say in the FOMC minutes that “a couple of” participants suggested that the longest-dated maturities should be sold directly into the market to raise long-term yields. Just this announcement would do a heck of job on long-term yields. But the only reference I’ve seen was Kansas City Fed President Esther George mentioning that the QE unwind is too slow. But there hasn’t been any followup.
According to MarketWatch:
“Speculators and hedge funds held a record number of short positions, bets on prices to fall, on 10-year note futures as of Sept. 28, data from the Commodity Futures Trading Commission shows.”
FWIW