Dallas home prices more than tripled since 2012. Manhattan turned south last year.
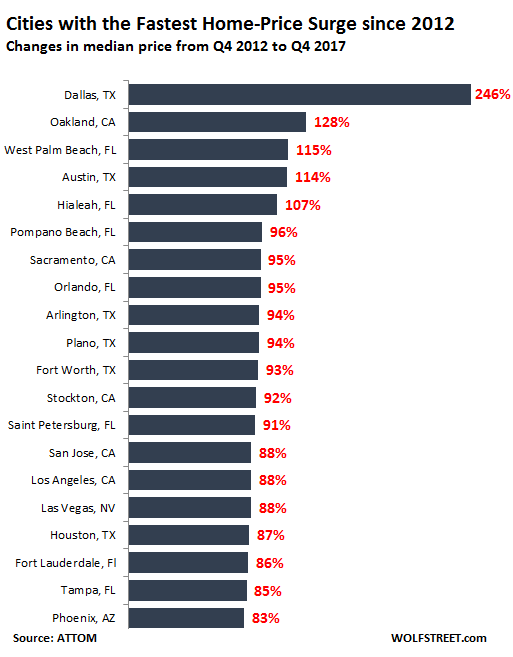
Among the 100 largest cities in the US, where did home prices soar the fastest over the past five years since 2012? No, it wasn’t San Francisco or any of the other housing markets where you need to have a top-notch income to buy a starter shack. And in five of these cities, home prices surged over 100% since the fourth quarter of 2012:
The winner (a dubious honor) is Dallas, TX.
From Q4 2012 through Q4 2017, the median home price in the city of Dallas skyrocketed 246%. In other words, during those five years, it multiplied by nearly three-and-a-half times, from $82,300 to $284,600. Since Q1 2008, just past the peak of Housing Bubble 1, prices have shot up 182%. Here are the next four cities in line:
Oakland, CA, is second. The median home price soared 128% in those five years, from $439,000 to $660,000. It is now 50% above the peak of Housing Bubble 1.
West Palm Beach, FL, is third. Its median price, at $200,000, soared 115% over those five years.
Austin, TX, is in fourth place. The median price, at $361,000, has shot up 114% over those five years.
Hialeah, Miami-Dade County, FL, is fifth. The median home price, at $237,500, has jumped 107% in five years.
The data I cite here was provided by ATTOM Data Solutions, the curator of ATTOM, a multi-sourced national property data warehouse. Note that these are the median prices: in each city, 50% of the homes sold for more, and 50% sold for less.
The entities are cities – not metro areas or Metropolitan Statistical Areas (MSA). The exception is New York City which is represented by its boroughs rather than the City as a whole. Also, median-price data is very different from the “sales pair” data used in the Case-Shiller home price index, though over time they move in parallel. Using the Case-Shiller data, here’s my most recent Update on the Splendid Housing Bubbles in US Cities.
The 20 Cities with the fastest 5-year price growth
Below are the 20 cities where home prices have surged the most among the 100 largest cities, starting in 2012. North Texas is represented by four entries on this list – Dallas, Arlington, Plano, and Fort Worth. In 12th place is Stockton, CA, one of the two cities near San Francisco that went bankrupt (2012) after the onset of the Financial Crisis. Since then, the median home price has surged 92% to $250,000. That may sound like a good deal for people who work in San Francisco, but they pay for it with a horrendously long and arduous commute.
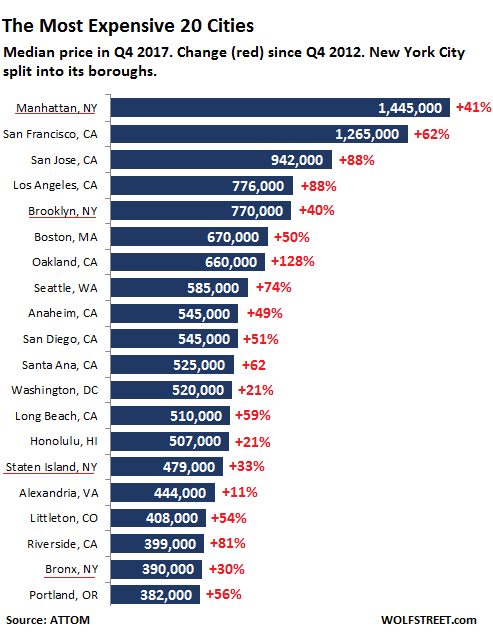
The 20 most expensive cities
In terms of the 20 most expensive cities, a different picture emerges. In the chart below, ATTOM’s data separates New York City by borough: four of them made the list, which I underlined in red. This shows of the vast differences in median home prices across the City, ranging from $1,445,000 in Manhattan to $390,000 in the Bronx. With all boroughs lumped together, the resulting median price for New York City would be in second place, after San Francisco, which reigns supreme in this home price craziness.
The respective price surges over the five year period since Q4 2012 are marked in red. None of the cities in North Texas whose prices have exploded has made this list yet:
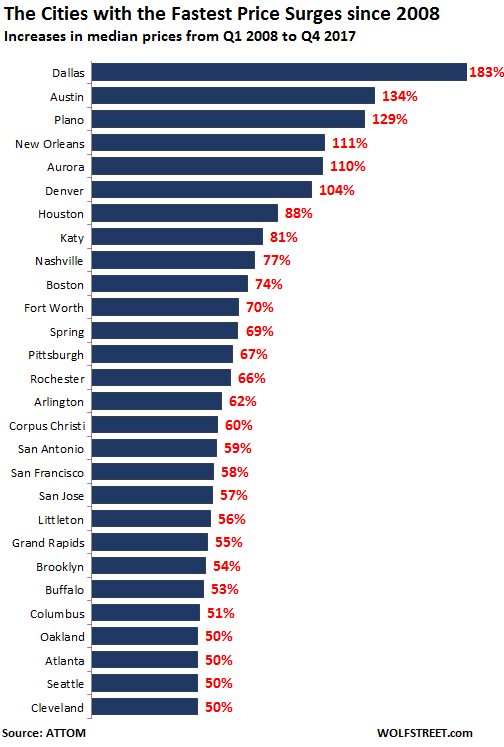
The 10-year price surge since the last bubble
In terms of gains since Q1 2008 – when Housing Bubble 1 was peaking in some cities, such as San Francisco, or had already started deflating in other cities a year or two earlier: Over this decade that includes most of the housing bust, there were 28 cities where prices surged between 50% and 183%. Dallas is once again the winner:
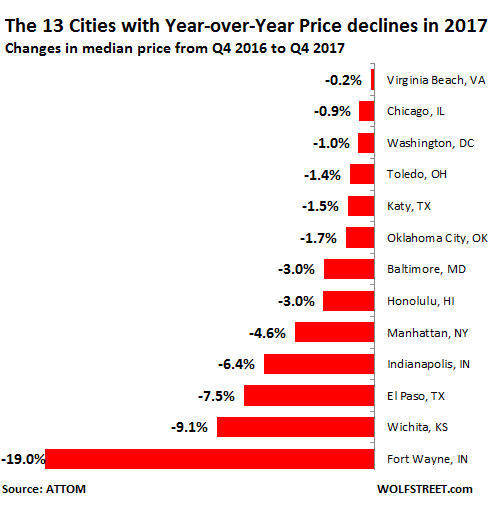
Nevertheless, there are some losers
Over those five years of blistering home price inflation, two cities, of the 100 largest ones, actually experienced declining home prices:
- Fort Wayne, IN: The median price in Q4 2017 was $83,500, down 25% from the more recent peak in Q1 2013 of $111,600 and down 13% since Q4 2012.
- Birmingham, AL: The median price in Q4 of $174,000 is down 32% from Q4 2012.
But 2017 was rough on some cities. In Q4, on a year-over-year basis, the median home price fell in 13 cities of the 100 largest. This includes super-high-priced Manhattan where the median home price in Q4 declined 4.6% year-over-year:
The whole schmear
The table below lists the 100 largest cities by population size. New York City is represented by the boroughs, rather than in one lump-sum figure. New York City as a whole is by far the largest US city, with a population of over 8.5 million. If its five boroughs were cities on their own, Brooklyn would be the third largest city in the US.
There are a number of cities on this list whose median home price increased sharply since Q1 2012 but hasn’t yet re-attained the bubble level of Q1 2008, including Chicago, Miami, and Orlando.
The US national median data is at the bottom of the table. You can use the search functions in your browser to find a specific city.
| City | Pop. Millions | Q4 2012 | Q4 2017 | YoY % | 5-Yr % | 10-yr % |
| Houston | 3.06 | $109,583 | $205,000 | 1.0% | 87% | 88% |
| Chicago | 2.70 | $150,500 | $223,000 | -0.9% | 48% | -7% |
| Brooklyn | 2.60 | $550,000 | $770,000 | 5.5% | 40% | 54% |
| Los Angeles | 2.43 | $412,000 | $776,000 | 11.9% | 88% | 40% |
| Miami | 1.82 | $167,000 | $285,000 | 2.9% | 71% | -3% |
| San Antonio | 1.70 | $118,269 | $187,000 | 3.0% | 58% | 59% |
| Manhattan | 1.62 | $1,025,000 | $1,445,000 | -4.6% | 41% | 29% |
| Philadelphia | 1.56 | $110,000 | $140,000 | 8.9% | 27% | 47% |
| Las Vegas | 1.47 | $125,000 | $235,000 | 14.6% | 88% | 1% |
| Bronx | 1.43 | $299,000 | $390,000 | 9.9% | 30% | 43% |
| Phoenix | 1.37 | $120,000 | $219,000 | 9.5% | 83% | 4% |
| Dallas | 1.33 | $82,364 | $284,619 | 5.0% | 246% | 183% |
| San Diego | 1.31 | $360,000 | $545,000 | 9.0% | 51% | 37% |
| Denver | 1.06 | $200,000 | $345,000 | 9.5% | 73% | 104% |
| Minneapolis | 1.06 | $161,415 | $225,000 | 4.0% | 39% | 20% |
| Austin | 1.03 | $168,632 | $361,000 | 5.9% | 114% | 134% |
| San Jose | 1.02 | $500,000 | $942,000 | 23.9% | 88% | 57% |
| Atlanta | 0.95 | $130,000 | $220,000 | 0.0% | 69% | 50% |
| Orlando | 0.94 | $105,048 | $204,500 | 10.6% | 95% | -5% |
| Indianapolis | 0.93 | $112,367 | $129,957 | -6.4% | 16% | 35% |
| Saint Louis | 0.93 | $95,000 | $143,000 | 8.7% | 51% | 43% |
| Tucson | 0.89 | $145,000 | $190,000 | 8.6% | 31% | -8% |
| Seattle | 0.89 | $336,000 | $585,000 | 16.6% | 74% | 50% |
| Portland | 0.88 | $245,000 | $382,000 | 6.1% | 56% | 35% |
| Jacksonville | 0.88 | $95,000 | $152,950 | 2.0% | 61% | 4% |
| Fort Worth | 0.86 | $94,212 | $182,000 | 8.3% | 93% | 70% |
| Charlotte | 0.85 | $140,000 | $200,000 | 8.1% | 43% | 38% |
| San Francisco | 0.84 | $780,000 | $1,265,000 | 7.2% | 62% | 58% |
| Milwaukee | 0.82 | $85,000 | $107,500 | 1.5% | 26% | -9% |
| Columbus | 0.81 | $90,900 | $138,000 | 4.0% | 52% | 51% |
| Fort Lauderdale | 0.81 | $124,900 | $232,200 | 8.8% | 86% | 4% |
| Cincinnati | 0.80 | $87,000 | $133,100 | 4.8% | 53% | 28% |
| El Paso | 0.78 | $125,930 | $133,140 | -7.5% | 6% | 11% |
| Sacramento | 0.78 | $149,000 | $290,050 | 9.5% | 95% | 41% |
| Tampa | 0.76 | $100,000 | $185,000 | 7.2% | 85% | 6% |
| Cleveland | 0.76 | $65,000 | $90,000 | 7.8% | 38% | 50% |
| Saint Paul | 0.75 | $160,000 | $224,125 | 7.0% | 40% | 17% |
| Louisville | 0.75 | $91,600 | $150,000 | 2.0% | 64% | 30% |
| Memphis | 0.70 | $60,520 | $95,000 | 8.6% | 57% | 48% |
| Pittsburgh | 0.69 | $110,000 | $150,000 | 6.0% | 36% | 67% |
| Oklahoma City | 0.67 | $87,500 | $117,000 | -1.7% | 34% | 37% |
| Albuquerque | 0.65 | $168,353 | $198,000 | 1.5% | 18% | 26% |
| Detroit | 0.65 | $17,500 | $30,000 | 25.0% | 71% | 36% |
| Washington | 0.65 | $429,000 | $520,000 | -1.0% | 21% | 37% |
| Baltimore | 0.64 | $86,750 | $95,100 | -3.0% | 10% | -21% |
| Salt Lake City | 0.61 | $168,589 | $261,728 | 10.4% | 55% | 43% |
| Fresno | 0.59 | $139,000 | $224,000 | 4.2% | 61% | 5% |
| Buffalo | 0.56 | $103,000 | $130,000 | 11.5% | 26% | 53% |
| Richmond | 0.56 | $156,500 | $190,850 | 2.3% | 22% | 4% |
| Kansas City | 0.56 | $125,285 | $163,000 | 6.5% | 30% | 38% |
| Colorado Springs | 0.56 | $175,000 | $255,000 | 10.9% | 46% | 40% |
| Bakersfield | 0.54 | $140,000 | $215,000 | 3.4% | 54% | 1% |
| Omaha | 0.54 | $125,000 | $159,000 | 9.7% | 27% | 28% |
| Raleigh | 0.52 | $186,726 | $235,000 | 11.9% | 26% | 34% |
| Mesa | 0.50 | $140,983 | $220,000 | 5.6% | 56% | 10% |
| Birmingham | 0.50 | $255,710 | $174,000 | 18.0% | -32% | -38% |
| Dayton | 0.48 | $76,000 | $109,000 | 2.8% | 43% | 38% |
| Long Beach | 0.48 | $320,000 | $510,000 | 5.2% | 59% | 19% |
| Rochester | 0.48 | $95,000 | $114,000 | 8.7% | 20% | 66% |
| Hollywood | 0.48 | $140,500 | $255,000 | 8.5% | 81% | 2% |
| Staten Island | 0.47 | $360,000 | $479,000 | 6.0% | 33% | 24% |
| Virginia Beach | 0.45 | $225,000 | $240,000 | -0.2% | 7% | 5% |
| Pompano Beach | 0.45 | $107,000 | $210,000 | 8.8% | 96% | -5% |
| Nashville | 0.44 | $165,113 | $275,000 | 10.0% | 67% | 77% |
| Riverside | 0.44 | $220,000 | $399,000 | 12.4% | 81% | 30% |
| Tulsa | 0.42 | $119,000 | $125,000 | 5.5% | 5% | 30% |
| New Orleans | 0.42 | $135,000 | $200,000 | 3.4% | 48% | 111% |
| Wichita | 0.41 | $107,907 | $123,500 | -9.1% | 14% | 35% |
| Honolulu | 0.41 | $419,500 | $507,000 | -3.0% | 21% | 45% |
| Aurora | 0.41 | $171,000 | $306,000 | 9.3% | 79% | 110% |
| Boston | 0.41 | $447,000 | $670,000 | 21.6% | 50% | 74% |
| Knoxville | 0.40 | $141,500 | $168,000 | 6.7% | 19% | 24% |
| Oakland | 0.40 | $290,000 | $660,000 | 9.1% | 128% | 50% |
| Arlington | 0.38 | $99,282 | $193,000 | 10.3% | 94% | 62% |
| Baton Rouge | 0.38 | $146,000 | $169,617 | 17.4% | 16% | 9% |
| Stockton | 0.37 | $130,000 | $250,000 | 6.8% | 92% | 19% |
| Hialeah | 0.36 | $115,000 | $237,500 | 8.6% | 107% | -10% |
| Anaheim | 0.36 | $365,000 | $545,000 | 4.8% | 49% | 31% |
| Grand Rapids | 0.36 | $91,600 | $149,900 | 7.1% | 64% | 55% |
| Santa Ana | 0.36 | $325,000 | $525,000 | 12.4% | 62% | 32% |
| Spring | 0.35 | $139,991 | $227,000 | 6.1% | 62% | 69% |
| Spokane | 0.35 | $145,000 | $184,900 | 8.6% | 28% | 19% |
| West Palm Beach | 0.35 | $93,000 | $200,000 | 8.7% | 115% | 3% |
| Saint Petersburg | 0.35 | $96,850 | $185,000 | 11.3% | 91% | 14% |
| Alexandria | 0.34 | $400,550 | $444,000 | 2.3% | 11% | 14% |
| Columbia | 0.34 | $99,900 | $129,000 | 3.2% | 29% | 3% |
| Littleton | 0.34 | $265,001 | $408,000 | 6.7% | 54% | 56% |
| Tacoma | 0.33 | $155,000 | $262,250 | 9.7% | 69% | 15% |
| Corpus Christi | 0.32 | $107,485 | $176,000 | 4.1% | 64% | 60% |
| Greensboro | 0.32 | $119,000 | $141,000 | 8.5% | 18% | 13% |
| Marietta | 0.31 | $162,750 | $248,000 | 9.3% | 52% | 49% |
| Vancouver | 0.31 | $180,000 | $302,300 | 12.0% | 68% | 30% |
| Toledo | 0.31 | $49,500 | $69,000 | -1.4% | 39% | 10% |
| Fort Wayne | 0.31 | $96,346 | $83,500 | -19.0% | -13% | -4% |
| Lexington | 0.31 | $150,000 | $174,000 | 3.9% | 16% | 26% |
| Silver Spring | 0.30 | $321,000 | $370,000 | 1.4% | 15% | -3% |
| Plano | 0.30 | $170,774 | $331,000 | 5.8% | 94% | 129% |
| Katy | 0.29 | $137,527 | $224,000 | -1.5% | 63% | 81% |
| Naples | 0.29 | $192,000 | $295,000 | 1.1% | 54% | -6% |
| Glendale | 0.29 | $130,000 | $219,000 | 11.6% | 68% | 4% |
| US | $154,000 | $226,065 | 9.7% | 47% | 26% |
Enjoy reading WOLF STREET and want to support it? You can donate. I appreciate it immensely. Click on the mug to find out how:

![]()
The whole thing is unsustainable and built on debt Reality will soon reappear
I don’t know when but I agree. This is unsustainable. And the comments here are as interesting as the data and analysis. I’m reading a whole lot of, “this time is different.”
When enough people are saying “This time is different,” it’s often a Tell that a crisis of some kind is not far off, at least for those of us with a “madness of crowds” (as opposed to the techno-utopian “wisdom of crowds”) perspective.
In fact, techno-utopian huckterism is itself a Tell – Flying robot-driven cars! Human pods shuttling in vacuum tubes under Los Angeles! Human colonies on Mars! Immortality for Larry Ellison! – that people’s critical faculties are atrophied, with the usual results.
look at the concentration in two areas… TX and Fla.
This is all for one reason. People are running from the northeast, Cali and other places.
No it won’t. As soon as prices really start to reflect reality a great big fat bailout will be implemented……just like last time…..and the time before that.
How any one can call this insanity “capitalism” is beyond me. home ownership is so far out of wack there is no hope EVER for a person like me…….I bought a house once. It was $175K and I thought that was crazy expensive turns out that is “cheap” now.
What happens to rust belt prices like Detroit if MAGA brings manufacturing back?
Ain’t. Gonna. Happen.
(that’s in reference to MAGA bringing manufacturing jobs back, BTW)
Wolf, where is the borough of Queens, with its 2.3 million people?
Yes, not in the data. I had a lot of back-and-forth with Attom to get the right data set (cities, not MSAs, the quarters I needed, etc.). And they were very good and worked with me to pull this data. They sent me several data sets until we had it down. And when I discovered that Queens hadn’t made it for whatever reason, Attom was already closed for the weekend :-]
Wolf, speaking of data sets, do you ever analyze markets by price segmentation levels? The property that has risen in the recovery from 2011 has been the high-end, which is driven largely by foreign capital inflows. However, there too, excluding the foreign capital, the trend is starting to reach its crest. For example, is the high-end segment the boat in which all other boats are rising?
I don’t think there will ever be a housing bust part 2 because the fundamentals of the housing market have undergone a tectonic shift.
First of all, central banks and governments have all but made it their mandate to keep home prices rising. This type of guarantee exists on almost no other asset. They want you to be assured that if you buy a house now, it will be worth more in 10 years no matter what.
Following the last bust, investors swooped in and bought up all the inventory for pennies on the dollar. This is a very different situation from pre-2008 where everyone was highly leveraged. These investors are sitting on a lot of equity and rental income has never been higher.
In addition to that, most people are in ultra-low interest loans that have practically never existed before in the history of humanity. How many do you think will want to trade up for a higher interest loan? That’s why sales are so low. Even in a recession, we know we will be bailed out. Even less reason to sell. This will go on for decades or longer imo.
From a an overall perspective I tend to agree with you that there won’t be a “bust” (as in a big crash like what happened 10 yeas who and what is probably going to eventually hit financial instrument markets) since the dynamics of the housing market of today are very different from a decade ago.
That said, when the next stock market crash or recession hits you may still see some significant downward movement in prices in selected markets where the house price/median income ratio has gotten way out of whack compared to the historical ratio for those regions. In other words, over the very long term you’ll see house prices mean-revert using traditional valuation metrics, just like all other asset classes eventually will as well.
yeas who->years ago
Which houses take a value hit will likely also depend on their tier. Places like San Diego already are hitting a wall on primum prices but as long as people are willing to buy smaller, perhapes as investments or otherwise, places the lower tiers and mid tier can grow…
We may see less wage growth overall but rising prices in places like Dallas seem to clearly be rising because of high paying jobs lile adding tech work to a financial hub. It has a reasonable course to become just like a West coast city housing price wise. Carrying cost wise it is still well shy of San Diego. And technically they can acctually slow the pain with increased housing. Though the cap on that is people’s willingness to commute.
Of course overall prices will remain very different in the lower tiers because of property taxes.
But it also seems clear that even if the growth in Dallas is justified it can’t go on like that forever. At some point it will hit saturation and price growth be effected.
I guess at that point cities turn into LA, Ney York or San Fran. Interesting times. I guess buyers have to dry up before prices come down.
I’ve heard Dallas is getting close to bankruptcy and owes public sector workers generous pension payouts that they did not fund. Sounds a lot like Chicago. If true it seems likely Dallas will raise property taxes to pay for those generous benefits and this may scare away a lot of potential buyers.
At this point I don’t want to own a house anywhere. I don’t want to get stuck paying pensions for services I never received. I didn’t get any firefighter services from the Dallas FD why would I want to move there now and pay $100K/year pension benefits for services I never received?
Actually if lots of houses are owned by big corps they would not not hesitate to unload it If it does not make sense to keep them financially or if they want to pocket the profit
There would be a stock as well as real estate bust.. we just don’t know how and when ..
Everytime people think this time is different but….
True, but these are not vacant houses, they’re all income/cash-flow generating properties. From the perspective of their value correlation to stock market performance it really depends on how the rental market holds up.
There have been stock market crashes with very little impact on the rental market (e.g. 1987, 2000) and some with a lot (1929, 2008). It’s difficult to tell what kind of correlation there might be next time around and to what extent. My own gut feel says financial instruments fall 35-45%, housing 15-25% (with a lot of variability between regions; again, watch that income/house price ratio which varies widely between areas).
Another issue to consider is total return. While in an overall perspective, the housing and the stock market markets have actually gone up by approximately the same percentage from their previous cycle highes around 2008, housing has been a much better investment when you consider total return. That’s because while the S&P500 dividend yield has been around 2% many landlords’ are able to achieve substantially higher ongoing income (6% is considered conservatively reasonable). Even if both markets were to crash tomorrow, those who’ve invested in RE have already banked that all that cash flow.
“They want you to be assured that if you buy a house now, it will be worth more in 10 years no matter what.”
The big word is “if”. Nobody can buy a house now because prices are too inflated. That is the problem. The Fed will take prices down for that reason. This won’t create a financial crisis for the reasons you mention. The economy can handle a 20% asset price drop across the board.
Prices were 20% less only 1-2 years ago, and the economy was doing just fine then.
People better informed should feel free to jump in and correct, but my nonprofessional take is that the housing market is less leveraged and less burdened by layers of derivatives than in the run-up to 2008, which would limit contagion in the event of steep price declines. Also, the reports/assumptions about foreign buyers paying in cash, also suggest a less leveraged market.
It takes more than just falling prices to create an emergency; you need seize-ups of confidence in the credit system, as well.
Credit, from “Credere” (“To Trust/Believe”) in Latin, is the ultimate linchpin in the system. Fewer layers of leverage, combined with the Fed’s (and local “Growth Coalitions” of builders, developers, realtors, bankers, insurers, elected officials, etc.) presumed insistence on not allowing another real estate collapse, might mean that the next bomb is triggered elsewhere.
” Nobody can buy a house now because prices are too inflated. That is the problem. The Fed will take prices down for that reason.”
The Fed will never ‘take it down’, because the owners of capital are being compensated for their excellent decisions and superior abilities.
In the short term we’ll see some chop but there will never be a 2008 style crash again. If housing begins to crash expect instant QE. The Fed is looking out for all investors in stocks and real estate.
I agree with a mild version of your statement… but my 3 month forward US real Case-Shiller model just indicated the first negative price change prediction since the great recession, for the 2/2018-5/2018 time period. Although I believe the lack of volume, supply, and mega leverage make a similar bust unlikely, I do believe an extended period of flat to grinding lower real prices are coming up.
Oakland is a city of neighborhoods and you have to get a lot more granular to get data that’s useful to a buyer or seller.
A breakdown by zip code would not be sufficient.
While very useful, these data sets are inherently limited, don’t ask them to show more than they can.
The VA part of Virginia Beach in the graphic wrapped into the next entry, so that the second entry reads Chicago, VA. :-)
Yes, it has been windy in VA Beach the past three days.
Thanks. Fixed.
We know that housing price increases (as a whole) can’t proceed ad infinitum. Some practical limit exists and I believe we are near that in many areas and in particular with slow rises in mortgage rates. Wolf’s outstanding work in this area of our economy shows that as well.
One has to take the housing inflation into the bigger inflation/deflation picture in this country. On the one hand, those with lots of equity (boomers that bought way back) can and do use that with home equity loans to stimulate the economy. Assuming they don’t get carried away and keep their payments serviceable in a downturn (e.g., loss of income), they would be OK.
The younger generation buying will not be so lucky I’m afraid if they’ve maxed out their budget (often two incomes) on housing. And most of them do…that is the mentality that exists still….buy as much house as you can as it will continue to rise. But these numbers are still limited, in my opinion.
So when we get the next downturn, and jobs are lost, there will be some impact on housing prices, no question. But not a crash like ’08 unless the broader economy tanks for other reasons.
One other thing. The Fed has shown that it will support housing prices by their action of buying MBS’s. If necessary they will do this again should housing prices begin to become severely stressed. There is no doubt in my mind this would happen.
I’m not a fan of all of this. Far from it. But the reality is much different today than those very frightening times of ’08/’09. Still should any of this come to pass, there will be a new set of consequences to deal with…so I’m not suggesting that anything is “fixed”; only that housing is in a more stable position for the reasons cited above.
Obviously the most striking thing about this data is what happened in the oil patch states which didn’t participate in housing bubble 1. For them housing bubble 2 was their housing bubble 1 but in an amplified manner during the oil price boom of the mid 2010s decade.
Another interesting observation has to do with regions which are inexorably tied to Federal government spending (where half or more of the economy is derived from Federal govt. activity – e.g., Alexandria, Silver Spring, Virginia Beach). The dynamics in those markets since the original housing bubble is quite different than all the other markets. Prices shot up big time during the original housing boom of the Bush administration but did not crash alongside everywhere else that also went through the original bubble. Following this they did not go through housing bubble 2, but instead stayed relatively flat since.
Where’s Queens?
Directly east of Manhattan on Long Island
See my reply to Steven Arnott above as to why Queens was not in the data set that I received.
kahnmann says reversion to the mean always wins anthing else is an illusion however strong so does schiller ,I have read both and believe both are correct ie it must collapse
Interesting that 9 of the top 20 cities are in Texas. We are getting a lot of economic immigration from other states. I live in San Antonio and we have new homes approaching $200 per square foot. Real estate taxes are 3rd highest in Texas and many are getting automatic annual tax increases of 9%. It is a big election issue this year about capping or limiting real estate taxes. City of San Antonio is drunk due to the inflow of tax revenue and spending funds on low yield projects like solar energy. Fortunately I am 65 years old and I am capped on any increases other than hospital district and junior college (20% of total).
Few young Americans can afford these prices so we sell them to wealthy foreigners. Strange plan.
Yes seems unlikely the fed’s plan is to lock out young workers from these cities as they try to build a career.
And guaranteed to result in a calm, stable and reasoned political environment, as well!
What could possibly go wrong?
The data says that the wealth is located where the finance and tech jobs are located. The U.S. excels in these industries. The places that attract retirees do well too.
Nearly all of our top companies by market cap and profits are either banks or tech. 20 years ago, many top spots were filled with industrial names like GE, but no more.
We’ve become a haven for R&D and arbitrage/scalping (i.e., banking). Of course, the arbitrage business is highly cyclical. In a downturn, it takes a big hit, as does R&D. The next recession could be a big one. I expect prices on the East and West coasts will drop tremendously in the next recession. 20-40% of the earnings in these locations is tied to stock compensation. Given that tech and finance may never be so highly valued (or overvalued) as they are now, the home price drops could last a long time.
There is nothing the Fed can do about it. Once debts hit a certain level, all stimulus potential is gone.
Don’t forget oil. Plenty of cities from Texas. Fracking definitely contributed.
By fracking I think the word you are looking for is JOBS. All of the inflated markets had jobs, all the down states lost jobs and the people flocked to the cheapest place they could start over. Some went to Seattle for tech work and some went to Texas for oil work. Jobs produce lower class wealth, with that wealth they spend on necessities. So houses sell and prices go up. The question is how long can Texas stay this inflated with an oil value that is barely over half the price of what it was during the boom? Or what will happen to Seattle when Amazon has to pay even 1% in tax on their yearly profits?
Consider that when housing prices are too high, people can’t afford them, and home sales drop (in number). This is a clear impediment to jobs and economic activity.
Ask yourself, why would the Fed support home prices at this time? If it keeps rates low, housing prices increase further and economic activity drops as a result of declining sales volume.
On the other hand, if the Fed raises rates, it has no big impact on sales volume because the interest rate rises would be offset by drops in the home price, and monthly payments stay the same.
This indicates to me we are seeing the top in home prices for quite a while. Prices could easily drop 20% as interest rates rise, and home-building activity will not be severely impacted. The Fed would sit back and watch.
“I’ll take Manhattan, the Bronx, and Staten Island too”
One thing to consider also is the additional property tax burden that goes along with these skyrocketing home prices. For example, Dallas, Austin, and Houston have property tax rates well north of 2%. As home prices inflate by hundreds of thousands, low-income households are getting hammered and even forced to sell in many instances. In effect, Federal Reserve monetary-policy has taken a wrecking ball to the social fabric of some of these communities.
The problem is this housing-price inflation isn’t the healthy byproduct of organic growth of middle-class wages, but rather the mad-scientist economic policies of money printing and financial repression adopted by our Central Bank.
In reality, they’ve unleashed an inflationary tsunami that is washing away the financial prospects of the non-asset holding portion of the population and next generation of working-class kids who are not inheriting wealth. Too many are being squeezed and left behind while the wealth of the nation is being maneuvered to the top.
What kind of social and political ramifications will this cause going forward?
You sir are spot on. Those are the facts and I rarely hear them spoken so clearly.
The Fed and the wealthy asset holders who profited dearly from Fed policies seem to care little about those who missed the ride or were too young to get on the ride. The Fed chose to funnel society’s wealth toward those who were already wealthy. Now the Fed just expects an entire generation to work as rent slaves to further enrich those who own almost everything.
We tell young people to save for retirement but 1 share of the S&P 500 now costs about 145 hours of the average wage – the historical average was 40 hours – and collect a meager dividend of 1.7% (less then inflation).
We tell young people to get a job and buy a home but houses cost 6X to 20X average annual income.
In other words: young people we want you to work and subsist like slaves so the assets we bought cheap will provide us a lavish lifestyle – disgraceful, intergenerational theft.
Kids should start picking up and leaving for greener pastures, the current pasture has been overgrazed by the sheep that showed up before them.
Great point about the amount of work hours required to buy the S&P. I never thought about it in those terms before but it illustrates how the wealth of the country has been shifted upwards. Cheers
Nashville’s current population is approximately .685 million, not .44 million. Interesting to see that its home price data and population size line up pretty well with Salt Lake City’s.
In my area what I’m seeing is high priced homes being purchased all cash. Then the seller takes his huge cash gain and buys cash in a lower priced area. It’s causing both areas to go up in price quickly and non cash buyers cannot compete. If prices drop these people will be fine with no mortgage. Check out this record breaking sale http://kron4.com/2018/03/02/video-2-million-sunnyvale-home-breaks-record-for-price-paid-per-square-foot-2358/
Owning a house is good but only if you can afford it.
Anyway, some prices are gonna drop due to having a stronger dollar this year. Others won’t.
This will be a year were debt will be heavier than in the past, due to rising interest rates.
Be careful with those credit cards folks!
I think, your data prove that inflation is alive an well if you know where to look for it. Along with house prices, the increase filters into property taxes. In the short run, that may give a boost to spending, but in the long run, factoring in rent increases, there is less disposable income to spend.
A side effect of easy money taking the path of least resistance: How not to build an economy: https://www.themacrotourist.com/img/posts/05/20180227-notbuild.png
Here in Santa Clara, CA the few houses that are listed for sale are selling in just a few days for ridiculous prices.
Here’s an example of a town house that was listed recently for $800K and sold in a week for $1.2 million.
https://www.redfin.com/CA/Santa-Clara/1888-Matos-Ct-95050/home/1645031
We bought an almost identical town house in the same complex for one of our daughters in Aug of 2011. It was a short sale and we paid $310K
You lucky sob. Set for life.
You’re not really set for life with that kind of gain. You have to factor in selling costs (the realtor fees alone will run you 72K) and capital gains tax which in CA can be quite high. So a gain of 890K could really translate into a gain of 600ish. It’s nice, but here in the Bay Area, you wouldn’t exactly be able to retire at, say, 50!
I just sold my house in San Jose for $1.3M. I enlisted a ‘discount’–for lack of a better word–broker who would sell for 4% if he handled the sell side only. Lucky for me, the buyer went directly to my broker so he only charged 3% for the whole transaction (he got $39K).
The days of paying 6% to a RE agent are over (but they’ll happily let you do that if you don’t know better). Pretty much all of them will do it for 5%, or less, and in my case only 3%. He used social media to the max; listed the house on a Wednesday, buyer got a private tour on Thursday and made the offer on Friday. We even canceled the open house on Saturday and Sunday.
I have bought and sold a few homes ‘By Owner’. If you know the market it isn’t rocket science. One house that I bought myself I paid 12% less than what it had been previously listed for. It just didn’t sell. When I sold it 20 years later I realized 500% on the purchase.
I would cut off an arm before I would pay a realtor $72,000 for selling a home. There is no reason to pay that kind of fee. No one works that hard. And by the way, if they are so crucial for the process then why do so many homes sell ‘above’ the listed price? Seems to me they don’t really know the market, after all?
But it is all relative. Selling out only works if you are moving to a lower-cost environment.
My generation (I’m 62) prepared for retirement by purchasing a starter/fixer-upper, renovated, paid if off, selling in order to rinse and repeat.
I know lots of working class familes who have done just fine following that basic recipe for getting ahead.
My sister, (American….Seattle area) refused to pay off her family home for most of her working life. When I discussed this with my brother-in-law he kept referring to the tax advantages of not doing so. I kept referring to the feeling of safety having a place paid for and not carrying debt. Now, that they have done so, they wholeheartedly agree. Now that the tax changes are in effect they are dancing with joy about it.
The 11th commandment: “Debt is bad, get rid of it.”.
Good to know, California Bob. I’m in the position of selling a house and am aghast at the hit to my equity. (I know, I sound spoiled as many people these days have no equity.) In my previous post, I also did not factor in the 250K exemption (for a single person) and 500K exemption (for a couple). I get neither because I have been renting the house out for 5+ years.
Can someone explain why realtor fees are 6% for virtually no work? And why is it the same fee, coast to coast?
These realtors use standardized forms and are often housewives doing it in their spare time.
What’s wrong with a discount broker if you want to sell?
Being an optimist, I see at least two solutions:
1.) The Hong Kong downsizing idea, where:
“Alongside a dense population, prices have soared at breakneck speed, leaving many unable to afford the dizzy heights of property prices.”
Solution: buy a 121 sq. ft. home for just $242,000 (USD)
http://www.bbc.com/capital/story/20180301-homes-made-of-concrete-tubes-could-solve-the-housing-crisis
2.) Or just shrinking people, as in The Incredible Shrinking Man:
https://www.youtube.com/watch?v=eA9YoqhjNtI
I clipped the following a while ago and sent it to some friends in the real estate industry. I got to austin in 1973 when assigned to the old Bergstom AFB. Fortunately I bought my first house ever at that time. I was aware of the cyclical nature of real estate and laugh at the large amount of “buy real estate” programs on the weekend radio talk shows. The pull back when Sen McCains membership in the criminal “Keating Five” blew up was the worst of them…My average rental property lost over half its value and rents also went down by over 50% . following gives one pause ““Take San Francisco housing prices, for example. From 2000 through 2005, they grew by a whopping 12.7 percent per year (on average). A $500,000 house purchased at the start of the decade would have grown in value to $907,000 in just five years. But from 2005 through 2009, that $907,000 house would have dropped in value to $642,000, a -6.7 percent average annual decline. The data firm of Crandall, Pierce & Co. further identified three other periods (1969-1971, 1978-1981 and 1989-1992) when housing prices nationally plunged by more than 15 percent. That isn’t low volatility.”
Lots and lots of “this time is different” type comments worded differently like “this market isn’t like 2008” or something something.
It is different, at least from the perspective of leverage when comparing asset classes, which is a key factor. In housing it’s gone down while in financial instruments backed by corporate assets leverage has increased substantially.
Uh-huh…”this time is different”…because something something…
People don’t realize what can happen when this asset bubble deleverages. Most will be in for an overwhelming surprise
Just because you cant understand the answers doesn’t mean that there aren’t valid differences
It is different, but not in the way people who bought in would like it to be. Housing won’t pop the bubble, Commercial real estate will. Brick and mortar melt down will drive down prices as fewer conveniences will be available. As those chains die off we will see more pensions unfunded and retirements gone.
That will be where it all ends up the same. Bust.
Wolf, thanks for the update on prices. Always a pleasure reading your articles.
If you take requests, would it be possible to see a similar article on wages, and new wages offered to recent college graduates? Or if you could guide us to some sources where we could find some “reasonably understandable date” for some of us not educated in finance.
Reading most of the comments here, its obvious that US Gov has chosen to squeeze RE for revenue, but all the speculation how long prices will rise, sustain, its all based on wages.
recession or not, it would be very interesting to see real data on wages for the new millennial joining the work force. I’ve heard a few stories of graduates joining the workforce with fairly higher hourly pay then i would have thought.
Thanks again
I cover wages occasionally. Next time I might add some data on age groups and differences by education.
“this time is different”, yeah this time you have foreign investors heavily bidding up the housing market since 08 crash, which contributed to the drastic housing price increase.
I want to see how these next couple of years play out, since China is restricting capital outflow on investments and spending. I believe the result of the restriction has taken place already from observation of my area. I live in Southern California, Rowland Heights to be exact, and have noticed that not much foreigners (mainly young Chinese) are driving quarter to half a million dollar sport cars as their daily. Two to three years ago I would see McClarrens, Lambos, Ferrari, etc… being driven by them on a daily basis.
Some of these homes that these foreigners are purchasing in my area in the past 4-5 years either sit empty, rented out or are use for illegal activities, such as prostitution ring. So not all these homes being bought are solely for family use. I don’t believe they have intention to keep it for long term, its their source of money laundering investment.
And seeing how Trump is running the show, he might be crazy enough to create heavier purchasing tax and property taxes on foreigner who are invested in US real estate. Enough with my rambling, I guess I’m just trying to say is there are other factors that will drive this housing price down. I don’t expect a crash, but a correction. Time will tell.
Not sure how these 6 “different this time” issues will play out, but I believe they are affecting Texas housing markets in MAJOR WAYS:
1) NEW ASSET CLASS – Rent-Backed Single Family Homes (“SFRs”) are an Asset Class for the first time in the U.S. (and in the U.K. for that matter) https://www.cnbc.com/2017/02/01/blackstone-takes-its-single-family-rental-bet-public-as-sector-soars.html.
Note that before 2011 when hedge funds started buying properties most “rich” people wouldn’t be caught dead owning rental houses for both the fear of being called a slumlord and the very-real liability exposure. Now that has all permanently changed. Rental Real Estate is now more trendy than oil among the rich.
2) INTRA-U.S. MIGRATION of both people and corporations from high-tax welfare states to low tax southern states, especially Texas and Florida https://www.census.gov/data/tables/time-series/demo/geographic-mobility/state-to-state-migration.html
3) HELOCS – Texas now allows HELOCs http://independencetitle.com/conservative-mortgage-rules-helped-save-texas-from-the-recession/
4) WATER – Long-term Texas and Florida both have water problems, including NIMBY resistance, drought, over-population, and now in Florida and Houston significant long-term pollution problems due to last year’s hurricanes
https://www.tribtalk.org/2016/05/26/with-water-issues-could-texas-be-in-the-same-boat-as-california/
http://www.winknews.com/2017/05/22/study-warns-of-deepening-florida-water-shortage-issues/
5) DISINCENTIVES TO SELLING – 50-year-low interest rates + very high property taxes + over-65 property tax exemption + homestead exemption from bankruptcy HAVE AND WILL CONTINUE to “lock” Baby Boomer Texans into their homes, stifle availability of homes for Millennials, and continue to drive up Texas home prices https://www.citylab.com/equity/2017/04/who-will-buy-baby-boomers-homes/522912/
6) REGULATIONS (and INTENDED CONSEQUENCES?) – Housing Affordability Problems are dramatically increasing housing regulation in Texas’ cities (which are already overwhelmingly Democratic) and instead of helping with affordability they are actually forcing landlords to regentrify and sell their rental homes.
This drives up the cost of the remaining rentals, while the cities cry crocodile tears as their tax revenues increase and their social costs decrease due to driving out “poor” renters and replacing them with Upper-Middle-Income owners. http://www.dallasobserver.com/news/dallas-city-hall-declines-help-for-poor-homeowner-linked-to-khraish-properties-9742664
So if “if this time is different” then we can all agree the Fed will not need to intervene in a any way…because “this time is different” and after all it’s massive intervention when this time was NOT different produced a super massive recession.
Wolf, thanks for all your work….it’s always appreciated.
I’m confused about how the data is so different with Case Shiller. The other day, you showed the the Case Shiller in Dallas went from about 112 in 2012 to about 181. That’s a 62% increase so how does this data show 246% increase?
Yes… median prices (50% sold above it, 50% sold below it) are heavily influenced by the mix of high-end and low-end homes. We saw this in all markets during the housing bust. There was a lot of forced selling going on at the lower end, and relatively more low-end sales entered the mix. However, at the high end, people could afford to not sell their homes if they didn’t get the price they wanted. So either they sold at the price they wanted, or they didn’t sell at all.
This reduced the share of high-end homes in the mix, and increased the share of low-end homes, and the median price dropped sharply in part because of the mix change, and in part because of the price change.
Since then, those higher-end homes did sell at higher prices, and the mix changed to reflect that, and it pushed up the median price.
Also, in Dallas, nearly all housing that has been built since the crisis is a little more upscale, and they entered the sales mix in large quantities, which too pushed up the median, not only due to their higher price but also by changing the mix.
The Case-Shiller was specifically developed to avoid this problem of the mix-change that impacts median prices so much. So it uses “sales pairs” and algorithms to come up with its own percentage changes. The Case-Shiller has its own problems, and it doesn’t depict $ price levels, just % price changes.
So when looking at housing, it’s a good idea to look at it from as many different aspects as possible. Median prices can be great, but they can also be tricky.
The really sad story here is that there’s no strong relationship between house prices and interest rates…
One little-discussed item about this “amazing” real estate market (just ask any realtor) is that the price increases this time are likely more due to a supply shortage than a demand increase.
The run-up to ’08 was driven by huge numbers of flippers and ppl wanting to trade up.
This situation is such that prices are so expensive that if you sell, where are you going to go? You can’t trade up like you did in ’03-’08. Unless you’re an empty-nester, why bother dealing with the hassle of moving to something that at best would be a lateral move?
Neither out of control demand nor unusually small supply are good things. That said, and this is JMO, strong demand as a reason for increasing prices is more indicative of a healthy housing market than restricted supply due to lack of affordability.
Absolutely true. It also makes this housing market uniquely vulnerable to a spike in the unemployment rate. In high end areas I don’t believe there are enough buyers at current prices if UR6 hits 6.5%, for example. If mortgage rates keep going up too it could be quite a supply shock. Still, without that UR6 increase (requiring a hefty recession), housing seems in decent, if slowing, shape
Bought a Manhattan loft 2010 1.2M, appraised for bank refi at 3.1M 2017.
Something has to give as I would not be able to afford it now at those prices. Cost would be north of 15k/month (including ccs and taxes) post taxes, let’s call it 25k pretax, 300k/year, just for housing. Even at 50% of income (not unusual in the city) that’s 600k/year. Not too bad considering the average income of the neighborhood is 150k/year.
Now the real question: how big is the pool of qualified buyers?
I live in Dallas proper and prices have gone up considerably and are definitely to nose bleed levels, but not 3x the value. Maybe 2x, but this increase is from the low point in the downturn. A basic home in Northwest Dallas on a typical 100’x150’ lot, not really renovated sold for say $325,000 before the crash now sells for $425,000 to $475,000. Tear downs are a different story. They have Increased more. Home prices in Dallas, Texas prior to the downturn were stagnant to maybe 3% increases in annual prices. This is the first accelerated home prices we have experienced. We are also experiencing a huge population and job growth so it’s not all a result of the Fed.