Consumers at the “low end” are tapped out.
Restaurants are considered a leading indicator of the economy into a downturn. The theory is that restaurant revenues are slowing when consumers, whose spending accounts for about 70% of GDP, start having trouble with their wallets.
Some call the current situation a “restaurant recession.” Wendy’s, in its earnings call today, calls it a “recent slowdown.”
Others don’t see it that way quite yet. If you’re trying to walk into one of the amazing restaurants in San Francisco on a Saturday night, you might be disappointed when you find out that the “restaurant recession” has failed to reserve a table for you.
The Restaurant Performance Index, released at the end of July, was equally ambivalent. Business isn’t falling off a cliff yet, but it doesn’t look good either, with the overall index having declined to 100.3 in June (above 100 = expansion), “as a result of softer sales and a dampened outlook among operators.”
“The uneven trend” in the first half, it said, “was due in large part to choppy same-store sales and customer traffic results.”
The Expectations Index fell to 100.7, barely positive, as restaurant operators remained vaguely hopeful that the next six months will get better. But the Current Situation Index, the reality check, fell into contraction mode (99.9), as restaurant operators, for the second month in a row, “reported a net decline in same-store sales and customer traffic.”
This is the struggle in the QSR sector – “quick service restaurants,” as the fast-food industry likes to call itself more appealingly. Today it was Wendy’s CEO Todd Penegor who shed some light on this in the earnings call (transcript via Seeking Alpha):
“Wendy’s brand is poised for success, even in a challenging environment,” he said as revenues plunged 22% in Q2 to $383 million, “primarily” caused by the sale of 361 company restaurants to franchise operators. Same-restaurant sales edged up a measly 0.4% in North America. Net income plunged 34%.
These results “came in lower than we’d anticipated,” Penegor said. But he had “confidence for the rest of the year.” Wall Street wasn’t enthusiastic. Shares plunged 6.3% by mid-morning before ending the day down 2.8%.
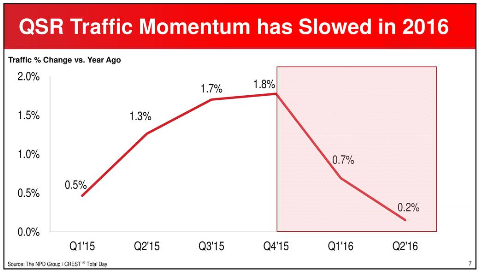
Then he took some time out “to talk about the QSR industry and what we have observed in relation to the recent slowdown.” He showed this uninspiring fast-food-industry traffic chart:
And added:
“We believe there are multiple drivers behind the recent slowdown, but the most notable reason appears to be the continued gap between the cost of eating at home and the cost of dining out, which is now at its widest point since the recession.”
In other words, it has been getting more expensive to eat out, and squeezed consumers are reacting by eating out less.
In the Q&A, he provided some additional gems of information. It’s about three times more expensive to eat at a fast-foot joint than at home, he said:
“And when a consumer is a little uncertain around their future and really trying to figure out what this election cycle really means to them, they’re not as apt to spend as freely as they might have even just a couple of quarters ago.”
So that’s the overall uncertainty, the angst about the future for regular folks in the Fed-engineered economy. Then there’s money:
“And it’s at a time where we’re still not seeing real wage growth….”
The Bureau of Labor Statistics just revised its numbers, reporting that inflation-adjusted hourly compensation in the first quarter had actually fallen by an annual rate of -0.4% from the fourth quarter, instead of the previously reported jump of +4.2%, and that in the second quarter, it had fallen another -1.1%.
Penegor, with his excellent view of the real economy as it walks into his restaurants, hit the nail (softly) on the head, when he said that “we’re still not seeing real wage growth.” And he went on:
“But we are seeing some of the cost of living move up when you get into what it costs to own an home and operate your life in general.”
So consumer price inflation – which is still too low, according to the Fed and an army of economists running wild in the media – is creeping up on these folks and is eating their lunch, so to speak. We have long lamented the soaring costs of housing, healthcare, college, and other items needed to “operate your life in general,” as Penegor put it so elegantly. And on he went:
“And there is a little bit of tightening on the disposable income, especially on the low-end.”
“The low end” these days is an increasingly large part of the population. So “it’s important” he added, that “you have some compelling value offerings….”
And “when you look at what you pay,” it’s a “lot cheaper relatively speaking to go get fresh beef at your local butcher and go home and grill it. So that does have a bit of an impact.”
With a few words he’d summarized what American consumers – the many who’ve been left out of the Fed’s asset-price-inflation schemes – are facing every day: uncertainty about the economy, a squeeze on real wages and disposable income, and rising costs “to operate” their lives. That’s not a good sign for a consumer-driven economy.
And now a peculiar phenomenon has set in. Read… This is When the Jobs “Recovery” Goes KABOOM
Enjoy reading WOLF STREET and want to support it? You can donate. I appreciate it immensely. Click on the mug to find out how:

![]()
Globalization and outsourcing for the corporate win! If our administration were to simply begin importing low wage workers by the droves, wages should fall accordingly. Similarly, export manufacturing and service jobs whenever possible, even if it requires being subsidized.
.
Rent has gone up 40 – 60 % in many areas.
.
When you give companies free money (zero interest)
they buy homes they never would have invested in before
and jack up the rent on the suckers.
.
Another unintended consequence of the FED jacka##es.
.
Corporations are doing it wide scale, buy the house, you jack up the rent.
These idiots in Wendy’s don’t notice their customers are paying 40 % more rent, and wonder why profits are down.
Oh they’re not idiots, they’re just following the “inside club” script…See, if the Fed doesn’t include housing prices in the official inflation statistics, then Wendys doesn’t have to either….See the game is pretending and lying to your face with the idea that you wont have the balls to do anything about it…Thats why food and housing arent included in inflation numbers…
Thats why they pay people to come onto websites growing in popularity, such as this one, and to sow FUD (fear uncertainty doubt) so when the next collapse comes, you will hopefully be too uneducated or “fearful” to read about what actually CAUSED the problem….This way you will accept whatever problem reaction solution they have planned for you, probably one with monsanto(soon to be bayer) food, digital currencies, and aerial vaccines..
Rent in fact is, but as mt friend here states the “Consumer Prices Index (CPI) — is a fraud on the public which ignores the single biggest cost you are likely to face in life: buying a property. It includes no element of house prices whatsoever. It includes rents, but in such a way that social housing rents are over-represented.”
When government lies to your face, the problem is not lacking the “balls” to do something about it. The problem is getting the power to do something about it.
The lies are blatant and accompanied with little smiles because those in power have rigged the game so comprehensively, there is no chance of upsetting it. The noises of true opposition are so faint as to be inaudible.
Americans, fat asses that we are might be realizing that our wallets have shrunk, and perhaps it is time to shrink our collective waistlines as well.
No inflation adjustments in minimum wages, especially for tipped workers in many states. Unbelievable!!
No retirees getting any colas either. Whoops!!
Some “recovery” eh?….
FYI the federal government’s colas preclude yours.
So the Republicannot Congress has its way and we suffer LOL! Appropriations, money, is spent by Congress. A rich Republican majority are quite pleased with flat wages, weak unions and little spent on the infrastructure. Mirror meet the folks who voted them in. Republicans OWN this mess. Sorry they own Congress and are the only ones who pay the bills not anyone else in the USA.
GSX
The president is a Democrat and the Republican congress has definitely not had its way.
Congress does not set wages (other than minimum) – businesses do; congress does not make unions weak – workers and union corruption/stupidity do.
As long as the American voter dithers about what he/she wants, congress will be ineffectual.
Chip, you believe we have representative (bottom up) government? Not a corporatocracy with crony capitalism at all levels?
TheBloomIsOffTheRose
I definitely do believe the USA representative (bottom up) government has a huge amount of distortion from crony capitalism.
Easy way to fix it (this is pure fantasy because it reduces campaign contributions to politicians):
1) Only flesh & blood “people” (not corporations) can make campaign contributions.
2) You can only make a contribution to a politician in who’s district you live (only people in your district can contribute to your congressman; everybody in the state to the senators; everybody in USA to the president)
Hate to break it to you but the Democrats are collectively the richest in Congress, and just as complicit in the offshoring of jobs and gutting our manufacturing
that may be true, but you act like Darryl Issa is like 200m above the next richest guy (who is a democrat. and i think three of the top 5 are Ds, so again i’m not saying you’re wrong):
http://www.cnbc.com/2014/08/27/who-are-the-richest-members-of-congress.html?slide=6
I found a couple of things to consider about the grandiose hustler. Also noticed the mobbed up dude stopped mentioning who’s going to get stuck paying for the wall.
https://ourfuture.org/20160809/trump-trade-position-is-opposite-of-what-people-think-it-is
One of Republican presidential candidate Donald Trump’s stronger economic appeals to working-class voters is his position on trade. Trump understands that people are upset that “trade” deals have moved so many jobs out of the country and he offers solutions that sound like he is saying he will bring the jobs back so wages can start going up again.
But a deeper look at what he is really saying might not be so appealing to voters.
Trump says the U.S. is not “competitive” with other countries. He has said repeatedly we need to lower American wages, taxes and regulations to the point where we can be “competitive” with Mexico and China. In other words, he is saying that business won’t send jobs out of the country if we can make wages low enough here.
https://ourfuture.org/20160808/american-greed-trumps-team-is-a-whos-who-of-whats-wrong
Who’s not represented on Trump’s economic team? Working people. Women. Minorities. The middle class.
Trump has two major groups of supporters. One percenters who understand his veiled messages and the Trumpets who cannot critically process them. The latter don’t count except to vote and rig the election for Trump.
Trump’s assertion about rigged elections is not a fairy tale. It’s a plan – by Republicans. In my prominent Northern California Tea Party Town, everything is all set up. Our absentee ballots for the June primary advised they had to be received by election day, a falsehood. They had to be mailed by election day. Then, when taken to the post office for mailing, the post office questioned if they could be mailed, discouraging even more people from casting their ballot.
Absentee ballots are usually the most conservative voters and there were two plump, outrageous and highly unpopular bond measures on the ballot. Both, thought doomed to failure, passed. Opposition signs are regularly destroyed and our one newspaper (Republican owned) stopped taking comments to news articles and LTEs, six weeks before the June primaries, leaving no one to skewer its glaring omissions and incomplete and inaccurate account of news and events.
The social media site Nextdoor, which should serve to counter those lapses is run by the city. A gaggle of Nextdoor members on the pretext of their being overrun with political news from other sources, attempted to get any mention of third party candidates or of Hillary Clinton removed from the site, when the only posts were for yard signs or an event. Political discussions are already banned but Trump supporters use Trump’s name and slogans in posts anyway. These are not removed, despite being in violation of Nextdoor’s guidelines.
Trump will win, not by popular vote but because Tea Partiers have gotten themselves in the positions to sway the election.
By the way, Wolf, I noticed most of my comments to your site have been removed. There were only a few left, although I have posted at least 8 or 10.
I just checked going back 30 days. I removed one comment because it was a duplicate. The other comments are alive and well.
==> not 8 or 10, but 41 of them going back to Feb!!! It seems you’re not looking under the right articles.
To find them, put this into the Google search bar:
wolfstreet.com TheBloomIsOffTheRose
The articles with your comments should show up. Click on one of the articles. Then in your browser, open the “find” function and enter:
TheBloomIsOffTheRose
That will take you there.
Have fun.
Wolf your site is being attacked by paid people, they’re hitting up ZH really hard as well….You will start noticing more comments, usually one of the first 3, that immediately put blame of a problem specifically on one group, such as “leftists” or “republicannots.”
Sorry triangle with eye, but most people who visit websites such as this one are hip to your game…Both Paul Ryan, Nancy Pelosi, Ron Paul, Newt Gingrich, Chris Christie, they’re all friends and they all break bread together at the dinner table…Sure they get on TV and put on a fake fight, but that’s all for show.
Do you think a congressman will EVER vote for a legitimate healthcare??? NO NEVER because they have full healthcare for them and they’re family for life…
WHY DO YOU THINK CONGRESS WENT ON A 6 WEEK VACATION WITHOUT PUTTING ANY MONEY INTO FLORIDA TO COMBAT ZIKA!?!?!?!?
Partisan politic?!?!? Year Right
There is also the issue of not understanding a word they say at these Fast Food Joints.
One year ago was the last time I ever went to one. I was in a hurry and pulled into the drive-through at Burger King (I prefer grilled rather than the burger being fried on a sticky filthy skillet top).
I could not understand the clerk at the drive through. She could not understand me…so I told her I was going to drive up to the window thinking that would help. Nope. I could not understand her and she could not understand me.
We need an ENGLISH ONLY drive through lane for those few left in America who can only do business in the dying language of English.
Its not necessarily the cost that is the factor. Low end restaurants cut the food quality and increase prices. Some of these places add cellulose to their meat. Who knows what else is in there.
I hate eating in the city. The food is garbage. For the miserable. staff, its their second job and they have to go home after their shift to digs that they spend hours commuting to. I shudder to think how the restauranteers make a profit — they squeeze it so hard.
Then go to the nicer restaurants.
There is wood pulp in many of the fast foods too. Eg. Bread and fries. I’m sure they have their tricks in the high end restaurants to, like washing the vegetables in chemical soups to kill everything (including you and I). You are better off educating yourself buying the best quality you can afford and minimizing eating out.
There is “cellulose gel” in ” ille” canned coffee drinks, sold at the best health food stores .Bought one and threw it out, full. I’m loving the drop in biz for fast food joints. I’m loving’ the economic slowdown, even though I don’t have a stash. It’s great to see the US corporations lose $.
Our Ponzi economy only operates in one direction: forward. Everything has to INCREASE – pay, spending and credit availability. But what happens in an economy chock-full to the gills with cheap money-induced ‘misallocations of capital’?
My bet is that many flash businesses, a big chunk of “jobs”, massive amounts of assumed spending and many retailers and restaurateurs would not be economically justifiable or be able to stand on their own feet without government repression of interest rates.
Zombies…and most of them don’t even know it…
What happens to a system artificially propped up with cheap credit and which is unable to re-set itself or engage in creative destruction? A system in which the business cycle has seemingly been abolished? One in which many people’s very “jobs” are fake?
I can see the imminent end of the low-end “waiter and bartender recovery”, rising prices for any necessities with pricing power and more, currency turmoil, job losses and eventually a shrinking of product availability on the shelves.
Expect fast food restaurant closures once their ability to cut costs ends.
Yeah……the dial being set to 11, only to fry the amp…….
“MORE”……. “FASTER”……
So how long until our central planners realize the wealth effect no longer works and is actually backfiring badly? I know several economics students, very bright people but all of them buy into the mainstream narrative of “stimulus” lock, stock and barrel. I’m not hopeful.
hard to call someone bright if they can’t use what they’ve learned, and instead rely on the gospel of others.
education is a slippery slope for many, because many seek to be lead instead of seeking answers. this danger creates problems like the ones we’re experiencing (CB “policy”)
But the licensed “transactionalists” the lawyers will do fine under lawyer in chief Clinton.
All businesses have a finite number of customers. When rhe limit is reached the only alternatives are to reduce prices to attract more of the finite to buy regularly or reduce costs. Neither is easy to do. Even reducing costs can prove expensive.
With a restaurant business, concern about food ingredients and qualiity is sure to play a big part.
From the consumer standpoint concern about obesity is also a factor.
ML
“…When rhe limit is reached the only alternatives are to reduce prices to attract more of the finite to buy regularly or reduce costs….”
While consumers do pay attention to pricing, almost no individual eats at the cheapest restaurant and buys the lowest price gas and buys the least expensive clothes, and has the cheapest cellphone & plan.
Businesses compete on value & convenience as well as price. If they only competed on price, there wouldn’t be so many of them. A quick drive thru any small or medium town illustrates the hundreds (thousands) of choices consumes have.
In an old interview (ca 1980) with Phil Donahue (I think) Doug Casey in his first book had predicted that fast food restaurants would fail because it will be cheaper to eat at home. I thought that was a little silly. A few years ago the first volley against slightly upscale restaurants was fired and many of them have either folded or are in dire straits. Now…fast food restaurants. His timing was off, but…he was right. Wow!
https://youtu.be/easuUdhW4X0 (Casey mentions this at the 12:45 mark).
I remember when McDonald’s arrived here in the 80’s: it was truly expensive and eating there, as absurd as it sounds, became a fashion statement like owning a Zundapp KS125 or some items of clothing.
Prices dropped in the 90’s but started rising again in the new century and truly exploded in the last few years: I’ve recently found a flyer in my mailbox announcing the opening of a new McDonald’s restaurant in the Middle of Nowhere (not joking). The cheapest adult menu is €7.10 and you don’t get much in the way or food and drink and I suspect, nothing in the way of service.
I’ve read McDonald’s had a terrible first quarter in Asia and Europe.
The Asian crisis was squarely blamed on the usual scandals (tainted meat/chicken/sauce) while Oak Brook struggled to explain the problems in Europe. Corporate suits sometimes seem to struggle with the idea of “ridiculous pricing”: even people with money tend to avoid a certain product if they feel it’s overpriced. €7.10 for a meal that looks like the one Michael Douglas is served in Falling Down may not cause the same reaction, but will surely cause people to close their walltes and look for alternatives.
That big “M” on the sign stands for:
MEDIOCRE.
The height of mediocrity, as in most things American these days.
OutLookingIn
And exactly who in the world is doing most things better?
BUT everybody will do anything to get to America.
+1000
correction:
@OutLookingIn
+1000
I wouldn’t want anyone here confused about where my sympathies lie …
you don’t get much for seven bucks these days.
unless you do it yourself. not so hard, really.
more people are doing it.
me, i stop in at costco.
Me, I buy beef direct from a rancher. Good stuff!
I suspect the reason for those results is pretty simple: narrowing.
If you go to a fancy tourist location or the better part of a big city, restaurants and bars are packed full. But go to flyover country and the situation changes dramatically.
Like the NASDAQ 100 has been skyrocketing while the Nikkei 225 has tumbled lower and lower, restaurants in prime locations do great while the rest struggle. Same phenomenon: like investors chase those supposedly safe dollar-denominated assets and shun the rest, patrons bring their business to upscale restaurants and shun the rest.
Like we needed any other confirmation that the “trickle down wealth effect” is as real as the Pegasus horse.
I’m in flyover country and people are definitely spending money eating out, even Taco Bell is busy. We went to a local pub for burgers on a Saturday night and we were lucky to get seated right away, there were people waiting to be seated as we left. The very expensive brunch places on the weekend are busy too, as are the other high end places.
I wasn’t surprised to hear Shake Shack had bad earnings. They were in Florida, near me, and the economy was not good there when we left at the beginning of this year. High rents, high home prices, high insurance costs, high utility prices, high food prices, and of course, low wages.
It’s not just the restaurant business. For years our government has ruined the free market. Achieving economic growth and prosperity is as simple as removing the four main government barriers to production: excessive taxes, burdensome regulations, tariffs that limit one’s ability to trade freely and money deprived of its sole purpose as a measure of value. Economists and politicians have too often forgotten this in modern times, much to our detriment. We’ll probably never see true capitalism like in the 19th century and early 20th century again. So the restaurant business just like every other business will suffer. Socialism is winning.
Plus, the business owner does not own his/her own business. They are basically told WHO to hire and HOW much to pay.
They are scared to fire the drug addicted, late, or alcoholic worker. They live in fear. I know, I’ve been in the restaurant business and certain workers can bring you down.
There is also unreasonable expectations from the public. They do want things for CHEAP but don’t understand the product/service will also have to be CHEAP.
Fast food joints will not go out of business since they are faster and cheaper than sit down restaurants. Few people want to pay somebody to bring the (same) food to them and have to tip. Why add $10 per person to your group?
The middle class restaraunts (Olive Garden’s, Outback) are the ones in trouble. Their ingredients can only get so cheap (and I think they have reached that point) and they can only keep their prices where they are if there is NO MORE collapse in the Middle Class. Good luck.
A minimum wage hike and service will suffer or prices have to go up. Just as the Middle Class is going away in America, those businesses that cater to them must also go away: Sears, JCPenny, K-Mart, Gap, Old Navy, etc. They will be old names like Sylvania, RCE, Zenith, Curtis Mathis, FIscher…names most of you will not know….back when America’s Middle Class built America’s middle class Televisions, stereo’s. etc.
Next time you buy something because it is “cheaper”, realize you are putting your neighbors and your kids out of work in a year, and yourself out of work within the decade.
I have to be careful with money out of necessity. But everything I buy is not purchased just because it is cheap. I don’t shop at Walmart because they treat their employees badly. I won’t go there no matter how much I can save. Won’t eat at McDs because the food is terrible. I went to Shake Shack and 5 Guys which are better and more expensive, but not often. I shopped at Publix which in Florida is expensive because they have good service compared to the rest. I tried to stick to the sales.
I go cheap on the things that don’t really matter that much and I overspend on things that matter to me. Just because something is expensive doesn’t mean the service or product is good. I have eaten some bad meals at expensive restaurants. What passes for luxury merchandise these days is crap, mass produced in Asia and not worth buying unless it is cheap.
Re: televisions, stereos etc.
The idea that some kind of trade acts can bring back the 50 and 60 s and manufacture of these is not going to work.
Is China hurting the US by making cheap TV’s..
The US was out of TV’s before China was in- taken out by Japan as with most consumer electronics. (And as any electronics guy will tell you they also built a better set- e.g. more protection against current surges when a component failed- so not everything blew.)
Now Japan is out, with Sony exiting the biz.
The 50’s were a golden age in US manufacturing for a completely obvious but rarely heard reason- after WWII, the US was the only manufacturer left standing. The two main competitors today, Germany and Japan were flattened and broke. In 1950 the US had over 80 % of world manufacturing.
Those days aren’t coming back, nor will shoe and budget clothing come back. Not will deporting Mexicans open up jobs in lettuce and strawberry picking ( unless you want 6$ pound strawberries)
As for all this wailing about fast food, when I was growing up in those hallowed 50’s and 60’s- any fast food was a rare treat.
I think our family had an actual sit down at middle of the road place once, when it was won in a contest. I still rarely buy fast food. Today about one third of the US food budget is spent in restaurants- mostly fast food.
I would more impressed about the squeeze on the middle class if it wasn’t blowing this amount of money.
Haha – never considered olive garden or outback middle class. O Garden is lots of bread to fill ’em up and the outcrop is the next step up from mcdonalds mediocre) with the latter.
You missed the point of my comment.
It’s the food, stupid.
I think I remember being in Wendy’s approximately twice in my life (I’m 63). Their food, even for fast food, is terrible. Really really bad. That’s their #1 biggest problem no matter what the economy or price point.
This guy is just lying to himself, conjuring justifications. I would better ask – who IS eating there??
Waiting for my cat at the vet a few years ago I walked across the street to Wendy’s and ordered some kind of chicken sandwich. After two hard, sour, dreadful bites I threw it in the trash. Inedibly bad. Not to be confused with ‘food’.
Your food sucks dude. I’ll bet you don’t eat it either.
Time and convenience versus cost and quality.
Farmers’ markets, a good butcher/meat shop (if you’re not a vegetarian) plus a bit of time for prep and cooking is so much better and healthier than fast food. Add a garden in the back yard if you’re able to, and say goodbye to the chain-store restaurants.
It is amazing to see all the commercials for these places on TV. They spend a hell of a lot on advertising.
How much is a double at Wendys? I haven’t eaten there in years, but when they first came around in the seventies I thought their burgers were the best of the lot.
With burger going for around four dollars a pound at the store, I can’t see how eating at home is cheaper for burgers unless the price has shot up in recent years.
We prefer home grown and cooked whenever possible to somewhat control the chemicals we ingest. The butcher raises his own beef and pork with no added hormones and no RoundUp ready grain (he grows that, too).
I got a double combo meal with a 1/2 salad (pecan/apple) 2-nights ago. I was about $12. I don’t eat fast food very often. But Wendys is by far the best fast food burger in my town.
Yeah.. Just wait until the minimum wage is $15 for the burger makers. 15 an hour for people to get frozen food a put it in the micro to give to you.
Those value meals will go from 8-9 bucks now to 13-15… Same goes for burritos… “Hi chipotle” no thanks I won’t contribute to the economy. I’ll make my own sandwiches and hotdogs.
Mcdonolds is learning a few lessons, such as eliminating antibiotics in meat ect… They have plenty of places to cut and squeeze profits.
The fast food joints are in tough spot…
Squeezed by rising wages mandated by the liberals (for jobs requiring little skills), meat/vegetable prices up, utilities up, insurances up yet the sheelples who frequent these joints’ income are “falling” due to rise of rent and everything else.
I recall that mid priced restaurants like Olive Garden and Applebees are also facing headwinds. I went to Applebee recently (haven’t stepped in 20 yrs!) and was surprised by their $20 offerings which were pretty cheap.
So if the fast food and mid priced restaurants the proverbial “canary” in the coal mine are signaling slowdown – the economy may be in for some rough times especially after the election (with all the LIES perpetrated about the economy by Obama and his cronies).
Or it could be just the opposite. Maybe more people have more money to spend and prefer to eat at better restaurants. :)
I hate eating at sit down restaurants in SF or SillyCon vally restaurants… some sit-down places that are just normal nothing fancy… just a gourmet burger joint… they charge an extra 3.5-5 % of the bill to pay “employees health care benefits” so now.
1. food dish price
2. sales tax
3. Tip
4. extra % to pay for HC benefits… WTF?
for tips.. They now write in on your bill with options of 15%, 18%, 20%, 25%… LMAO… I tip the sales tax amount, If the service was decent, if not decent like my food was cold, I got wrong ingredients, or the server disappears for 15 min when I need ketchup or hot sauce… I tip 2 bucks…it is what it is… There seems to be an expectation or entitlement to getting fat tips regardless of the services… well not from me or my family…
P.S. before anyone thinks I am a cheap old bastard… nope I’m an older millennial 32.
If you can’t afford to go out and eat and leave a decent tip, why bother at all? You want decent food and a nice atmosphere, pay up.
Agreed.
My family gives me hard time for not leaving generous 15% or more tips as my rule of thumb is 10% as it’s plenty. Worse is this 20% tip no matter how the service was like for party of 6 or more BS. Also amusing to see tip jars everywhere as I’ve seen couple of times the counter employee either putting bills there or readjust to show $5 bill.
As for the restaurant prices – it has been creeping up ever higher in the SF area for last few years.
Just increase the EBT payouts. Problem solved
Doesn’t she blame Brexit, too? All the cool kids are doing it!
Actually, I personally just think people are sick of junk food and the fast food restaurants don’t want to admit it. All the good quality restaurants I know are jammed.
Well, here we go. Logans Roadhouse restaurants have filed bankruptcy. http://www.al.com/news/index.ssf/2016/08/logans_roadhouse_files_for_ban.html
LOL
A “fast fooder” blaming a “faster [criminal] gov”.
The irony is too much sometimes.