Struggling Tech Boom as seen through San Francisco’s office space market.
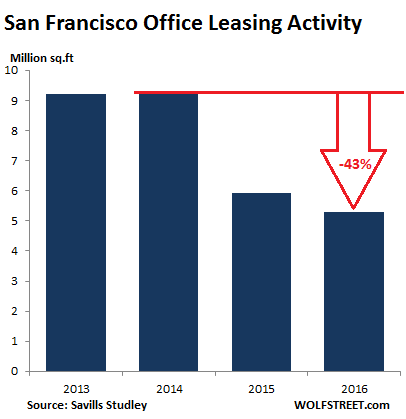
“Despite a flurry of leases to end the year, 2016 was the weakest year for transaction activity since 2009,” said Colin Scanlon, Research Manager, at Savills Studley, in the report on the San Francisco office sector. “Anemic demand and a deep pool of sublet space have finally brought rental rate growth to a halt.”
For the year 2016, new leasing activity dropped to 5.3 million square feet (msf), the weakest annual total since 2009, down 34% from the long-term annual average of 8.0 msf and down 43% from glory year 2014. The downturn in leasing activity had started with a deep plunge in 2015.
“Rightsizing has once again come to the tech sector, overtaking the rapid expansion phase of this cycle which had prevailed for several years,” Scanlon said. Here’s one of the consequences of this “rightsizing”:
It could have been a lot worse, if Charles Schwab had renewed its 417,266 sq. ft. lease a couple of weeks later, in January 2017, rather than just before Christmas. The lease was set to expire in May 2018. So there was plenty of time to drag this out a little. But apparently the landlord was desperate to get this squared away before the end of the year. Without this timely renewal, leasing activity would have fallen below 4.9 msf. Imagine what the above chart would have looked like.
That lease had caused a lot of fretting in San Francisco. All year, Schwab had been thinking out loud about moving its headquarters out of San Francisco to a less ridiculously expensive location – as Uber is moving its headquarters to Oakland. So everyone breathed a huge sigh of relief when Schwab renewed its lease at 211 Main St. for ten years and maintained its HQ in San Francisco. It was one of the largest deals of the year.
At the same time, Schwab has been shrinking its footprint in the City and moving employees to Texas and Colorado. In 2015, it still had 2,040 employees in the City. By 2016, it was down to 1,590 employees. It has been vacating its second location, at 215 Fremont St., in sections, including subleasing 315,000 square feet to Fitbit earlier in 2016.
But tech companies have experienced turbulence. The report:
Tech companies have been forced to adjust their mindset this year, shifting from a grow first and profits later perspective, to a focus on squaring expenses with revenues. More businesses have kept their headcount flat, while a few have had to shut down operations entirely.
Layoffs are being announced, not just at smaller startups, but at some larger firms as well. Twitter’s 9% headcount reduction and shutdown of Vine dominated headlines, but Cisco, Intel, and Yahoo also made big cuts. Some companies remain in expansion mode but they are no longer the dominant driver.
And landlords are getting worried about the ability of some young companies to stick it out, and they’re focusing on credit-worthiness and are requiring larger security deposits.
So the overall vacant availability rose to 8.7% in Q4 from 7.9% a year ago. In Class A buildings, vacant availability jumped to 9.8%, from 8.5% a year ago.
Vacant availability varied widely by area, from 2.4% in South of Market (SOMA) to 11.2% in Financial District North. But the office market remains tight compared to the US average vacant availability of 17.1%, or Greater Houston’s at a near-catastrophic 27% (29% for Class A).
Rents have become sticky, which each side trying to gain the upper hand unsuccessfully. Overall asking rents inched up 1.5% from a year ago to $64.81 per square foot (compared to the national average of $32.78). Average Class A asking rent, at $66.16, was up an imperceptible 0.3%.
Leasing activity of newly constructed office space over the last five quarters has been “anemic,” at the worst possible time, with 4.1 msf of office space under construction, “nearly triple the historical average,” according to the report. Only 34% has been preleased. This will pressure the market going forward.
The action has been in sublease space. As companies like Schwab, Twitter, and others are vacating space that they’re still leasing, other companies find it cheaper and faster to move into this space rather than into new construction.
The sublease market dominated leasing in 2016, and the second half in particular. Overall, subleasing accounted for roughly 35% of leasing activity in the year, and over 50% of activity in the second half. Counterintuitively, this is not due to a discount on sublease space, rather the ability to acquire pre-built facilities for shorter terms than landlords are willing to offer.
Tenants and owners are both eager to avoid soaring build-out costs. Many markets across the U.S. have seen construction costs spike by more than 20% over the last two years. The increase has been even more acute in San Francisco as subcontractors are in short supply, contributing to extreme backlogs and skyrocketing costs.
Rather than spending a fortune on building out new office space to turn it into a usable office, and dealing with the costs and delays this causes, tenants move into a space already built out by another company. And so, “the last few months have brought some of the largest and most heavily discounted subleases in several years.”
This is the picture of a boom that is now coming to grips with the reality of dollars and cents. It always works that way. San Francisco’s booms and busts are legendary. After the boom comes the bust. No one is panicking just yet. But this reality of dollars and cents does matter again, after years of being irrelevant – with big implications.
It’s hitting even the formerly hottest residential rental markets: San Francisco, San Jose, New York, Boston. Read… Even Single-Family Rentals Sink in Once Hottest Markets
Enjoy reading WOLF STREET and want to support it? You can donate. I appreciate it immensely. Click on the mug to find out how:

![]()
The entire tech field is all starting to feel a lot like the late 1990s, where companies spent millions of dollars on software that was never implemented, or never used to its capability. And later, it was discovered there was never a solid business case for a large portion of that spending.
I didn’t chime in much on the IBM thread, but it’s a complete disgrace what has happened with the H1-B visa program, instead of augmenting American workers, it’s become a replacement program. I couldn’t, in good conscience, recommend the next generation of high schoolers’ to focus on a “coding” career. Medical, civil engineering, pharmacy, hopefully, high tech manufacturing would all be good fields (instead of traditional tech).
Heck, even being an electrician or plumber has more future than a lot of college degrees. Hard to get a robot to fix or add wiring to a building or retro a buildings fire suppression system.
I’ll bet that most electricians make a lot more than most coders.
It’s not true. Most coders make a lot more than most electricians.
My son makes between $65-$80/hr as an electrician. Plus, he gets to set his own hours.
Welders may be a better example. Depending on skill level, they can make from $50k to $150k or more. They are also in much demand and their skills are not outdated as quickly as coding. I spent 25 years as a developer and in hindsight, I wish I’d followed my cousin into welding. More options on where to live (not just expensive tech hub cities) for one. The good ones with advanced skills can do very well.
the point is the demand for skilled blue collar labor is higher than coders. who will fill the make american great infrastructure jobs.?
it takes 6 months to get a new roof here in n. central Florida . I guess the millennial snowflakes would rather live at home with parents and iphone sipping a starbuck’s latte.
Hell with college go to a votech school.
Augmenting is no different from replacement anyway. I have repeated said, as a country grows richer, the population often becomes lazy and entitled. Indians and Chinese work with the hunger of poor since their forefathers didn’t hand them down shit loads of wealth like the European or American. They value education and thrift. There is no reason to hire an American for twice the cost of an Indian.
No shit brah, my 17 year old is getting the word from me that all that BS about a shortage of STEM was really a shortage of STEM at half price. Trump is on to this and I will look on approvingly at his wrecking ball approach to these Disney/Microsoft/ crony chamber of commerce strip miners who are fucking the moms and dads all over this country.
Trump the Punisher.
It seems to me that most of the signs point to a decline in business activity yet the stock market just hit a new high.
I guess this just shows how disconnected the markets are from reality. Show the cognitive dissidence between financialization and fundamentals.
Wonder how long this can continue?
Any growth in GDP from here will likely be attributable to the unregistered inflation we all know exists.
As long as the government can continue to hide inflation through bogus computations, the rise in stock values can continue. With artificially suppressed inflation numbers, they can artificially justify the QE and low interest rates, which will artificially keep stock prices high.
Without the artificial aspects, we’ll all be toast. Reality will kick in at some point, and that will most likely be coupled with extreme anger.
I view Amazon as a huge deflationary force.
“I view Amazon as a huge deflationary force.”
No, China is the huge defaltionary force. Where do you think most of the junk Amazon sells comes from?
Right now the USA need not ever worry about fiscal discipline because inflation will not go balistic as long as the great black hole of China is around to absorb excess money!
If we have a trade war with China all bets are off. Too much money will be chasing too few goods.
I don’t see HOW we can have much inflation because there is no room for it in our consumer’s bottom line. As far as I can determine from my own personal existence and from my reading, 95% of the people are already on the verge of collapse. To many mandatory expenses and to little income. For the majority of families it seem that they only get by because they have access to credit. They buy everything on credit. Some of the best off pay off their cards each month but still pay on both their majors, house and car.
So IF we have any real inflation, then this consumer economy goes into the dumpster and the whole house of cards comes crashing down.. This isn’t 1980. or 1960 or even 2000.
This is what I see as the MAJOR draw back to our new government’s plans. There is no more room for inflation. So what if the stock market goes up and businesses have tax breaks, ONLY 5% of the people in the country will benefit.. many another 5% on a much smaller scale while 90% will not.
Any inflation from a trade war or any war or the cost of money going up or because wages in the US go up a little, just about any reason will cause the system to implode.
There is just to much consumer debt in the system already.
The SHTF moment is in play now. All the money pouring into the digital media supply chain is finally being scrutinized. Kudos to P&G’s chief brand officer Marc Pritchard, for his Trump moment of brashly calling them out.
https://www.marketingweek.com/2017/01/30/pg-media-buying/
I think Trump is going to unload many of the properties the govt owns and doesn’t use. It will be interesting to see what and where he unloads these properties.
When I think of gov owned property, I’ve never thought about office space only land, water. I bet they do own a lot of office space though interesting. Totally off topic ( sorry Wolf ) but what do you think is going to happen to the price of silver and gold of they impose taxes on it coming in from other countries? I don’t think we mine a lot of gold or silver in the US.
The government owns a lot of surplus offices and land, they are mainly on military bases that the military has been trying to get rid of for years.
If you buy physical, you can always pound it into jewelry and make stuff.
The GSA (General Services Administration) routinely disposes all manner of Gov’t owned real and personal property. They even have an island listed for sale.
https://resourcecenter.secure.force.com/pbs/SearchProperty?state=ALL&type=ALL
Short office furniture stocks!
Perhaps President Trump will get around to an H1B visa ban and claw back when he is finished with the border fence and sanctuary city actions. In my mind the “rightsize” for most of these tech companies is zero.
I’m not for an outright H1-B visa ban. There are areas where we can and should be engaging with highly-educated foreign workers. They can augment and assist American labor, where necessary.
The following items need to take place to ensure the integrity of the law:
– All H1-B workers need to be paid a minimum of $100,000/year
– An associated Masters degree in the specialized field must be acquired prior to work
– No H1-B visa can displace any American worker.
– Any company found to be in non-compliance with the above regulations will lose their H1-B visa privileges for 5 years
I have witnessed first hand the displacement of American workers for H1-B workers, and it’s a sight I’d rather not see again.
Years ago, the congress put a dollar minimum on H1B’s and other cheap labor pools. Fast forward to today and we see that the dollar minimum is still in place yet inflation is much higher. While an imported laborer may take the static low wage to get a citizenship the domestic laborer, in reality, must scale back their standard of living, plans for a house/family, etc.
I think what would be optimal with regard to H1B pay is NOT another fixed dollar amount (that will be inflated away and be more of a disadvantage to the domestic laborer). Rather, H1B pay should be a yearly recalculated percentage of the mean pay rate on a state by state basis. For example, if the mean pay is $45,000 USD in Utah, then any jobs offered to H1B in Utah should pay 150% more than the $45,000 USD (which means pay of $67,500 USD in Utah); as you can see, in magnet states like California those H1B workers would be draining cash like a politician’s pay. After all, don’t tech companies complain about the urgent need and pay is not a consideration?
Some good ideas here, except I believe the Masters requirement is already in place but is easily scammed by the copious diploma mills in India. The big offenders are the Indian tech companies’ US divisions where the large majority of staff are H1-Bs.
I’d like to see a per-company limit, a percentage-of-employees limit and minimum salary. Most of all I’d like to see it become so socially unacceptable to dump American staff that companies start paying a massive reputational price for doing so.
Are you kidding me? India’s per capita is $1,598.3. You offer $100,000 per year, and Indian outsourcing companies will pass through the 7 gates of hell to bring in as many H1-B visa here.
Make a Ph.D. required and Indian outsourcing companies will print out a million Ph.D. documents for you. That’s how many Indian employees were getting jobs in the Internet boom years. They could get any fake diploma or certificate that you wanted.
And companies don’t have to worry about how hard H1-B visas process is since in a country where per capita income is $1,598.3, you can hire a lot of people whose job is only making sure they take of any complicated process.
The only solution is to drastically decrease the number of such visas; anything else will be played with so easily.
How the hell all are all software companies throughout United States full of Indians? I see many Indians who can hardly be called competent in their jobs, yet they are kept while Americans are kicked out because they are simply cheaper. And the solution is not to pay the Indian workers a million a year to make them less attractive to companies. The solution is to ask how the hell is it that 90% of employees in almost all technology and banking related companies, and I’m sure a lot of other companies are Indians?
As I mentioned before, I feel like a tourist in a Mumbai market whenever I step into any of the big software companies; Google, Apple, Facebook, Cisco, Wells Fargo, Intel, Walmart, Amazon, etc. etc.
This is sheer madness and stupidity. They basically keep teaching Indian more and more technology while American worker is more and more stupid with regard to technology. Where do you think this will end up? CEOs of many large companies are becoming Indian because in these companies 90% are Indian workers; who do you expect to become CEO?
At the end of the day, cost is a factor. If a person can do a reasonable job (not at the same level as an American) at 1/5th the cost, any business owner would want them to do the job.
At the end of the day, Americans want two things at the same time. They put on the employee hat and then demand good wages, good benefits paid time off etc. Fine. Then they put on the consumer hat and demand lower prices on everything. Not fine. They cannot have both. It is up to them to choose. This is not just for H1b but also for importing/offshoring etc.
One can staff up Apple with American engineers and produce an iPhone in America fully, but it will likely cost 1500$ or more.
So Americans, pick your choice. You cannot have both.
Add in the Union component in which many are totally inflexible. They want so much stability for their charges that they try and prevent changes that allow for increased productivity. The owners of the factory find that the only way to stay competitive is to move somewhere the union has no reach.
Unions have their place but then they don’t. Change is constant and any entity that tries to prevent changes ends up in the end being left out. Management will always find a way to benefit itself.
I think that companies that want to pay ‘India’ wages should move to India. I pay way too much in all kind of taxes to maintain the environment that these ‘companies’ take advantage of.
GS: You can’t allow businesses whose views are as short as the next 4 quarters to do whatever the hell they want. They basically have fired every American employee and have replaced them with Indians. If it is 10% Indians, I’d say fine.; even 20% would be fine. When it becomes armies of Indians, then you have to draw the line somewhere.
Just drive around most of these big tech companies around lunch time and see armies of Indians walking around. This is not anymore just about cost, but about the fact that Americans have no jobs while you have armies of Indians working for all these big tech companies.
I’m not saying don’t restrict H1b. All I’m saying is that on the flip side expect to pay more.
Cyrus says, “GS: You can’t allow businesses whose views are as short as the next 4 quarters to do whatever the hell they want. ”
Really,,, Cyrus should be allowed to tell a private business how to run their business.
If you know so much why don’t you start your own business and get rich….
“How the hell all are all software companies throughout United States full of Indians? ”
The software industry’s foreign hiring practices are dwarfed by those of the pharmaceutical/ chemical industries. Pfizer, Merck, etc hire mostly Indians, Chinese.
The bias is blatant and shoved in your face under the neoliberal facade of diversity and inclusion.
Cyrus,
The phony Indian credentials has been a pet peeve of mine since I first discovered it in the early 90’s. One Indian guy I had to work with was so unqualified that I finally asked him about his educational training. He told me he got his degree in computer science by reading a programming book cover to cover. I think it was a C programming book. Those degrees are mostly bs.
I had to train a handful from Tata to take my job before I was let go.
I have had a few friends who lost their jobs in exactly the same way. Only one is now working in the industry. The rest of them just gave up.
ditto
I work at one of the big ones in the valley, one large meeting counted pretty nearly third north american and european, third indian, third chinese (or thereabouts). Im from Europe. Note that this actually reflects an almost balanced distribution relative to population — which is only possible if visas are not a significant hurdle, which I guess they are not.
Also let me make it clear: all colleages I work with are very competent, whatever their country of origin. Most of them have been in the us for many years now in the same or similar job and/or in college or grad school. Also worth noting that none of what we do requires a phd, though many have one, that is only beneficial when competing for the job, I suppose.
Such ban will lead to the loss of jobs in the US. Most tech will simply move to other countries (or stay where it is today, if it’s already outside of the US).
It’s not the race for a cheaper worker that drives companies to apply for H1Bs, rather it’s the lack of skilled Americans. I employ an H1B person, and believe me, it’s a nightmare to bring one into the country.
Imagine if imported labor (like a physical product the new President is talking about) was slapped with a 35% fee. That would likely make the H1B a bit more expensive.
It also may force some companies to operate like they did before cheap labor dominated the markets. That is, provide *gasp* employee training on things that may be needed to keep the business going forward (don’t H1B’s somehow get training to know what the heck they are doing)…or does that only apply to the management tier nowadays (I see managers going off to training all the time).
Sergey,
I have worked in tech for the last 25 years, and I am calling BS on the “lack of skilled Americans” comment.
It is a race for cheaper workers. It’s also about workers that are basically indentured servants and can’t leave a job. Leave your job = lose your visa. Back to your home country in a matter of weeks. Visa holder wants you to move from Boston to Houston in 2 weeks. Move or lose your visa. Visa holder wants you to work 6 days a week, 12 hours a day. Do it or lose your visa. This is the reality of the situation. This is how the process really works. As far as equitable pay, just check out the recent DOL case against Oracle.
And please tell me what special talent it takes to be a QA tester? A junior developer? (Read “Entry level”, and feel free to pick any type of programming you like. ) These are most of the “highly skilled” technical jobs that are being filled by H1B visa holders.
I work with on shore (H1B) and off shore every day, and all I can say is, for every single US Citizen I knew and worked with that was outsourced or H1B’d. It took a MINIMUM of 2 H1B onshore, and as high as 4-5 offshore “resources” to do that one persons job, and over time, code quality and performance always dropped. It never improved. Quality code is almost non-existent anymore.
Problem solving (analytical thinking) and independent/creative thinking are a whole different set of problems.
So believe me when I say this. It is a race for cheaper and immobile workers. It has a nice synergy with the stock buybacks to keep shareholder value where it needs to be.
Based on your comments, I have to give you the benefit of the doubt that you personally may have required someone with a highly specialized skill set, along with one or more advanced degrees in hard science. But in 85%+ of the cases, this is just not true.
For some one who has been writing on this subject for years, I recommend the “Norm Says No” blog by Norm Matloff. Just google it.
That is not true; most companies simply let the Indian outsourcing companies take care of the process. I’ve been reluctantly through the process for hiring a few H1-B’s, and the company that I worked for simply let the outsourcing company take care of the requirements. A few documents were necessary and the legal department easily took care of that.
You might have tried to do it yourself directly rather than rely on the outsourcing company to do it for you. Pay them a few thousand dollars more and they will take care of everything for you. So, the process is not difficult at all.
From where I sat, the H1-B’s came about in the fallout from permatemp lawsuits against Microsoft and UPS. In the dotcom era, companies I am familiar with would hire temps and would keep them there until their skills increased and budget was there to bring them on full time. It might be 6 months for some, it might be 2 years (or never) for others.
As this practice was cracked down on companies started to slowly move to using contract workers from other companies. In the mid-2000’s companies started to make use of the likes of Infosys and WiPro for this, and they brought the H1B’s because they are an Indian company.
I don’t have an issue with Indian workers per se. The dividing line on my interaction seems to be that those schooled in Western universities are great. The ones from Indian universities seem to be needy and not really motivated to problem solve or troubleshoot. They can perform their niche job, but if there’s a need to read documentation or research an issue, perform trial and error, etc…they will try to find any avenue for someone else to do that for them.
so what?
There’s still plenty of people making 100K plus easily in Bay Area
and burger flippers make $15 and hour
the economy is great… new cars everywhere, stocks up… rents are strong… where’s the problem?
Apartment rents have been dropping since Nov 2015, by quite a bit … did you miss that? The City budget has a deficit, despite that glowing economy, and that deficit is going to get much worse next year, so budget cuts are on the menu. Lots of interesting stuff happening.
That wasn’t snark?
You might be right. I was wondering about it. I compared it to some older comments Ehawk had made and decided without any evidence whatsoever that it wasn’t snark. But now that you also bring it up, I’m doubtful…
Ehawk can you elucidate us?
Some of this weak demand in office space can be attributed to the fact that more and more people work from home.
I’ve been in this industry more than a decade; only a few companies are cool with working from home.
HP, IBM, and Yahoo! have all reverted back to ‘must be in the office’.
I know about Yahoo!, but I also hear about people working from home more and more, including other large tech companies in the bay. Flex offices are very popular.
Working from home is becoming more common in the bay area, but mostly due to the deteriorating traffic conditions, BART delays and other factors leading to brutal commutes. There are many days when half the employees in my office attempt to travel in but give up and return to work from for the rest of the day.
Companies do fight tooth and nail to keep workers in the office. I asked to work remotely and was told “no we don’t allow it”. I then told them I was leaving, and they let me do it (apparently they couldn’t find a replacement).
It’s still a bit tenuous as there are some sticky legal/tax issues in my case, and at whatever time those get too be too much hassle for them I’m sure it will come to an end.
Sergey,
I do not agree with your overall premise. American businesses want the cheapest labor including professionals they can get. They bring the H1B visas here because they are cheap indentured slaves. There are plenty of american STEM graduates. American business management priority is clear as the share buybacks they engage in.
Revoking H1B visas would cause a boom in hiring American workers. If they move offshore trump can ratchet up their taxes. Wolf has documented the insincerity if IBM, that company needs to be taxed into oblivion.
Michael,
Although I generally agree with what others posted in this thread about the situation and the reasons that lead to it, I am yet to see viable solution. Revoking H1B visas will make American tech companies less competitive, some (IBMs of the world) – bankrupt, and the Trump import tax will be very difficult to collect on an offshore, especially starting, company.
We are constantly assessing pros and cons of moving our business elsewhere (South Korea and Portugal top our list). And I’m sure we are not alone. A small change in macroeconomic conditions (labor cost, taxes, tariffs, real estate market) can force many companies reconsider their investments into the Bay Area or the US.
Lots ofs specialty helicopter pilots are visa-ed to work in the US. Why? While there are a zillion surplus military pilots, they cannot long line or bucket fires. They don’t have the skills and there isn’t much call for rotary pilots to just fly from A-B.
Ban all foreign workers, sure…just don’t do it in fire season.
But IBM stock price went up today!!! Yay, maybe they’ll take more space in the city.
Watson is Virtual; he doesn’t need more space :).