Or Why Consumer Spending Has Been Dragging for Years.
One more thing about the new Census Bureau’s Income and Poverty report for 2016, which found to the great excitement in the media that median household income, adjusted for inflation (via CPI), rose 3.2% in 2016 to $59,039 – finally a tad above where it had been 17 years ago.
We already found buried in it that inflation-adjusted earnings from wages, salaries, etc. for full-time employed men have fallen 4.4% since 1973.
So now, we’ll look at another data set buried in the Census Bureau’s report, which is based on respondents at 98,000 addresses across the US. We want to know which households were the lucky ones – and turns out, there weren’t very many.
“Earnings” in this report are the fruits of labor – so wages, salaries, and the like. “Household income” includes not only “earnings” but also money from other sources during the year. These are the sources of “household income” in the report:
- Earnings
- Unemployment compensation
- Workers’ compensation
- Social security
- Supplemental security income
- Public assistance
- Veterans’ payments
- Survivor benefits
- Disability benefits
- Pension or retirement income
- Interest
- Dividends
- Rents, royalties, and estates and trusts
- Educational assistance
- Alimony
- Child support
- Financial assistance from outside of the household
- Other income
This is critical when looking at the income distribution as to which households had the most income because proceeds from investment (#10, 11, 12, and 13 in the list above) play a big role in households with large investments.
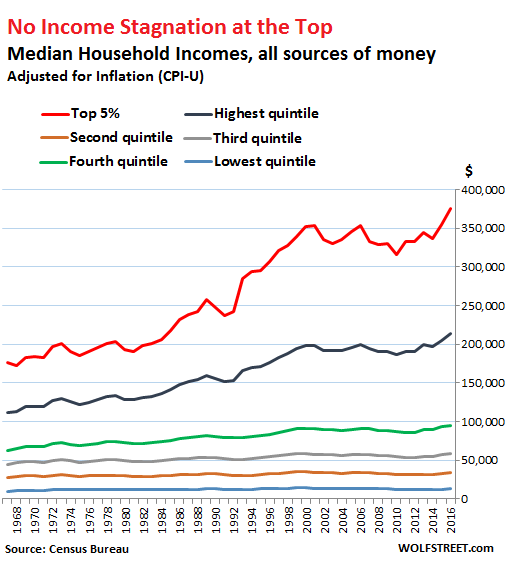
This chart shows the top 5% of households (red line), whose inflation-adjusted household income has soared by nearly $200,000 (112%) since 1967. Compare this to the bottom 60% of households (three lines at the bottom), whose incomes have booked tiny gains, with the bottom 20% gaining just $2,900 in household income over the past 50 years:
Some observations:
For the bottom 40% on the income scale of the households (the bottom two lines in the chart): Household income adjusted for inflation for the lowest quintile has dropped 9.5% since 1999; and for the second lowest quintile, household income has dropped 2.4% since 2000.
Households in the third lowest quintile (40% to 60% on the income scale, purple line) have now finally squeaked past their prior income peak in 2000, but by less than 0.5%.
Households in the fourth quintile (60% to 80% on the income scale, green line) have done reasonably well, gaining $33,000 in annual household income (53%) over the past 50 years, and $4,000 since their prior income peak in 2000.
The top 20% of households (dark blue line) have gained $101,000 in annual household income (91%) since 1967 and are up $15,000 from their prior peak in 2000.
This group includes the top 5%, where the music plays. Their prior income peak was in 2001 at $353,000. In 2016, they booked $375,000. These households now make nearly $200K more on an inflation adjusted basis than they did in 1967, a 112% jump.
Also note how household income in this top 5% category fell sharply during the Financial Crisis, and how the Fed’s monetary policies, designed to create what Bernanke called the “Wealth Effect,” effectively created wealth and income for them, benefiting the most those households with the most assets. Hence, incomes from their investments began to surge in 2010. For them, the Fed, personified by Bernanke, was the guardian angel — while the middle class was getting further hollowed out, with the bottom 60% getting shafted.
Thankfully, the Census Bureau did not provide data on the top 1% or the top 0.1%. It would have made that chart look absurd.
And on second thought, for an economy based on consumer spending, strangling the incomes of 80% of those very consumers on whom the economy relies for growth, while bailing out and enriching a tiny group at the top, doesn’t quite appear to be an effective economic model over the longer term.
Buried in the annual income data from the Census Bureau are some facts that the media silenced to death. Men, sit down. Read… The Terrible Facts about Real Earnings of Men
Enjoy reading WOLF STREET and want to support it? You can donate. I appreciate it immensely. Click on the mug to find out how:

![]()
Census Canada reported the same bs yesterday and Agora Financial is saying that the way these incomes are measured changed in 2013 so this is an apples to oranges comparison.
In 2013, the Census survey was split into two, with one set of respondents getting the old income question and the other set getting a “redesigned” income question. The Census reported both sets for 2013. The redesigned income question had mixed impact in 2013:
For the lowest quintile in 2013, it lowered income by $49 that year, or less than 0.5%.
For the other quintiles, it raised the income in 2013:
+1.0% for second lowest quintile
+ 2.7% third quintile
+ 3.5% fourth quintile
+ 4.7% highest quintile
+ 3.8% for the top 5%
2014, 2015, and 2016 have been consistent, with no additional changes in the question.
Meanwhile, healthcare costs have risen from 5% of GDP in 1960 to 17.5% of GDP today.
https://www.thebalance.com/causes-of-rising-healthcare-costs-4064878
A lot of people’s income is being diverted to this sector, while the menu of health care options available to the average American has gone down.This must be the single biggest source of the lopsided transfer of wealth.
I’d say the biggest transfer of wealth has been reflected in housing/rent costs, but health care costs are certainly up there.
In the greater Denver metro area its just about a dead even tie depending on the neighborhood in question as well as which health insurance you subscribe to . For us in tawny GV ? Home ( purchasing* ) prices by a long shot !
* rentals have remained relatively stagnate since 2014
And for those who have children, let’s not forget education.
Education? How about childcare!!!
The American is a joke nowadays! You gotta be asleep to believe in it. I dont know how anyone making less than say $80k a year can afford a normal middle class lifestyle with kids and not go into some sort of debt. It’s all planned, that is where the cognitive dissonance lies.
Education is free. Schooling is expensive
I’ve had a prescription I take, which was $60 for years on end, recently more than double in cost. So that’s where some money’s gone, that I won’t spend at other places.
It’s become an economy of trickle-trickle-trickle. Last night I caught myself cleaning my camera lens with my T-shirt again, and my T-shirt was not too clean either, and I seriously asked myself, after spending a few hundred on a camera, I can’t pop $10 or so for a Leupold Lens Pen? I’ve wanted one for a few years but every time I’m in a gun store where they sell them they’re full list price, $15 or $20, or they don’t have ’em. So I jumped on Amazon and will pick one up from the Locker this Friday and it cost me $8-odd.
And the ride downtown will be on my bike to save me $6 on public transpo. That’s how it is, we’re counting nickels and dimes and saving buttons and string. I’ve done it long enough that I don’t feel I have to do it now, but for years I did what I call EPI-EPO accounting. I wrote down literally every penny in, and every penny out, of my life. It gave me a good idea of what I was spending on things. It’s a great way to discover you’re spending $200 a month on Cokes at work, or that that morning “tall” Starbucks could be buying you an iPhone X.
Ohhh boo hoo!!!
Try paying $1000 a month in childcare!
It isn’t just cash starved but also limited access to justice for the average person read the blog Coin and Country on regulatory oversight. Maelfeasance
Traditionally healthcare costs weren’t a huge concern because good employers relieved the burden of the cost by giving their employees decent healthcare.
However with the increase in part-time and contract work(gig economy crap) more and more people are having to deal with the full burden of paying for decent full coverage health out of pocket.
My plan through work at a big company costs me $500 a month out of pocket to fully fund an HSA and cover premiums, with pretty much 0 chance of paying anything beyond that since it covers my out-of-pocket max.
Similar plans I have seen on the open market easily cost $1200+ dollars a month for a family, and they have worse out-of-pocket max terms meaning you risk spilling over your fixed monthly cost to cover care.
The biggest transfer by far, is from small savers to the Too Big To Jail members.
The Fed, and all their Central Bank brethren, have exercised their legal but immoral privilege of killing the market setting of interest rates.
See blog Coin and Country re further on exactly too big to jail operates in Canada
” Meanwhile, healthcare costs have risen …….. ”
…. as well as education , food prices , cars , durable goods , housing ( in most areas ) etc. in fact almost everything but oil and gas prices have gone thru the roof . Hell … wanna take a wild guess what it costs a parent with a child participating in one or more sports/activities at the public H.S. in my neck of the woods ? Try $5k – 11k depending on the sport / activity ! $11k ! Thats more than I paid for four years of college in the early 70’s !
So yeah … much like the ‘ official ‘ unemployment numbers that only take into account those unemployed still eligible and receiving benefits … these census bureau statistics are all but irrelevant verging on manufactured fantasy . And thats coming from someone who ‘ statistically ‘ is well ensconced in the upper middle class verging on lower end ‘ wealthy ‘
Hi Idaho Potato,
Its a massive shame in the USA there’s not a National Health Service similar to the UK, where its about service and not profit.
In the UK the NHS as its called is always screaming for extra money but if your population due to uncontrolled immigration goes up by 10% in 10 years its going to be. Even with that in mind the service is fantastic.
The only thing missing in the UK is that the government doesn’t have its own government owned drugs companies-drug research companies and kill off private sector drug companies completely and reduce the cost even more.
Or how about opening up the drug industry to massive global competition??? Most US drugs are produced in places like India and Turkey anyways. India produces generic, GMP drugs at a 1/5 of the cost that the US does. You talk about more government??? The UK is a tyrannical cesspool. The alphabet agencies in the US like the FDA drive the costs of RX medications through the roof while killing thousands a year with dangerous drugs and medical devices. It really is a legal mafia. Thanks but no thanks I dint need more government in my life. US doctors dont need to make $200 an hour to provide basic healthcare and write prescriptions, sorry.
But is this based on their income now or before? So if you moved from one quartile to another, do you stay in the lower one for the sake of the graph? My household has gone from the lowest quartile to the highest over the past 7 years as my wife and I completed college and got jobs.
… the question needing to be answered though is ..
Despite your both crawling up the economic ladder how much debt incurred by those degrees are you carrying on your backs ?
None, I joined the Marines and my wife was on an athletic scholarship.
Now your household would be counted in the highest quartile. Seven years ago, it was part the lowest. This data set goes year by year, independent of where that household was in prior years.
However, there are other data sets in the report that show household mobility, up and down, in and out of poverty, etc. So your household would figure in that data set.
The new proposed tax plan will leave, middle income families with dependents, with even less disposable income than they have now. In my own case, because we still have a dependent millennial, we will pay taxes on another $850 of income. The more dependents you have, the worse the hit will be.
For families with dependents, not having the individual deductions, will push their taxable income up, and may push them into a higher tax rate as well. This will be a tax cut for the rich and a tax increase for most of us.
Feature not a bug.
Totally agree. Why is a multimillionaire given a tax break while a single mom gets a tax hike?
I can’t wait (sort of) to see the details of Trump’s plan.
Can the single mom cough up the money to buy ( read contribute to re-election of ) a member of congress ? In most cases I doubt that, so there’s the answer who the people are who end up holding the shitty end of the stick.
Does the public ever see the details of laws before they get passed?
This is a top-down edict driven country which completely ignores the wishes of it’s citizens.
Petunia – Who do you think the big T will favor? His base? The working and middle class? Nope! The rich boys.
What I mind is the lies. Most republicans admit they prefer the rich and their interests.
Given that there is still no real tax plan. The last items I saw out of the house did not talk about eliminating personal exemptions as they did during the campaign.
They were still talking about scrapping the state income tax deduction though.
I would prefer they still leave some sort of exemption or credit in place to give relief to families with larger families. Seems to align with American values and I don’t hear many complain about it.
As I have commented, I advocate a ‘Modified Flat Tax’, but as part of that, I do not believe we should have mortgage tax deduction. A married couple can deduct the interest paid on first and second mortgages up to $1,000,000 in mortgage debt.
In the Bay area a million bucks doesn’t buy a luxury home, but in much of the US, it does. Those of us who do not have a mortgage essentially subsidize the affluent that have, for example, a $1.5m home half paid off, and a $250,000 second home with a full mortgage.
I understand the reasoning of the tax deduction; which is to foster home ownership, but IMO it should be eliminated.
Income from employment should be taxed the least and profits from employing Americans should be taxed the least.
After all, the greatest source of economic benefit to this country is getting employable people employed.
Speaking of healthcare I just got treated for arthritis/ high inflammation by a rheumatologist in Turkey and it didn’t cost me a penny including two prescriptions and blood work
Frederick I love your posts. Firstly, I follow the blog of one Marvin Naylor, a busker, or street musician, in England. He talks about blithely going to places like Turkey and it sounds so exotic, and then I did the geography and realized it’s like me going to Dallas.
And your posts give a look at a life that’s different than the US. Things seem so much easier and things seem possible.
Alex If you live a simple life without all the frills you can live better here than in the states Luxury items are really out of reach for most but nobody starves , goes homeless or without medical care though
My mother in law a retired teacher gets around 650 dollars a month pension has a nice apartment( mortgage free) and lives reasonably well
Meanwhile, demographics are playing an increasingly large segment of the survey results. As the boomer generation retires at a rate of 10,000 per day for the next 10 years, as the lump in this population snake passes through.
This will continue to skew income results lower and governmental liability programs (pension, medicare, medicade, disability, etc) higher.
The biggest generation of all, the millennials, are moving into the workforce, more than replacing the boomers, and this is too is impacting the stats in various ways.
Wolf – It was not that long ago that the millennials replaced the boomer generation as the largest population segment. This had nothing to do with more millennial births than boomer births, but rather the eroding of boomer numbers by ever higher levels of deaths.
During the early boomer prime working age, there were 10 workers to every retiree. This worker to retiree ratio has now degraded at 2:1
The millennials may have replaced the boomers in numbers, but not in numbers of support workers for the system.
https://www.youtube.com/embed/hLpE1Pa8vvI?autoplay=1&autohide=1&showinfo=0&iv_load_policy=3&rel=0
Let them eat cake ..
The Yellen- cake, for the “little people”. There’s a few crumbs, too,
on the floor.
Gee, 18 sources of ‘income’ – while nice to know it also means that once you have a certain amount of one it then excludes others.
At which point and ‘family’ makeup does one cancel out another? What sources of income max out the total income of family units at various levels of income?
Here in Oz you are means tested for such things as unemployment, pensions, and other government benefits. That means test includes both assets and income (even if your assets are not earning income they are deemed to make a certain rate!!!)
For example, as I posted before, the worst family unit composition here in Australia is a ‘family’ of two with one working and one retired with no children.
Your effective ‘tax’ rate or the rate you lose income can be as high as 60.5% even at the 32.5% marginal tax bracket because of loss of government income.
Even at the next lowest income tax level the rate can be as high as 45%!
What that means is that even if you were “lucky” enough to work overtime and get double your normal rate of pay, your take home rate of pay could be LESS than you would normally make per hour. If you were on an income in that 32.5% marginal tax rate area it would mean about 80% of your normal wage.
You’d also have to be careful about working overtime if your overtime income pushed you over the A$37,000.01 income level, you’d lose other benefits as well making that 45% effective tax rate even higher for those on lower incomes.
And those calculations are even before adding the cost to get to work……Why even bother to work extra hours?
Huge consumer cost that didn’t exist 10 years ago – cell phones and cell phone services. And that cost hits even the lowest quintiles.
Cat, not sure if you can compare phone service because I remember the days of Ma Bell and 10 cent per minute phone calls ( when dimes were real silver) and long distance was metered with an egg time, it was so expensive. I bought an Ooma system in 2009 and haven’t had a phone bill in 8 years. I don’t own a cell but have had them. I got rid of mine because I don’t like wearing a leash but with GPS built into them the days of wasting gas trying to find a street is over. Still, you have a good point when cable TV and computer service is factored in, something that didn’t in the baseline of 1973..
You can get decent phone service with 1 gig of data for $20 a month. Budget phones cost maybe $200 new, most people will give you an old iPhone if its more than 2 generations old. Plans are $15 if you forgo data, and you use public free wifi when you can. Smart move in most cases.
Having an iPhone or a $50+ dollar a month plan is a luxury.
Phones are not a burden.
If you are broke but need a phone for work, you find a way to pay $15 bucks a month, get a used phone and use free Wifi at a library or coffee shop. Its never been cheaper to stay connected.
“The average rate paid by residential customers for unlimited local touch-tone
calling rose to $19.98 in 1995” just for some reference.
All of our communication has free fricken long distance too.
If you are willing to forego data you can do a lot cheaper than that. I am one of the troglodytes that believe a) a phone is supposed to be a phone and b) the best phone is the one you have with you. I use a cheap flip-phone that stays in my front pants pocket. I use Page Plus Cellular since it runs on the Verizon network (good coverage). I bought a 2000 minute card for $80 that is good for the year. Minutes roll over and I’ll never use the 2000 minutes in a year, so I’ll buy a $10 card good for four months (and another 100 minutes) three times a year until my minutes get low — if ever. So ongoing costs will be about $2.50/month. This doesn’t work if you talk on the phone a whole lot, but for the occasional call and being able to be called it doesn’t get a whole lot cheaper than that. Sadly Verizon (and thus PPC) has made it harder to get cheap flip-phones that work on the network, but I think it is still possible. Just another view if you want to do cheap. My wife has a smartphone on Cricket, by the way, so different strokes….
Check this out too: https://transition.fcc.gov/Bureaus/Common_Carrier/Reports/FCC-State_Link/IAD/ref97.pdf
1986: average for unlimited local calling cost $16…
You can get better service today for the same cost. Its true having your own internet in home is a new cost. Budget runs $25 average.
My takeaway is:
1960s: 200k income, 100k new home in LA
Today: 400k income, 1m crap shack in LA
And that’s just housing. Don’t even get me started on healthcare and education. No matter how much money you make, cost of living is increasing much much faster.
Wolf,
Is it possible to break the investment numbers out of it, 10-13? In other words, I’d like to see the real goods/services economy. Why do we ever include income without labor??? This sets back economics 500 years.
Yesterday I reported on “earnings” (wages, etc.) from full-time labor by itself for men and women, per individual. This was the #1 item on the list of sources of money for total household income. This can also be split up in other ways (such as by race, etc.).
Today (this article), I reported on “household income” from all sources of money, including labor, by income level.
The Census probably has a way to sort household income minus certain sources of money (such as #10-13), or these sources of money by themselves. But I don’t have access to its data base. I only have access to the reams of data it published yesterday… all in separate spreadsheets. And there are a ton of them. So to get household income minus items 10-13, I’d say it’s possible, but it’s beyond what I can do ;-]
Sure it would interesting to see how investment income is divvied up. But I don’t think you’ll see a lot of surprises in it.
Copy that. Thanks, Wolf.
Wolf
What is the ratio of Government, FIRE, Medical/Health Income vs. all other income?
In other words, the ratio of riders to horses.
If you have one or two jobs in the black market, plus few benefits
from the 1 to 18 list, your real income, – after taxes that you
don’t pay, – is much higher.
Net income can be competitive with mid income, though unstable.
Many in the lowest quintile have the knowledge & experience, in
slick moving, in and out, to hunt premium from the 1 to 18 list.
The “experts” w/ PhD in economy & statistic are totally blind to what’s
going. Have no clue.
For the lowest quintile, the 1 to 18 list is an insurance, a safety list that
became a must.
They stay under the radar, undetected and the authorities cannot
and are going to fight.
Two cooks starting at 4 AM for few hours can make more than
engineers.
A waitress returning home at 2 AM from work always with a lot of cash.
The 3rd to 4th quintile disrespect them and think they are inferior, but the lowest quintile laugh at those idiots, who pay their income and feel superior.
The best thing for both groups is that they never mingle together
socially ( not at work) and rarely communicate privately.
They live in different, parallel world.
I know exactly what you mean.
In FL and NY the immigrants legal and illegals make a ton of money compared to everybody else. They get every govt benefit they can squeeze out of the system and work for cash. The Spanish TV stations indoctrinate them openly before they even get here. If they get a regular job they make sure all their friends get hired as well. If there is a scam they can benefit from, they do that too. A lot of this money goes straight out of the country. I am totally disgusted with it.
They drove me out of NY I had taxes to pay and a mortgage as well as insurances and extremely high food costs My ex boss replaced me with two kids from Central America for half my salary I had to sell before I wasted all my savings away
Those kids are bused in from a low cost area and live 20 in a small rental house don’t pay taxes and many get free medical and EBT cards I’ve seen it at the grocery store
When people say they are only taking the jobs Americans won’t do I know it’s BS
Michael Engel – very good point.
I’m behind with the IRS and need to get caught up, but on my income of $12k I need to set aside $200 a month just to keep even.
Keep in mind I ride a bike or take the bus, no car, and live in a warehouse with no running water. There’s a porta-john. I don’t recommend living this way unless you’ve lived significant amounts of time in “field conditions” which I have.
So that IRS bill is my biggest bill.
If I just go out and play my trumpet Friday-Saturday-Sunday each week, I can bring in $60, and if I do that every week, that’s a little over 3 thou. That’s a huge amount of money for me. And it’s completely black market. Cash. And probably a good number of people, as people tend to look down on street musicians, think I’m feeding an addiction, homeless, mentally ill or “slow”, etc.
And there are people I look down on, too. The “scrappers”, the scroungers out there with their Mad Max bikes and Mad Max bike trailers, out hustling around, hauling ridiculously large loads of stuff, in rain and shine. Some of those guys and gals are probably making $100 a day. My main work, the work that’s on paper, pays me about $35 a day. Yet I look down on the Mad Maxers; I kind of have to. Befriending them leads to entreaties to borrow money, possible fights and drama. So when I take equipment apart I’ll leave the scrap metal out front for ’em, and I’ll leave stuff I don’t want out front for ’em like clothes I no longer want, toiletries i don’t need, just the surplus stuff even a frugal person like me ends up with extra, and I’ll say a kind word now and then, but I keep a “wall of respectability” up between myself and them.
Scrap metal? You mean there’s still some left for them to take? I’m shocked
If it’s not nailed down …
Its hard to put a finger or stat on how prevalent problems like this are. People who work for tips are generally famous for paying next to no taxes on those tips. And of course there are jobs that would rather pay under the table cash and people willing to take them and spend a lifetime dodging taxes…
And it is definitely true that there are 6 figure bartenders and waiters out there that are probably in complete poverty on paper.
People who do that are basically non-violent criminals though. And living a normal high income life is hard when you have hidden income. Makes it hard to get loans and normal stuff that people do that require income verification. Though there are always ways to cheat.
I also can’t say I am a huge fan of racial clicks formed by immigrants where they take over whole job sectors and practice blatant favoritism based on shared race and not skills. So I guess there is no away around their being a lot of animosity for people in a position where they have to break into these insular markets.
I do feel like to a degree every job sector is type cast. If its not based on race, it is based on education, gender, looks, money, intelligence… And there is bound to be strong animosity if you have the skills to fill a job you want but are getting marginalized because you don’t fit the profile.
Governments and companies excel at seeing this problem in some areas and ignoring it in others. Ideally every job would be happened upon only based on skill. But human nature always seems to drag us back to one tribal member wanting to help another a little more than the other guy…
Was hanging out with some friends and one of them is from an Asian descent. He was telling us about how his family was upset when he rented a house from someone not from their race. Kind of amusing, but I wonder if that has something to do with how all the Indian migrants in my area can afford to grossly overpay to buy houses.
michael Engel
There is another factor in this “black market” income. Most low-income people cannot survive without it.
Look at it this way, when a low end job comes up for bid, there are many bidding on that job- i.e. the “free” market. And the price of labor tends to fall. But when the chairmanship of the Fed comes up for bid, the “free” market is told to go away.
“Also note how household income in this top 5% category fell sharply during the Financial Crisis”
This says it all but is no real surprise. Most people hitting high incomes do so likely in large part through investments in stocks an assets.
Its pretty clear that somewhere around the beginning of the top quin-tile of earners or that 20% mark you start to escape the slump that earnings have fallen into for the majority of the middle class.
The top 20% of incomes in the US for a household is sitting around $110k per year.
However another interesting stat to consider is that around 60% of Americans will earn an income in that range for at least 2 consecutive years during their working lives. I don’t think we can be completely honest about what these income brackets mean without discussing the fluidity of peoples earnings over a life time.
One potential take away from this is that a massive amount occupations that all pay middle income salaries have seen terrible wage growth. Which I think comes as no surprise.
By today’s standards once you start to breach $300k house hold income, even with a small family, the sky is the limit since that means you potentially have much more free income to invest in assets like property, invest heavily in stocks, or attempt to start a business.
Not that there aren’t people in those brackets with large families paying for private schools, ivy league colleges that ended up with little to invest outside of an expensive house in a major city.
Here’s a decent write-up on what we’ve become, all science-y too.
http://science.sciencemag.org/content/early/2017/04/21/science.aan3264.full
Wolf. Not sure if you saw….
http://www.mercurynews.com/2017/09/14/tip-of-the-iceberg-more-on-the-sunnyvale-house-that-sold-for-782000-over-asking-and-what-it-all-means/
This is how the media and real estate brokers collude to whip the market into frenzy (local papers make a good part of their income from real estate ads in their housing sections and elsewhere). Brokers will tell the reporter some stories about “over asking,” without mentioning that this entire “over asking” thing is a tactic to create bidding wars, and even if there is no bidding war and only one bid. The industry uses articles like this promote the scheme. The oldest trick in the book. And terrible journalism. Not even “journalism. Just a promo piece. And a daily fare.
“Over-asking” in theory means that the house was mispriced to begin with. If it happens a lot, it’s a sign that it’s on purpose.
Also, there are no stats in this article. Like what percentage and by how much “over,” “under,” and “at” asking. What percentage of the homes sold over asking and under asking? I get those stats for San Francisco. This is available. Why not mention it? Well, there’s a reason why they don’t mention it.
I’m surprised that the top 5% has the high income it does. I know very few people that I think make that much and I’m in the generally more affluent-than-most-areas SF bay area. Though maybe if I knew people’s incomes I’d be surprised by some small number that might have more income from investments and other things than I know about.
We are doing ok in comparison to many people I know by not being seriously pressed to make ends meet every month. 5% is 1 in 20 and even here, I don’t think I know 1 in 20 people making that much, even among DINK types (dual income, no kids) with lots of education and non-blue-collar jobs.
Is there some kind of exclusive club for the 5% (never mind the 1%) where they never interact with anyone outside their income band? Because I find it a bit shocking that top 5% is so high.
Though I suppose if the top 1% or 0.1% are making crazy high incomes then the top 5% is deceptive in that maybe 90% of that 5% might not be making more than the average income shown for that bracket.
My wife and I both work in healthcare. Early 30s, no kids. Both work full time. You wouldn’t know it we make a top 5% income by our spending habits.
We rent, but are saving up for the minimum $150-200k down we need around here. We max both 401ks and save post tax dollars aggressively on top of that. No fancy cars. A few trips a year but we always fly coach and never stay anywhere expensive. No need for status symbols like watches or jewelry. We shop at Costco and eat out 2-3 times a week. I take my own lunch to work.
In our view, financial security and early retirement (50, hopefully) will be far better than any stuff we could buy with the money.
Alex, call the IRS and settle with them for better installments on
4% to 5%.
With big banks credit cards you might pay 15% to 27%, they will
not voluntarily write off a dime.
Greed is bad, cash is good.
A cleaning lady in Long Island spend most of the time listening
to her wealthy employer dirty family secrets, bedroom secrets and
tons of complains.
Her rich husband completely ignore her daily cannonade.
The cleaning lady makes more money than her partner, the father of their two kids, who employ 20 piecework workers, a lot for cash.
The cleaning lady became part of the wealthy family. She gets Xmas bonus, in cash, other gifts and even jewelry. She is invited to every family event.
She has other wealthy customers, few more jobs, all off the table !