Lured by the siren song of a “buying opportunity” and a fat yield.
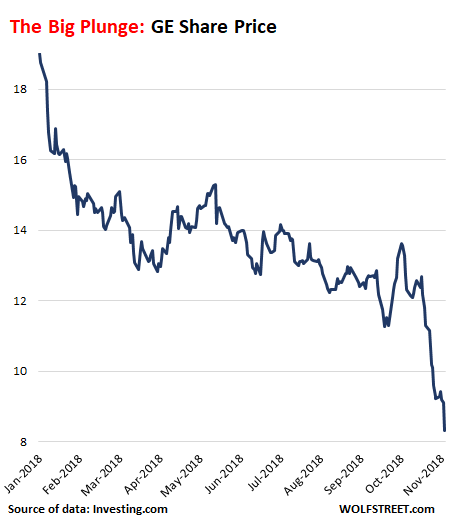
GE shares plunged another 10% this morning to a low of $8.15 before recovering a little. They’re now a big step closer to the Financial Criss low of $6.66, which had been the lowest since the early 1990s. And for most of the year, retail investors – as measured by clients of TD Ameritrade – were net buyers of GE and bought the dips, lured by the Wall Street siren song of a “buying opportunity” and a fat dividend yield.
But that sacred dividend was unceremoniously slashed a second time while people were distracted by Halloween, to a penny this time, and the fat dividend yield suddenly is near-nothing. GE, which lost $23 billion in the third quarter based on a huge write-off, is in the process of dismantling itself to deal with its debts and stay alive, after “unlocking value” by blowing and wasting $40 billion [corrected amount] in mostly borrowed cash since 2012 on buying back its own shares.
It now is buckling under $263 billion in liabilities, not counting any off-balance-sheet liabilities. Its accounting is being scrutinized by federal authorities, GE disclosed. And there are fears that some unknown unknowns might emerge. GE has been shedding divisions and assets to shrink itself to health, and as it is dismantling itself, there are fewer business units available to generate cashflow to pay for this debt.
These liabilities are so huge in comparison to its remaining assets that when the $79 billion in “goodwill” and “other intangible assets” are excluded from its assets, GE is left with what we call “tangible equity” of negative $31 billion. In other words, this former icon of American industrial innovation and strength has been gutted by share buybacks. GE would be OK-ish today, if it had not wasted $40 billion on monstrous share buybacks to “unlock value” to please activist shareholders and Wall Street.
The plunge-du-jour has been triggered by a brutally hype-free note by JPMorgan Chase analyst Steve Tusa, which he accompanied with a cut in his share-price target to $6, the lowest among Wall Street analysts.
The report cited surging liabilities (see above), weakening cash-flow outlook, and lousy Q3 results on “almost all fronts,” including a 33% plunge in revenues at GE’s largest division, its power division. And then this (Bloomberg):
“While the stock is down about 70 percent from the peak of $30, this move still does not sufficiently reflect the fundamental facts,” Tusa wrote.
“We are skeptical around calls for a bottom until management resets EPS expectations that are closer to free cash flow, something we believe they haven’t done for almost 20 years,” Tusa wrote.
GE’s difficulties, which have been going on in public view for years, were papered over with hoopla about its stupendous share buybacks. Once the hoopla dissipated, the problems came to the front pages. But retail investors couldn’t resist the fat dividend yield (now reduced to near zero) and the lure of buying the dip.
We can get a feel for how retail investors dealt with the stock. TD Ameritrade publishes a monthly Investor Movement Index (IMX) with a comment on what TDA clients have bought on a net basis (buys minus sells). These are the comments concerning GE:
In January, GE plunged 10% from $17.98 to $16.17: “Net buying activity favored the Technology and Industrial sectors, as Facebook Inc. (FB), Amazon Inc. (AMZN) and General Electric Inc. (GE) were net buys during the period,” the IMX report noted on February 5.
In February, GE dropped 12.7% from $16.17 to $14.11: “TD Ameritrade clients appeared to use the pullback in equities markets as a buying opportunity, and were net buyers of equities during the February IMX period. General Electric Inc. (GE) and Ford (F) both neared multi-year lows, and were net buys,” noted the IMX report on March 5.
In March, GE fell 4.5% from $14.11 to $13.48: “General Electric Inc. (GE) was a net buy as shares fell below $13 for the first time since 2009, with a slight rebound late in the month amid reports Warren Buffet may be considering a stake in the company” – April 9.
In April, GE rose 4.3% from $13.48 to $14.07: “TD Ameritrade clients continued to find General Electric (GE) intriguing, and the stock was net bought after the company announced it would merge its transportation unit with Wabtec” – May 7.
In May, GE remained flat, closing at $14.08: “Additional popular names bought include General Electric (GE)” – June 4.
In June, GE fell 3.3% from $14.08 to $13.61: “Additional popular names bought include General Electric (GE)” – July 9.
In July, GE remained flat, ending at $13.63. The IMX was silent on whether clients were net buyers of GE – August 6.
In August, GE fell 5% from $13.63 to $12.94: “Net buying, coupled with increasing relative volatility among some widely held names, including Apple Inc. (AAPL), Facebook Inc. (FB), and General Electric Inc. (GE), helped push the score above 6.0 for the first time since January” – September 10.
Since then, GE shares have plunged another 35%. One “buying opportunity” after another crushed retail investors who still believed in the fat dividend yield and in the American icon that was “oversold” and would surely surge again. And all along, GE shares took the hard-earned money of retail investors with them.
However, TDA’s IMX reports for the months of September and October (released yesterday) was silent on GE and whether TDA clients were net buyers of GE. Perhaps finally, after a plunge of over 50% so far this year, they have turned with impeccable timing into net sellers.
The hail of two-notch downgrades didn’t help. Read… What General Electric Is Doing to Dodge the Question: “When Will GE File for Bankruptcy?”
Enjoy reading WOLF STREET and want to support it? You can donate. I appreciate it immensely. Click on the mug to find out how:

![]()
What is GE going to do about the $22 bn in pension obligations? With GE, investors take precedence over pensioners, judging by all those buybacks with borrowed money.
“What is GE going to do about the $22 bn in pension obligations?”
“Everywhere men yearn to be misled by magicians.”
campaign promises are lies. Politicians make them knowing they cannot or will not fulfill them, but they’re what the public wants to hear.
A politicians primary goal is to remain in power, and to do this they will make promises that they obviously cant keep
many CEO are same as politicians
PBGC probably (taxpayers)
“Jeff’s somebody who brings a wealth of experience to the table. “We think GE has something to teach businesses all across America.” Barack Obama – January 2011
http://www.cnn.com/2011/POLITICS/01/21/economic.council/index.html
i knew i shoulda sold when jeff left. rat.
It’s time to buy shares of General Electric (GE – Get Report) , according to TheStreet’s founder and Action Alerts PLUS Portfolio Manager Jim Cramer.
July 19 2018
It’s time for CNBC to take a look at this relationship.
Cramer’s a bloviate and his wife the “brains” behind the operation as I’m told. He just jammed Sell Side shops with longs & shorts to satisfy his ego. Volume can make up for this but he was getting his eyes ripped out on a lot of trades and he didn’t even know it!
The one thing he is is a marketer and he’s good at fooling the fools!
Never confuse genius with a bull market!
During his market wrap today he plugged his restaurant – twice.
I’ve always wondered, don’t these financial-entertainers owe any fiduciary duty to their viewers when it comes to investment advice, as opposed to simply reporting the financial news?
I just watched a you tube of Jim Cramer saying NO NO NO! Bear Stearns is fine, don’t take your money out!.
How is it he has his any cred left?
It’s time to see whether Jim Cramer was shorting GE at the time.
>…whether Jim Cramer was shorting GE at the time.
Isn’t Cramer above such behavior?
I’m not sure about this but I always suspected the employees of NBC were big investors in GE when it was the parent company. From the look on their faces alone, you could see they were never having a good day when GE was down. Nobody ever asks Cramer whether he has a bunch of shares of GE in his profit sharing plan.
CNBC talkers were big holders a few years ago, and even made cracks on the performance
You are right about the demeanor on big down days.
I’m not saying that rising interest rates are to blame for GE’s issues, but I’m genuinely shocked that such a giant is having issues. This seems to be a given when PE firms get involved, still, can GE really ever stop existing?
As a radiologist, I bore witness to Jeffrey Immelt’s destruction of GE Medical. In the 1990s he laid off all the GE MRI researchers to cut costs in the midst of a downturn. GE would henceforth only cross license all new tech from their competitors and from University researchers, which meant of course, that GE would always be 3-5 years behind their competition.
GE MRI, which at one time had 2/3 to 3/4 of the MRI market, never recovered. In the early 2000s, in another far sighted move, they decided not to build 3T MRI scanners, thinking nobody would buy them. Three years later, as Siemens and Philips started taking over the MRI market, GE finally came out with a 3T, which was a dog of a scanner and worse than some of the top of the line 1.5T scanners by Siemens and Philips.
GE had other dogs- their first digital mammo system was one of the worst and difficult to use systems of all time.
GE’s Centricity PACS was also one of the most clunky and user hostile systems ever.
Through it all, some GE users stayed loyal. The Radnet system in California was all GE, as they were funded by GE Capital. An old Jewish radiologist I once worked for would only buy GE, the only reason being that GE had stepped in to sell Israel its best jet engines after France embargoed arms sales to Israel after the 1967 war. Apart from his Mercedes, the guy hated most things German, and so Siemens was totally verboten in the department.
Imagine my surprise (NOT) when Immelt became the head of all of GE.
I should have shorted the company then, but it would have taken a long time to win that gamble, kinda like the Tesla shorts
Thanks for the insight.
I know a former GE employee (now working for BMW) who three years ago had an MRI scan for a back issue in a private clinic under the healthcare package GE offered to their high level employees.
He was “shocked and dismayed” to find out the MRI scanner was made by Philips. That’s when the idea of leaving GE entered his mind. Good call as they have been slashing overseas departments like there’s no tomorrow: earlier this year they closed the R&D departments in Munich, Rio de Janeiro and even Shanghai.
GE Healthcare was regularly and steadily one of the best breadwinners for the group. Gutting it made zero sense, but Immelt knew from the start he wouldn’t be around when the speedbumps he helped create would start rattling the GE wagon.
Jeff Immelt is in big trouble. My guess is that he might want to sing to federal authorities.
Shouldn’t Six Sigma have prevented this mess???
/s
It’s time for Wall Street to bring new things to life with an index called the “Zombie 500”. A special place where GE has a starring role…….I mean, how coincidental can it be that the last name of a GE cofounder is…..dramatic pause…..Coffin.
It had better pay some decent dividends longterm: undead necromancers tend to be pretty long…”lived”!
No longer “bringing good things to life”
Great article Wolf! oh but it is SO tempting to “buy the dip” when egged on by the wall st analysts….especially “name brand” companies like GE, Toys R us, …. the list is endless!!! I am sure there are dozens, if not hundreds, of “baby GE’s” in the Russel 2,000…Rising interest rates will reveal them to us soon…
I’m an old guy (72, retired CFO), but I’ve seen this play, with different players & costumes, for 50 years.
Anybody who can read financial statements (<5% of so-called investors) would be scared to death to "buy GE on the dip". This is gambling, not investing. God sometimes amblers win, but this is no way to build wealth.
To a Millenial, I know this sound pedestrian, stupid and downright unexciting, but then I have wealth.
When GE is at $6, it will be the buying opportunity of a life time. Just wait for it.
I wonder how they would proceed with bankruptcy here. I think there are parts of GE that is quite useful, jet engines for example, I would who will buy them out. A Chinese company perhaps?
If GE files for bankruptcy some day, it will be restructured and it will shed much of its debt and some problematic units. Its healthy business units will do just fine. Creditors will become their shareholders, and shareholders will end up with little or nothing. A chapter 11 filing could revive the company.
A chapter 11 filing might also allow GE to walk away from some of its pension obligations. This is where bankruptcy filings become very controversial: who gets first dibs at the assets? The pension fund or the secured creditors? The answer to this is well established, unfortunately.
Wolf, I honestly think that GE is going to be worse than Enron. I look at the entire situation including debt, the buybacks, the heavy pension debt, and the accounting situation and it is clear that GE is on borrowed time. In addition to GE’s massive trouble, I would argue that TDAmeritrade is in trouble too for calling GE a buy when everybody could see that GE is in major trouble.
I guess I see a situation where GE is going to equal a horrible Christmas for many people. I can see a straight chapter 7 bankruptcy liquidation starting in December, maybe as early as just after Thanksgiving. And GE is just the tip. I think we will see a massive scandal throughout the entire world that will bring down the globalist house of Cards. I think the Democrats in Washington are aiming to investigate President’s Trump’s business buddies in an attempt to create a scandal that brings down the President himself.
I read that the GE Pension fund is the third largest shareholder of GE stock. So as the stock goes, so gies the pension fund.
And this adds to the tragedy of these once iconic companies: There are legions of people who worked all their lives for the same company, and they accumulated the shares of their company and trusted it, and they expected their survivors (spouses) to be able to live off the dividends, in addition to the survivor benefits of the pension. If they didn’t sell those shares in time, that cash flow is now history.
There is a good chance of Chap 11 and zero chance of a 7, except possibly for a few corporate subsidiaries that are complete orphans.
A 7 occurs when there is no business to salvage and the physical inventory is sold for pennies on the dollar.
GE is a mismanaged colossus with many valuable subsidiaries that make things. They make an operating profit but can’t pay the debt of the mother ship.
Enron was a fraud. Arguably, so is GE a moral fraud for borrowing to buy its shares etc. but unlike Enron it’s unlikely anyone is going to jail. Whether they should can be someone else’s topic.
A Chap 11 filing will dump a lot of the debt, pension obs and prepare for bids from, among others, PE, as well as industrial competitors.
But they will be bidding on businesses, not office furniture or parts. The 11 filing, Protection from Creditors, gives time for these negotiations, which could take years.
A GM- type bailout cannot be absolutely excluded. The small chance of this is increased somewhat by the penchant of this Executive for flamboyant gestures and a ‘just print the money’ budget stance.
Maybe a GE bailout can be sold as saving an American icon or something.
Why would GE do a regular Chap 11? I’d imagine it would have enough political pull to do a “Good GE / Bad GE” bifurcation, much like with GM.
(In other words, instead of restructuring GE, another entity is created which would buy GE’s good assets free and clear via a section 363 sale. Old GE would retain all the liabilities).
Would that not be illegal?
My son worked in a place where they tried to leave the debt in the old company and move all the assets in a new one, controlled by the owner and they got slapped really hard when the debtors found out.
– hence “worked”.
So it appears that those stock buybacks which helped boost executive bonuses will ultimately be paid for out of the Workers Pension funds.
LION…..
ding ding ding, we have a winner!
Maybe they’ll take them private
Hi Wolf,
One aspect of chap. 11 deserves a tad more notice–long term maintenance agreements for things like aircraft engines and power plant turbines. These extremely lucrative contracts are all contingent on solid investment grade bond ratings. Bankrupt entities would prob. lose access to this business.
If you’re into that kind of thing, then at least have patience until the stock doesn’t drop further on more bad news.
Usually, there is a phase of self flagellation also: Management will realise that their bonuses are blown anyway and then set about cleanse & purify all those closets for any skeletons that they can find. Meaning that they will beat expectations for the next 10 quarters and get their bonuses in “round 2” so to speak.
incentives matter
ownership matter
morality matter
“The idea that multiplying rules and statutes can protect consumers and investors is surely one of the great intellectual failures of the 20th century. Any static rule will be circumvented or manipulated to evade its application.”
Protection by the state. This always produces oligopolies, higher prices, and reduced service. It is the ultimate protection racket.
Juvenal asked: “who will guard the guardians?” Adam Smith’s answer is two-fold. First, the state and its byzantine laws and regulations certainly won’t: in-stead, they confound outsiders and abet insiders’ selfishness. Second, the “obvious and simple system of natural liberty” is imperfect; yet it will outperform any scheme which princes and their flatterers might concoct.
Yep, GE developed into a poster child of robber barons aligning with the policy inquisitors. Not capitalism, but crony capitalism in it’s most “advanced” state. Very sad to see these trends continue.
Some policy inquisitors have good intentions, some do not. The end result is and has always been the same. In fact, the inquisitors who are persistent in their belief that they are the only moral players are actually the most dangerous. Unlike a robber baron who actually needs customers to succeed in his endeavors, the inquisitor does not.
The stock buybacks–done with the boatloads of cheap debt ladled out by the Fed–and the aftermath, dovetail hilariously with Wall Street’s whining about the end of the party.
There’s never just one cockroach.
As credit tightens a little further, GE is only going to be one in this cycle’s long parade of corporate creative destruction. They aren’t even the first.
I’m going to go out on a limb and say that this pattern will exemplify the coming bear market and recession. Much as “getting caught with bad real estate loans” was the pattern in the 2007-2009 recession.
You’re on a strong limb there: when the future histories of the era are written, the use of borrowed money for share buybacks is going to be seen as utter madness…
I absolutely agree with that
Agreed. Corporate debt : GDP is now higher than the 2008 debt crisis, and that has become a reliable precursor. Bankruptcy season is coming up and the downward trend has reversed. And so forth. From here it’s just a matter of waiting out the expected sequence of events. It will not be long now. You may wish to consider how deep the plunge will be, and the chances of any real economic recovery afterwards, in view of the present landscape.
Wolf, Could you detail how you come up with liabilities of $263b in the article..just categories of debt would do, Thanks
From GE’s 10-Q:
Liabilities (in million $)
Short-term borrowings: 15,206
Accounts payable, principally trade accounts: 15,748
Progress collections and deferred income 20,579
Dividends payable 1,054
Other GE current liabilities 17,930
Non-recourse borrowings of consolidated securitization entities 2,699
Long-term borrowings 97,060
Investment contracts, insurance liabilities and insurance annuity benefits 35,575
Non-current compensation and benefits 34,342
All other liabilities 19,913
Liabilities of businesses held for sale 1,360
Liabilities of discontinued operations 2,002
Total liabilities(b) 263,468
https://www.sec.gov/Archives/edgar/data/40545/000004054518000081/ge3q201810-q.htm
Thanks so much, Great work!
Hi Wolf, great article thanks. Do you have any figures for what the banks are exposed to ref GE debt?
I don’t have this data at my finger tips. But there is a “capital structure” (hierarchy), with unsecured debts at the bottom and the most senior secured 1st lien debt at the top. Bank loans are usually near the top, unsecured bonds are near the bottom. So in bankruptcy court, decisions are made as to who gets wiped out, who gets a haircut, and who gets the best collateral or the best business entities. So likely the banks will get the best parts and their losses won’t be huge.
That is $263.5 billion in liabilities. GE needs to forget about possible Chapter 11 and file a straight Chapter 7 because other companies ultimately liquidated with much less debt. Enron is the poster child company that comes to mind.
Hi Wolf,
I would focus on the $97 biliion of long term borrowing as a shorthand for their debt.
It’s really too bad. I imagine that GE stock attracted a lot of older folks because of the dividend payout and blue chip status. What kind of market is this when blue chip investors take a bath and companies with no profit rise to the moon?
I got in and out of GE from $14 on down and somehow managed not to lose any money. I had a feeling it wasn’t worth a buy and hold. All the talk about financial gimmickry made me wary.
That is the entire summary of QE, companies with little revenue and lots of debt rose to the top. It will happen again, only this time GE could rise from the ashes. The CBs know what works and they’ll respond in similar fashion in the next crisis. They blow bubbles in order to reflate them.
So wait. Stock buybacks when the stock is way overpriced … isn’t such a good idea? Who knew (that stock price could go down)? Do these boards of directors do anything useful, like preventing risky, horrible decisions?
Retail investors own what, 40% of the stock (not counting preferred)? All for that big, juicy 5% dividend that they’ll never see. Greed begets greed.
Immelt was on the right track and his plan: dispose of GE Capital, focus on high margin software technologies (Predix in particular, a shockingly effective manufacturing automation platform, could have become the AWS cloud platform of manufacturing, a nascent market that will be worth $100s billions), additive manufacturing and grid transformation technologies, probably would have worked. Of course making such a costly losing bet on gas turbines would have been painful, and the way in which it was done, being blindsided by Solar PV, an on-coming train almost 60 years in the making, borders on malfeasance, but no company bats better than 50% on its industry bets long term.
That’s what makes the stock buy-backs so unforgivable. The implied arrogance that he ‘knew’ his bets were sure things and wouldn’t need the cash to ride-out cyclical factors beyond his control or formulate plan Bs for stillborn initiatives or put GE Capital under again for a life saving transfusion. (By all accounts Immelt know that until GEC was completely wound-down it would be a stalking threat to GE’s balance sheet.
Now GE is stuck in the all too familiar ‘business’ of selling productive assets to provide cash for distressed ones, all the while marking time circling the drain.
The whole stock buy back thing makes one wonder “What IS the purpose of stocks anyways?”
I grew up being taught that stocks were issued to the public to raise capital that would allow companies to startup, expand, and innovation in ways that benefited themselves and the public, consumers, etc…not to give company capital away.
When buy back become the norm, it’s like the above paragraph in reverse, and it suggests companies doing buybacks have reach a pointed of destruction and conraction instead of creation.
Seems to me buybacks should be illegal if only because of the insider trading to manipulate stock prices to benefit insiders. That might address one symptom, but polices that reverse the concentration of wealth are needed to fix the broader problems that buybacks one part of.
Buybacks per se are not necessarily bad. Taking a public company private (“Funding secured” ;-)) or making a hostile takeover more laborious and expensive are just two examples of share buybacks done correctly, if only after careful considerations.
What’s not correct is buying back shares if this ends up saddling the company with new debt which then needs to be serviced exclusively to prop up share price and/or increase dividend per share. Yet as long as shareholders are fine with this, it’s basically fine.
But…
Massive share buybacks are only possible in two cases.
First is if a company is very cashflow positive. See Apple and China Telecom. While one can simply argue they can just pay off bigger dividends, it’s basically another way to pass on the profits to shareholders.
Second is if the cost of servicing the new debt which is created to buy back the shares is very low, meaning within 200bps or so of the official rate of inflation. See basically 90% of share buybacks over the past decade.
Basically you don’t need to send in the gendarmes to drag people kicking and screaming to Devil’s Island. Just make the cost of servicing debt higher, at very least for unnecessary expenses such as share buybacks are. A return to remotely saner monetary policies would undoubtedly help: while financial bucaneers will always exist it will make their job a whole lot more difficult.
Another reason for share buy-backs – but it should be, as you pointed out, on the basis of a cash-rich or high cash-flow position – is a buy-back when other “investments” for a company aren’t as lucrative. If Berkshire is buying back shares because they find their stock undervalued and greater ownership of their own stock would provide a greater, safer return than other assets, it can be a justification.
Of course, this wouldn’t apply to GE.
The situation at GE took a few years to gestate. In early 2009 Immelt wrote this to shareholders
“The global economy, and capitalism, will be ‘reset’ in several important ways. The interaction between government and business will change forever. In a reset economy, the government will be a regulator; and also an industry policy champion, a financier, and a key partner.”
Review subsequent GE strategy, i.e. the degree of alignment with the new US policies as these emerged in 2009 forward.
In 2016 he wrote this:
“In business, if you don’t lead these changes, you get fired; in politics, if you don’t fight them, you can’t get elected. As a result, most government policy is anti-growth,” he wrote. “In the U.S., we want exports but seem to hate trade and exporters; globally, governments love small businesses but then regulate them to death.”
GE is a good case study for those who like to debate the relationships between govt policy setting and business.
Immelt, seriously? Immelt’s credibility is lower than GE’s stock price. At least that’s still positive.
GE stock tanked 61% in ten years under Immelt. The S&P 500 doubled in the same period. He’s lucky the Fed came to his rescue or we would now be talking about GE very much in the past tense.
After GE Immelt became a vulture capitalist so his job duties wouldn’t change.
Immelt was the epitomy of a rent-seeking crony capitalist, prostituting himself and his company with the economic policy inquisitors and later finding out they were expecting rosemary’s baby.
That he he was appointed to lead the US Council on Jobs and Competitiveness, i.e. the jobs czar, was not unlike having Jonathan Gruber architect healthcare. GE shipped it’s jobs overseas and US unemployment remained in the crapper year after year.
Hopefully those quotes shed some light on his “journey” ?
Immelt made out okay. That’s the important thing.
We should expect more from our CEOs, but that goes back to broken corporate governance.
Who are GE’s competitors?
Those might be the best companies to invest in provided GE goes bankrupt.
Doesn’t work that way, a company goes broke they dump their inventory on the market at bankruptcy prices, and the competition has to lower their prices.
The end of financial engineering ie, GE Capital which carried the company until it couldn’t no more…
share buybacks = trouble ahead, provides insiders, management, big funds banks/brokerages etc to bail ahead of the inevitable. Means off load to others who without real market knowledge believe a bargain is to good to pass up at some price.
Raise those rates further. Stop the debt financed share buybacks. Our fragile corporations will be forced to clean up their Balance sheets.
I think any GE pensioner better be shorting GE stock to hedge their dependence on the pension. The stock chart looks like bankruptcy is imminent.