Home prices fell year-over-year in 25 of the 33 big expensive cities in April, a bunch set multi-year lows, led by Oakland & Austin, down by 26% from 2022. Two set new highs.
By Wolf Richter for WOLF STREET.
In 28 of the 33 big and expensive cities we track here, mid-tier home prices in April have dropped from their respective peaks in prior years. In 19 of those cities, the peaks were in 2022; in 7, the peaks were in 2024; and in 2, the peaks were in early 2025 (Boston in April 2025 and San Jose in January 2025). All of the prices are on a seasonally adjusted basis.
The 28 declines from their respective peaks were led by Austin (-26%), Oakland (-26%), and New Orleans (-19%). The new entry, and just barely, Boston, was down 1% in April from the high in April a year ago.
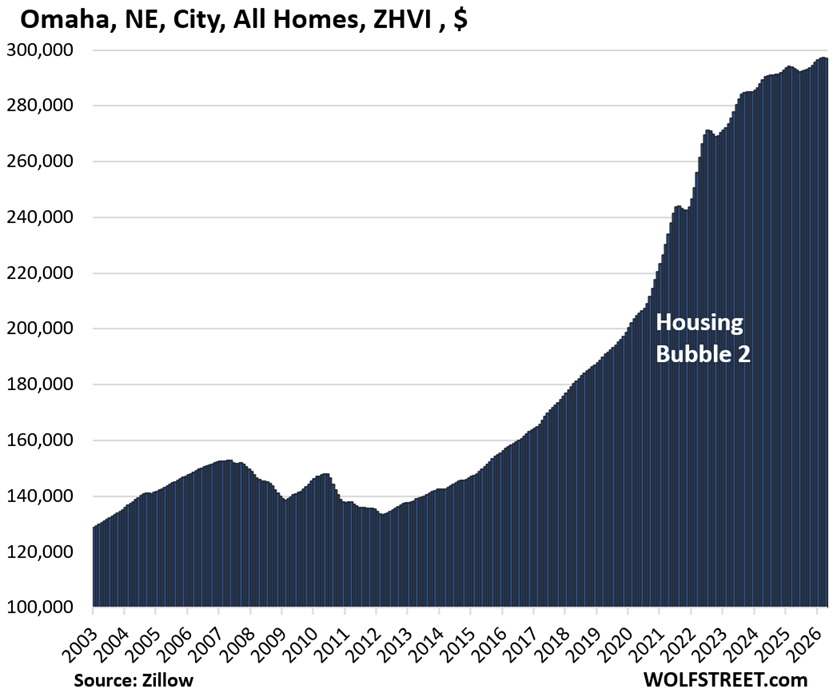
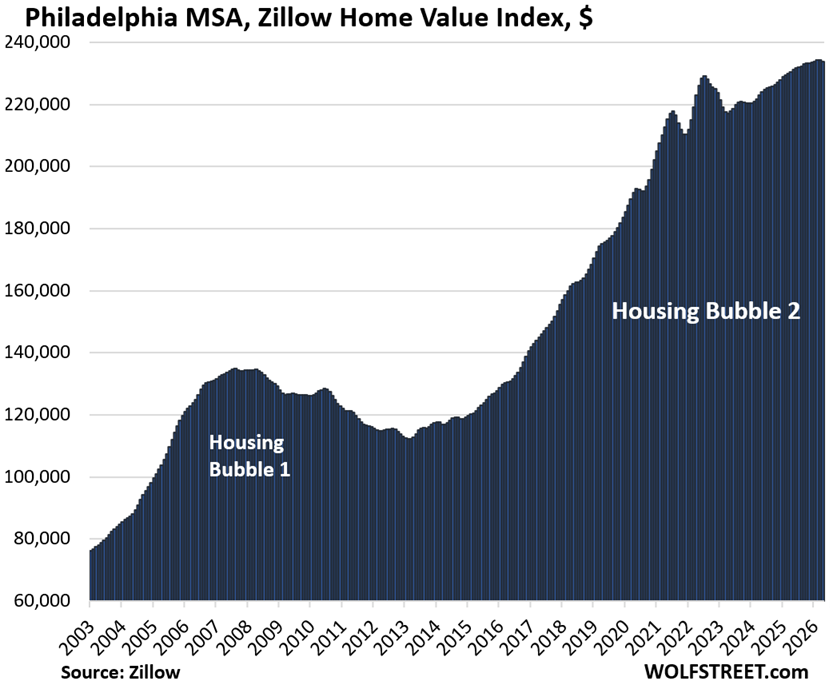
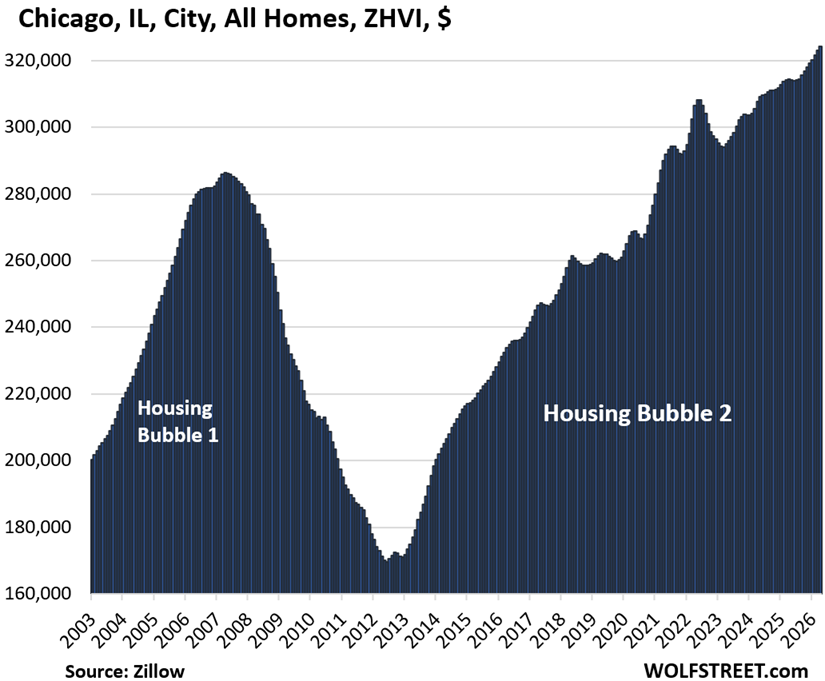
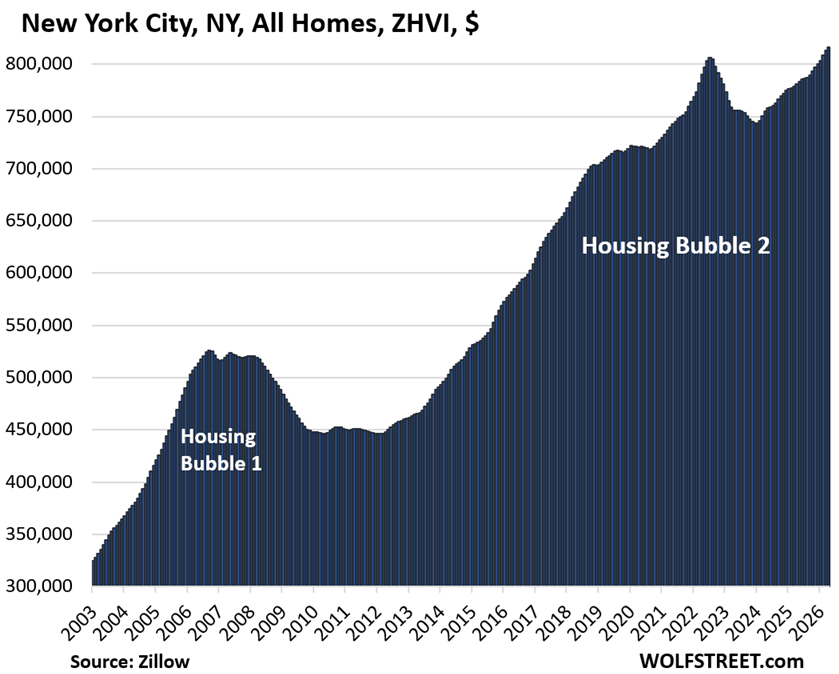
In the remaining 5 of the 33 cities, prices rose to new highs in 2026, seasonally adjusted: New York City and Chicago in April; Philadelphia, Omaha, and Minneapolis earlier in 2026.
On a month-to-month basis, prices declined in 27 of the 33 cities in April, seasonally adjusted; rose in 3 cities; and were unchanged in 3 cities.
On a year-over-year basis, prices fell in 25 of the 33 cities and rose in 8; but in 3 of those 8 cities where prices rose year-over-year, prices remained below their highs in prior years (San Francisco, Salt Lake City, Honolulu).
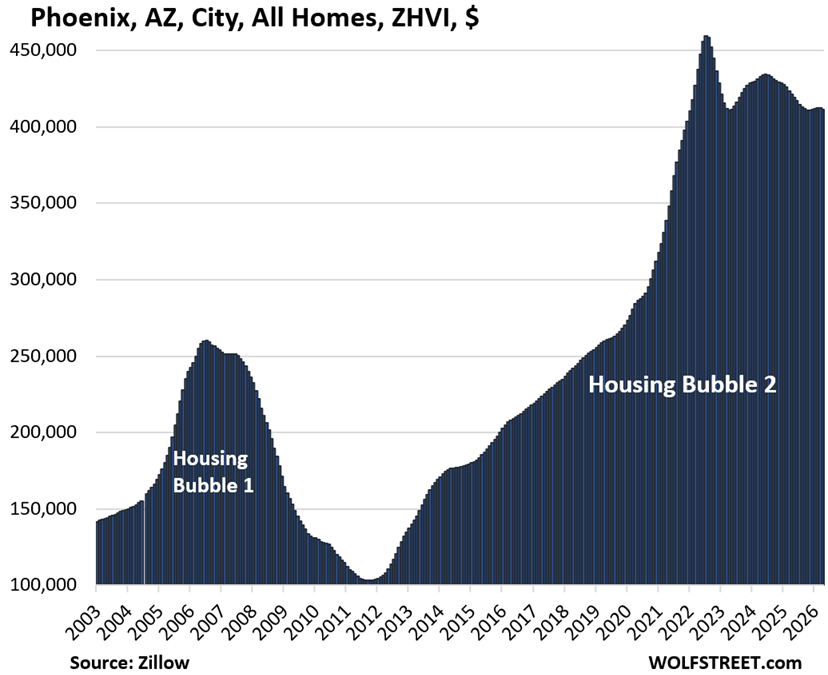
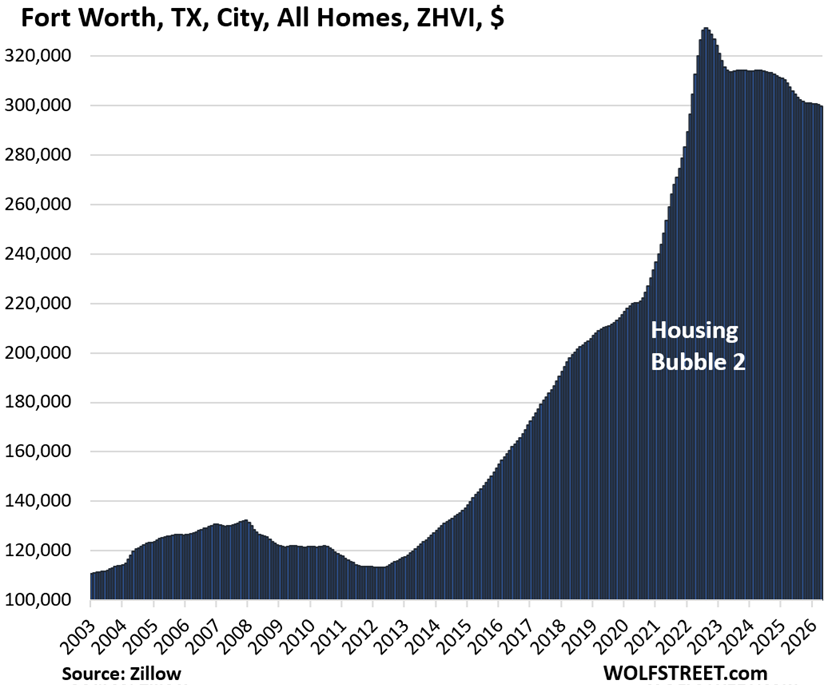
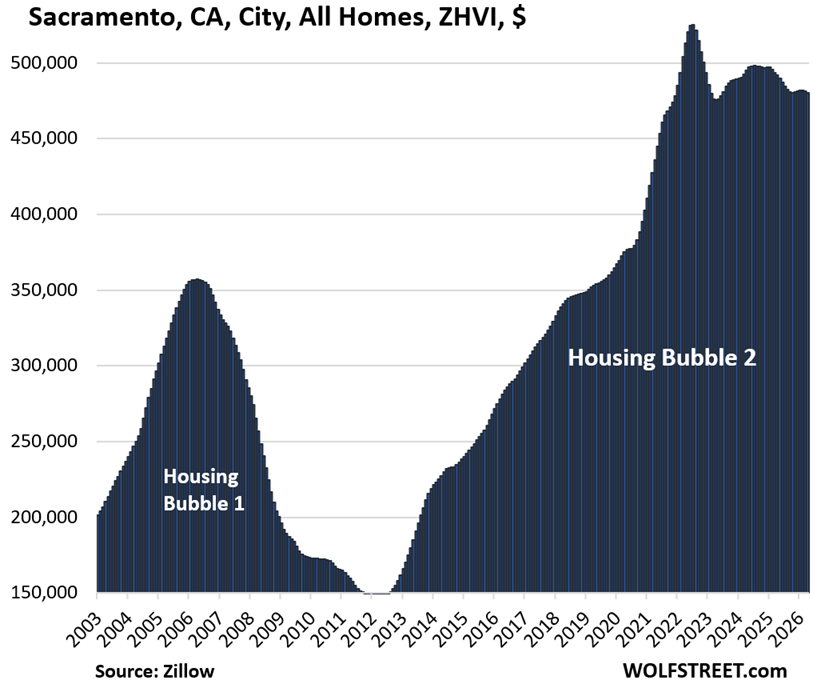
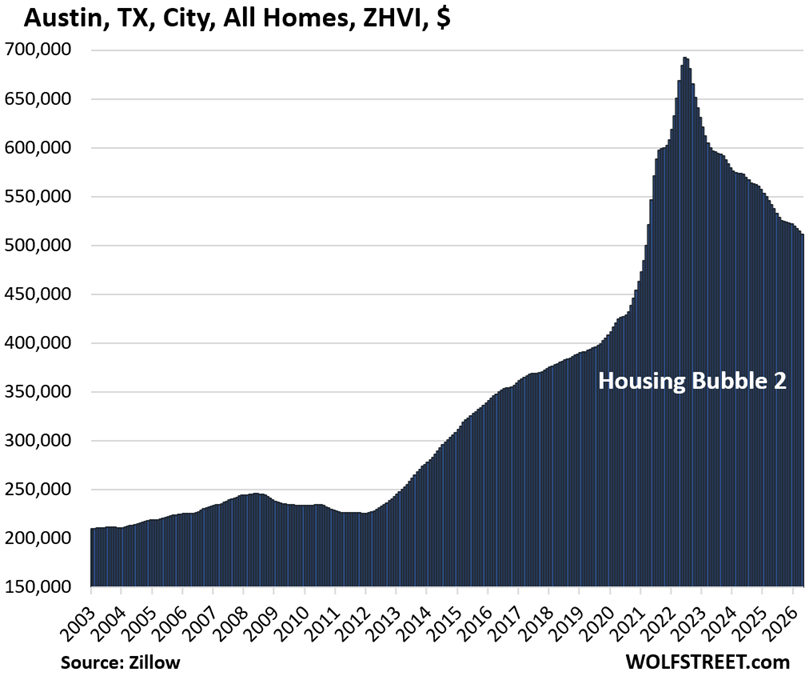
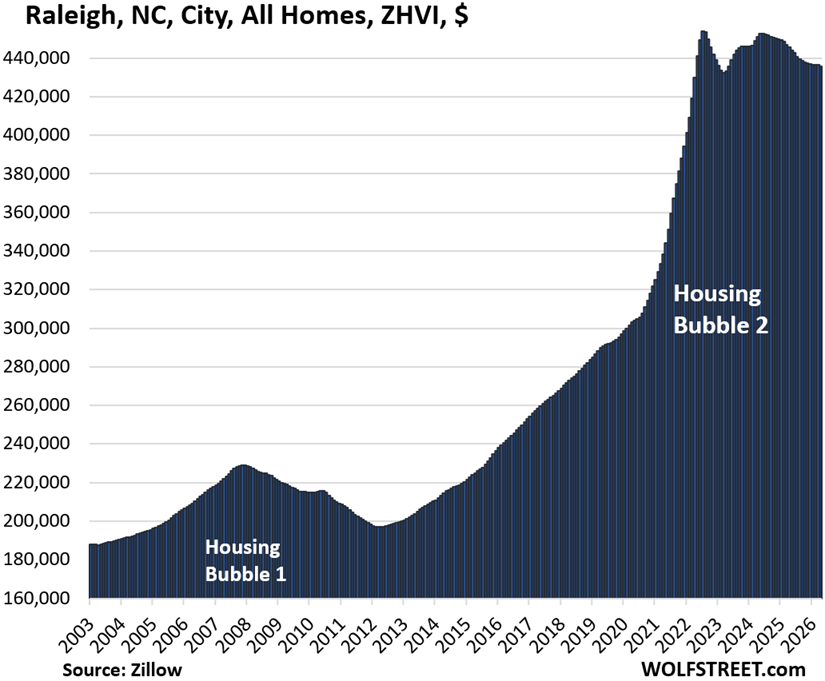
From mid-2020 to mid-2022, all of the 33 cities here had experienced huge price spikes, such as Austin (+62% in two years), Phoenix (+60%), Fort Worth (+50%), Raleigh (+49%), and Sacramento (+39%).
Those price explosions, piled on top of the already outsized price gains in the years before the pandemic, were fueled by the Fed’s reckless free-money policies, which included mortgage interest rate repression with trillions of dollars of purchases of Treasury securities and mortgage-backed securities, which generated the below-3% mortgage rates, even as inflation was heading toward 9%. Those policies blew up the housing market, as you can see in the charts below.
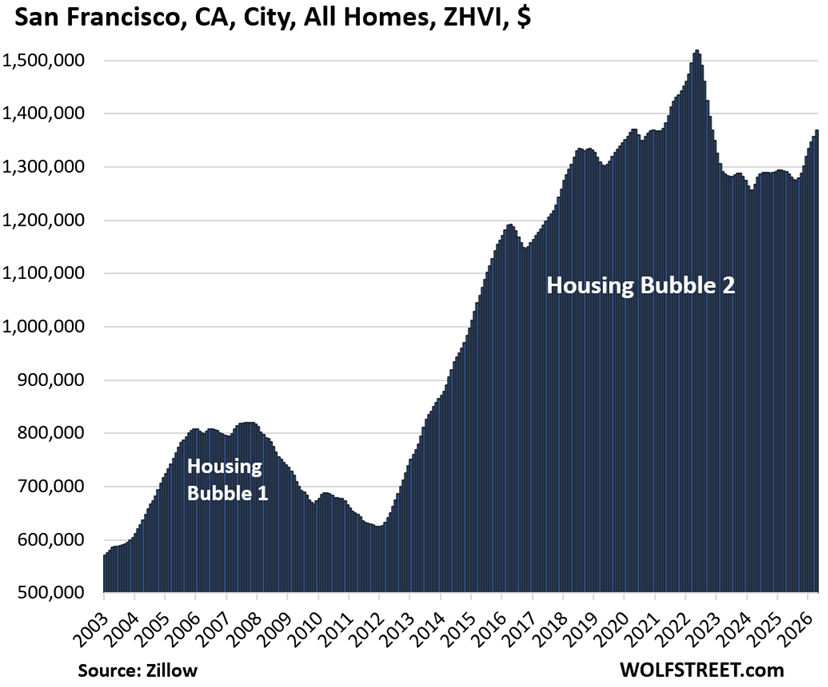
In San Francisco, despite layoffs in the broader tech sector in the city, people are hired in by AI companies with huge compensation packages. And people who have been working for local AI companies, such as OpenAI, are now sitting on massive wealth through their stock compensation packages. And they’re out there in the epicenter of the AI investment bubble, buying homes at the upper end of the range, leading to a phenomenon called locally the “mansion shortage,” and it has trickled down into the mid-tier homes (the middle third of the price range) that we track here. Despite the recent price surge amid those mid-tier homes, they’re still down by 10% from the peak in mid-2022.
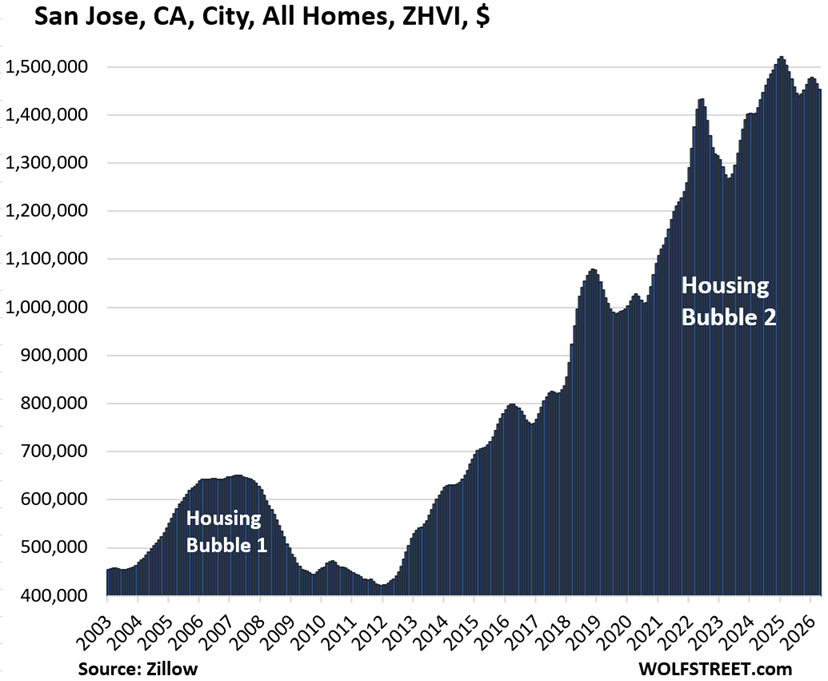
By contrast, prices fell at an accelerated pace in San Jose (Silicon Valley), where mid-tier homes are even more expensive than in San Francisco.

The price index here is the seasonally adjusted three-month-average mid-tier Zillow Home Value Index (ZHVI) for single-family homes, condos, and co-ops, released on Saturday. Mid-tier means the middle-third by price in each market. The ZHVI is based on millions of data points in Zillow’s “Database of All Homes,” including from public records (tax data), MLS, brokerages, local Realtor Associations, real-estate agents, and households across the US. It includes pricing data for off-market deals and for-sale-by-owner deals.
To qualify for the list, the city must be one of the largest by population and be among the more expensive cities where the ZHVI for all mid-tier homes must have been at least $300,000 at some point.
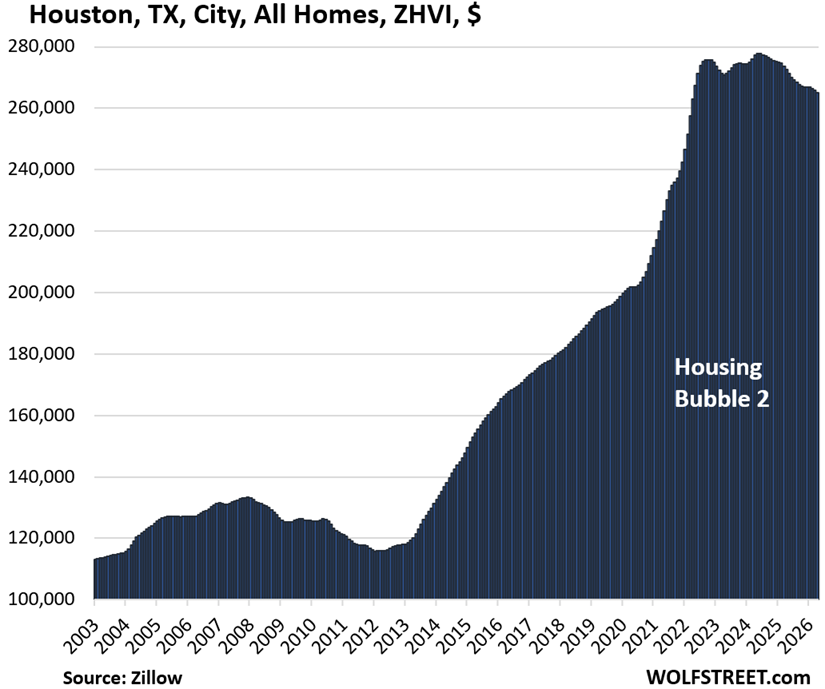
Some large cities don’t qualify for this list because the ZHVI for mid-tier homes never reached $300,000, despite the surge in recent years, such as the cities of New Orleans, Houston, Philadelphia, Memphis, Oklahoma City, Tulsa, Kansas City, Cincinnati, Pittsburgh, and a slew of others.
But Houston, Philadelphia, New Orleans, and Omaha are included anyway: Houston and Philadelphia because they’re the fourth-largest and sixth-largest cities in the US; New Orleans because it got very close to $300,000 in 2022; and Omaha, because it’s now very close to $300,000 and is the most expensive big city in the center of the US.
The 33 Most Splendid Housing Bubbles.
In the little tables, MoM = month over month; YoY = year-over-year. The column furthest to the right shows the percentage increase “since 2000.” All seasonally adjusted.
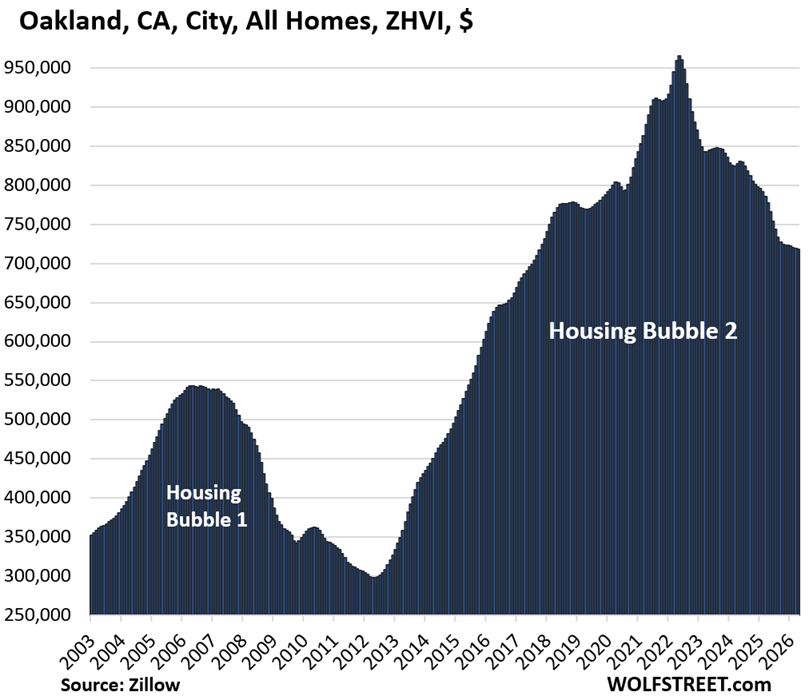
| Oakland, City, CA, All Homes, Prices | |||
| From May 2022 peak | MoM | YoY | Since 2000 |
| -26% | -0.1% | -7.6% | 246% |
Lowest since October 2017.
| Austin, TX, City, All Homes, Prices | |||
| From Jun 2022 peak | MoM | YoY | Since 2000 |
| -26% | -0.6% | -5.7% | 153% |
Lowest since March 2021.

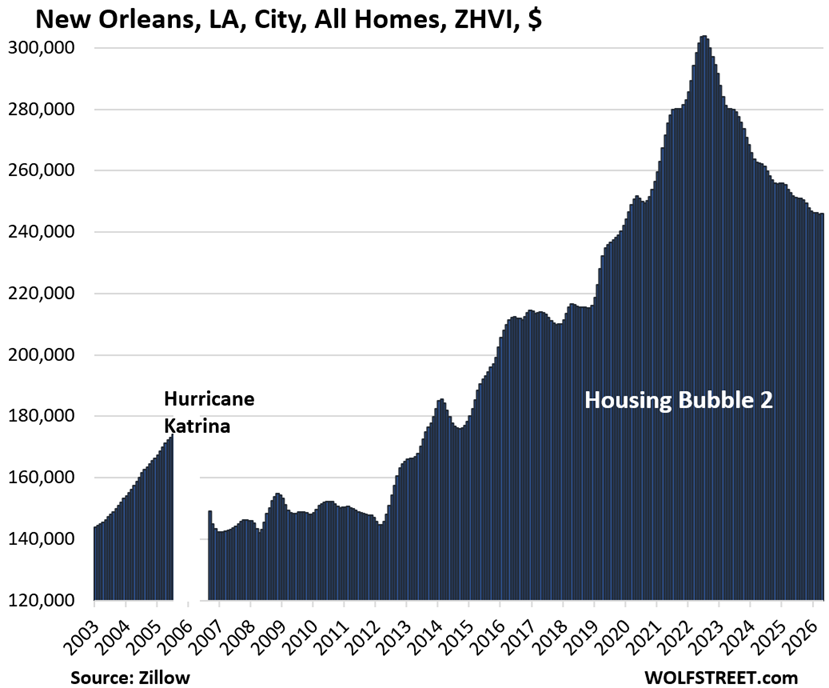
| New Orleans, LA, City, All Homes, Prices | |||
| From Jun 2022 peak | MoM | YoY | Since 2007 |
| -19% | 0.0% | -2.7% | 106% |
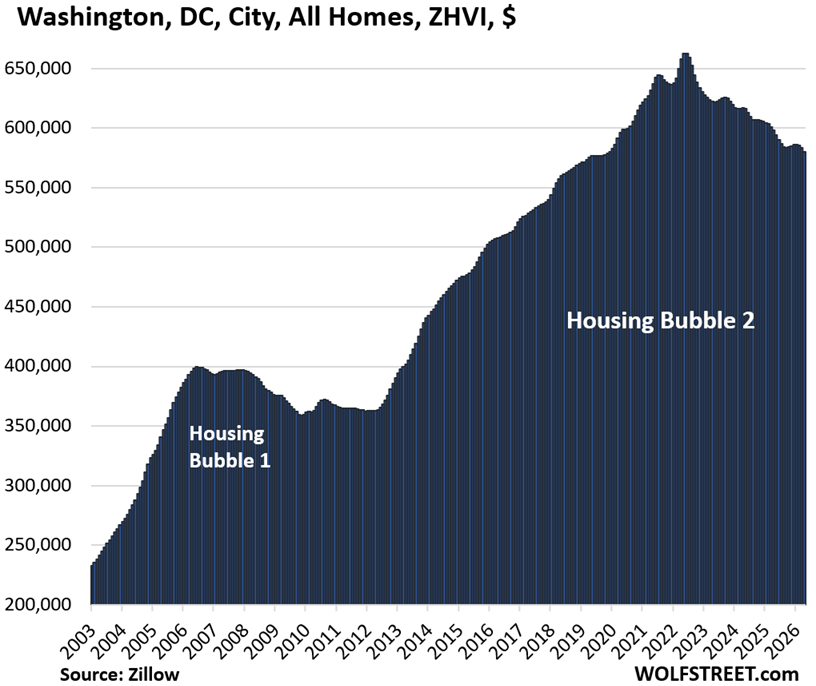
| Washington D.C., All Homes, Prices | |||
| From Jun 2022 peak | MoM | YoY | Since 2000 |
| -12% | -0.6% | -3.0% | 256% |
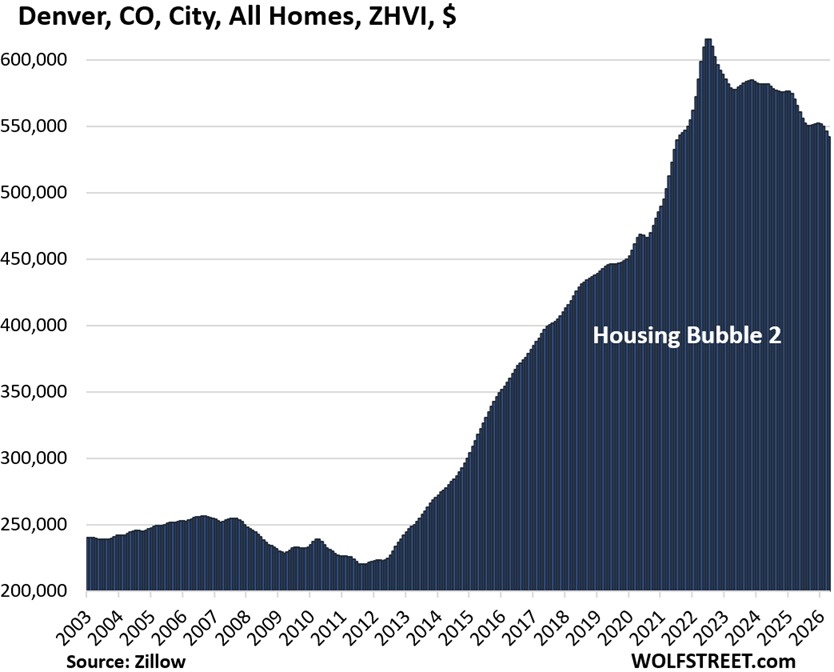
| Denver, CO, City, All Homes, Prices | |||
| From Jun 2022 peak | MoM | YoY | Since 2000 |
| -12% | -0.8% | -4.2% | 198% |
| Phoenix, AZ, City, All Homes, Prices | |||
| From Jul 2022 peak | MoM | YoY | Since 2000 |
| -11% | -0.2% | -2.4% | 249% |
| Fort Worth, TX, City, All Homes, Prices | |||
| From Aug 2022 peak | MoM | YoY | Since 2000 |
| -10% | -0.2% | -2.5% | 188% |
| San Francisco, CA, City, All Homes, Prices | |||
| From May 2022 peak | MoM | YoY | Since 2000 |
| -10% | 0.8% | 6.0% | 228% |
Trickle-down effect: The “Mansion Shortage” trickles down to mid-tier home prices.
| Sacramento, CA, City, All Homes, Prices | |||
| From July 2022 peak | MoM | YoY | Since 2000 |
| -9% | -0.2% | -2.3% | 285% |
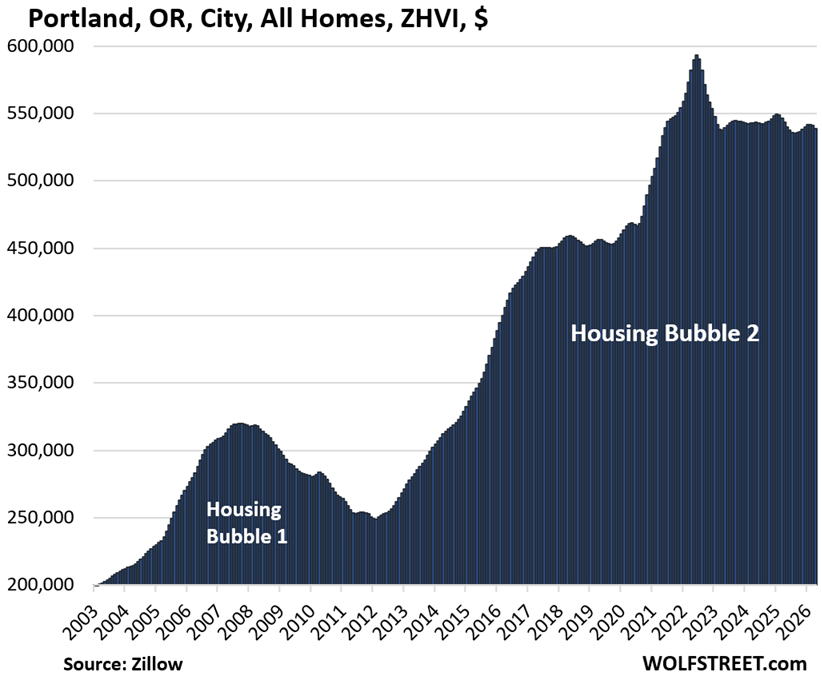
| Portland, OR, City, All Homes, Prices | |||
| From May 2022 peak | MoM | YoY | Since 2000 |
| -9% | -0.4% | -0.9% | 216% |
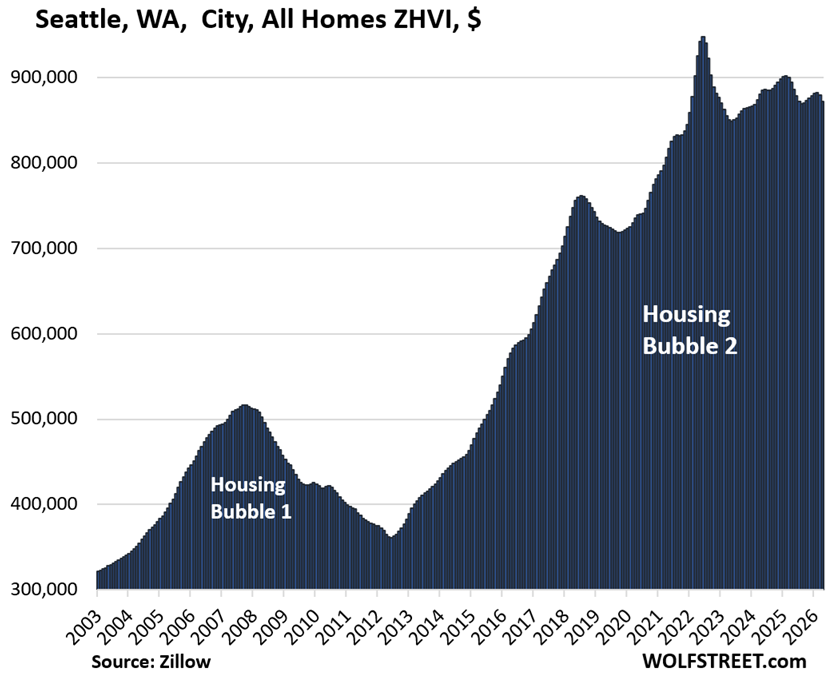
| Seattle, WA, City, All Homes, Prices | |||
| From May 2022 peak | MoM | YoY | Since 2000 |
| -8% | -0.8% | -2.5% | 227% |
| Atlanta, GA, City, All Homes, Prices | |||
| From Jun 2022 peak | MoM | YoY | Since 2000 |
| -8% | -0.2% | -3.6% | 140% |
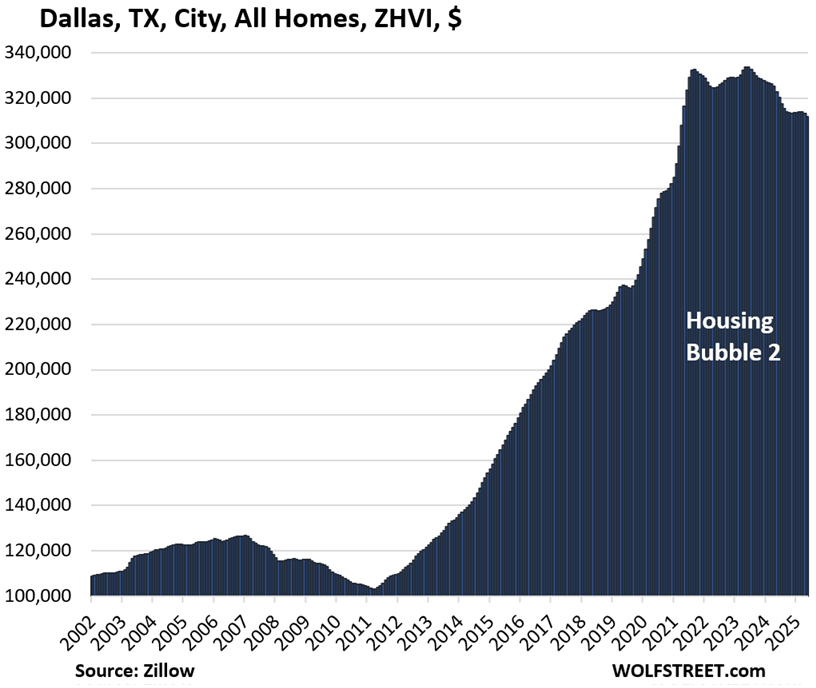
| Dallas, TX, City, All Homes, Prices | |||
| From May 2024 peak | MoM | YoY | Since 2000 |
| -7% | -0.4% | -3.4% | 214% |
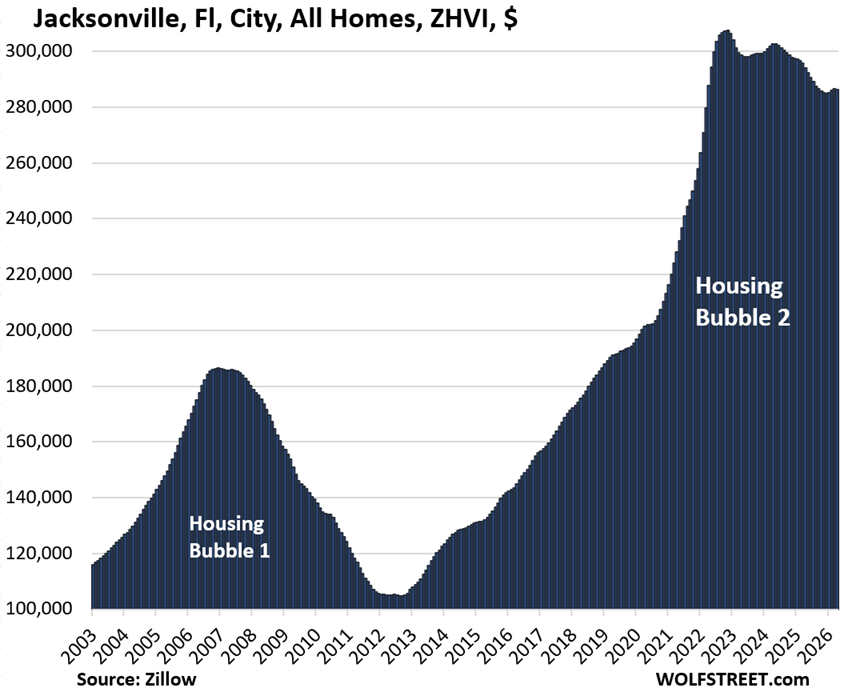
| Jacksonville, FL, City, All Homes, Prices | |||
| From Nov 2022 peak | MoM | YoY | Since 2000 |
| -7% | 0.0% | -2.6% | 204% |
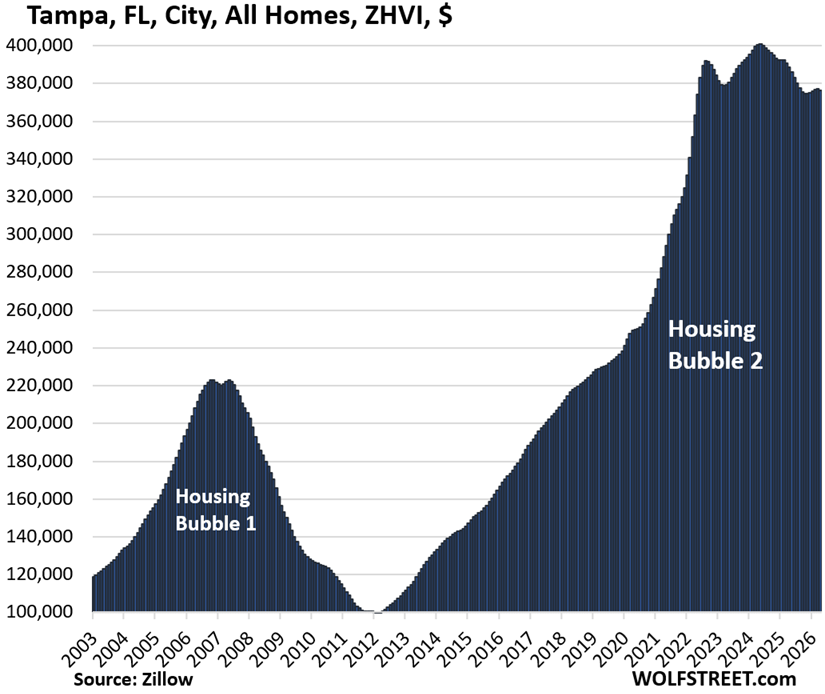
| Tampa, FL, City, All Homes, Prices | |||
| From May 2024 peak | MoM | YoY | Since 2000 |
| -6% | -0.2% | -3.1% | 311% |
| Houston, TX, City, All Homes, Prices | |||
| From Jul 2022 peak | MoM | YoY | Since 2000 |
| -5% | -0.3% | -2.7% | 153% |
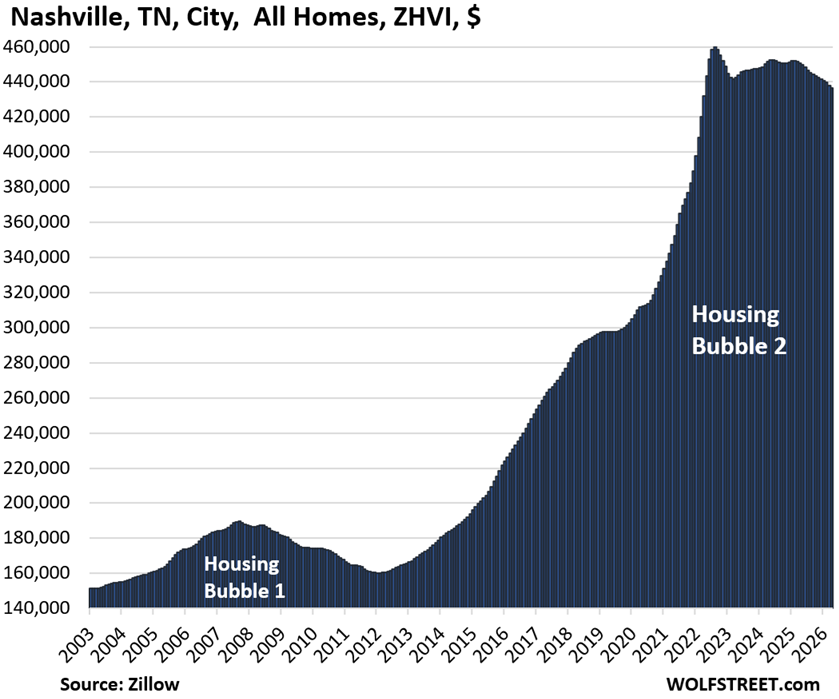
| Nashville, TN, City, All Homes, Prices | |||
| From July 2022 peak | MoM | YoY | Since 2000 |
| -5% | -0.4% | -3.2% | 213% |
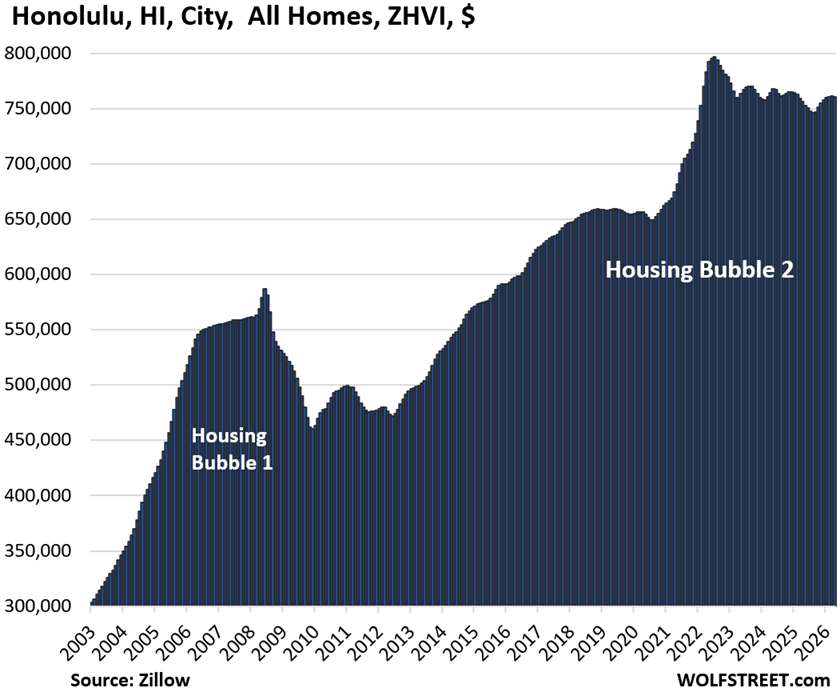
| Honolulu, HI, City, All Homes, Prices | |||
| From Jun 2022 peak | MoM | YoY | Since 2000 |
| -5% | -0.2% | 0.6% | 207% |
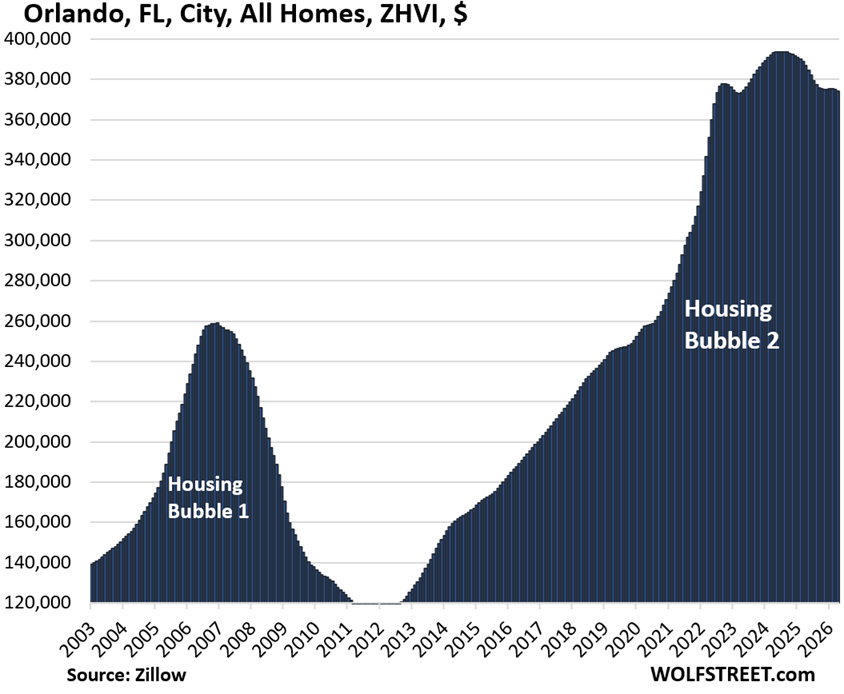
| Orlando, FL, City, All Homes, Prices | |||
| From Jun 2024 peak | MoM | YoY | Since 2000 |
| -5% | -0.2% | -3.2% | 240% |
| San Jose, CA, City, All Homes, Prices | |||
| From Jan 2025 peak | MoM | YoY | Since 2000 |
| -4% | -0.9% | -2.5% | 337% |
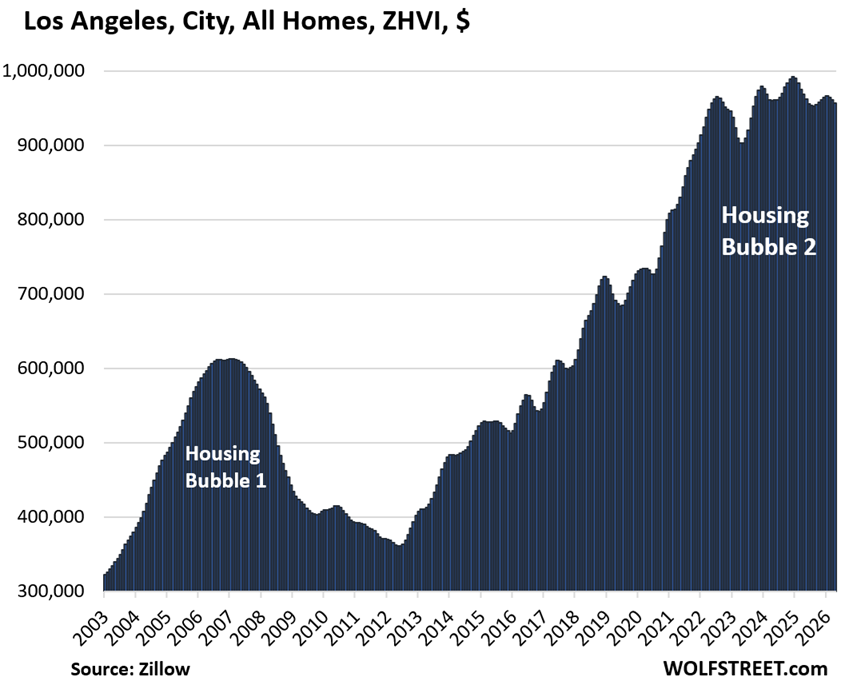
| Los Angeles, CA, City, All Homes, Prices | |||
| From Dec 2024 peak | MoM | YoY | Since 2000 |
| -4% | -0.4% | -1.2% | 325% |
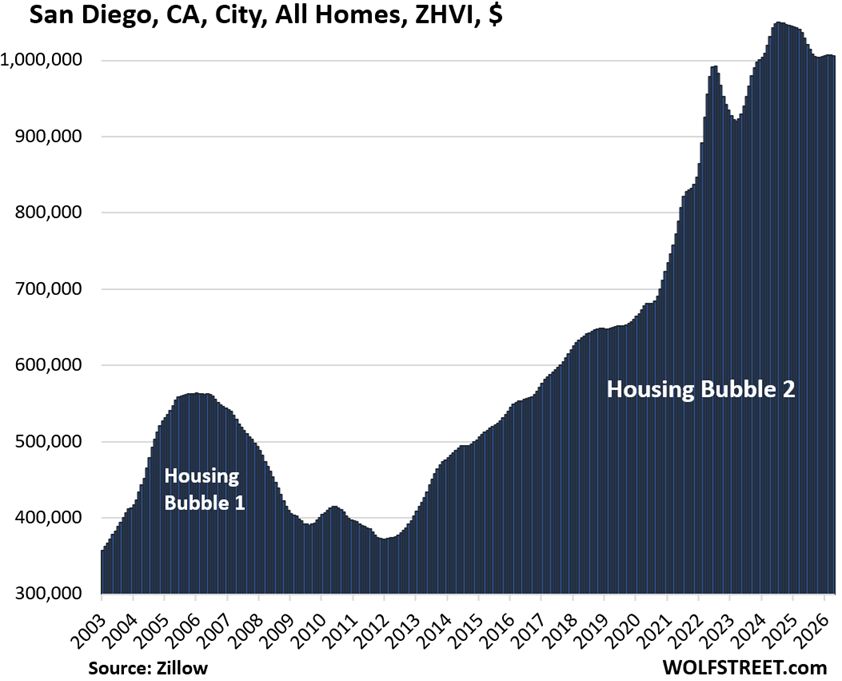
| San Diego, CA, City, All Homes, Prices | |||
| From July 2024 peak | MoM | YoY | Since 2000 |
| -4% | -0.1% | -2.9% | 347% |
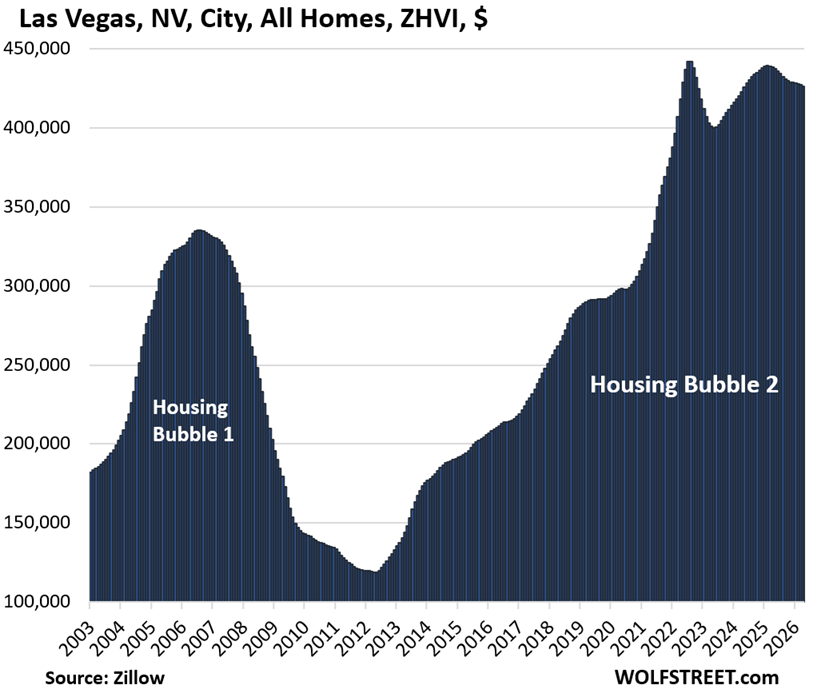
| Las Vegas, NV, City, All Homes, Prices | |||
| From June 2022 peak | MoM | YoY | Since 2000 |
| -4% | -0.2% | -2.8% | 176% |
| Raleigh, NC, City, All Homes, Prices | |||
| From July 2022 peak | MoM | YoY | Since 2000 |
| -4% | -0.2% | -2.2% | 149% |
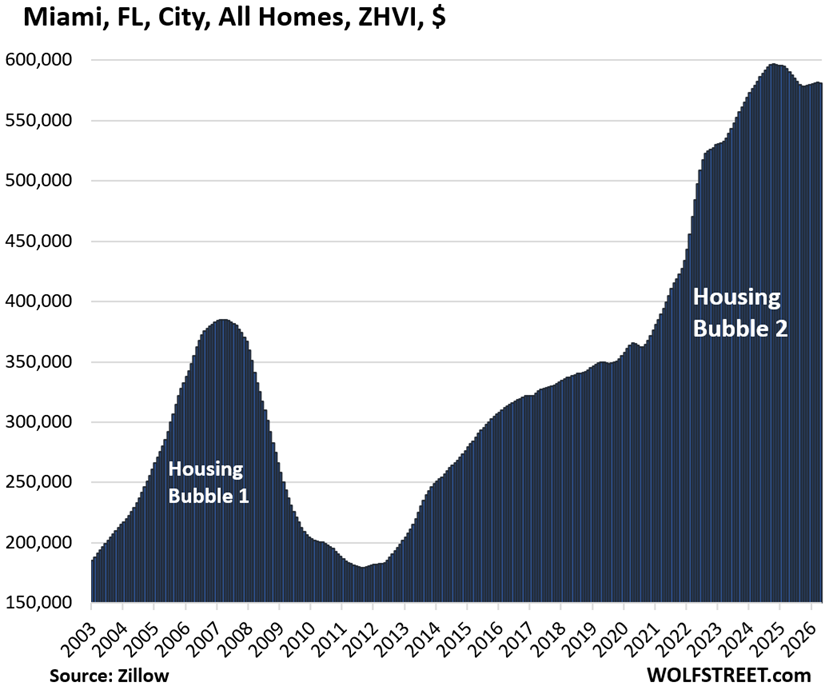
| Miami, FL City, All Homes, Prices | |||
| From Oct 2024 | MoM | YoY | Since 2000 |
| -3% | -0.1% | -1.6% | 342% |
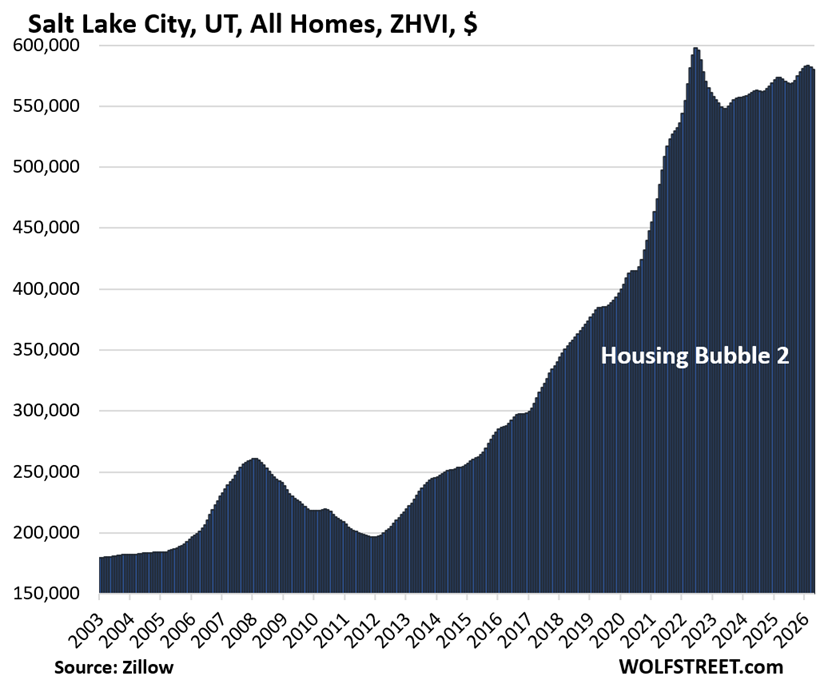
| Salt Lake City, UT, All Homes, Prices | |||
| From July 2022 peak | MoM | YoY | Since 2000 |
| -3% | -0.4% | 1.4% | 240% |
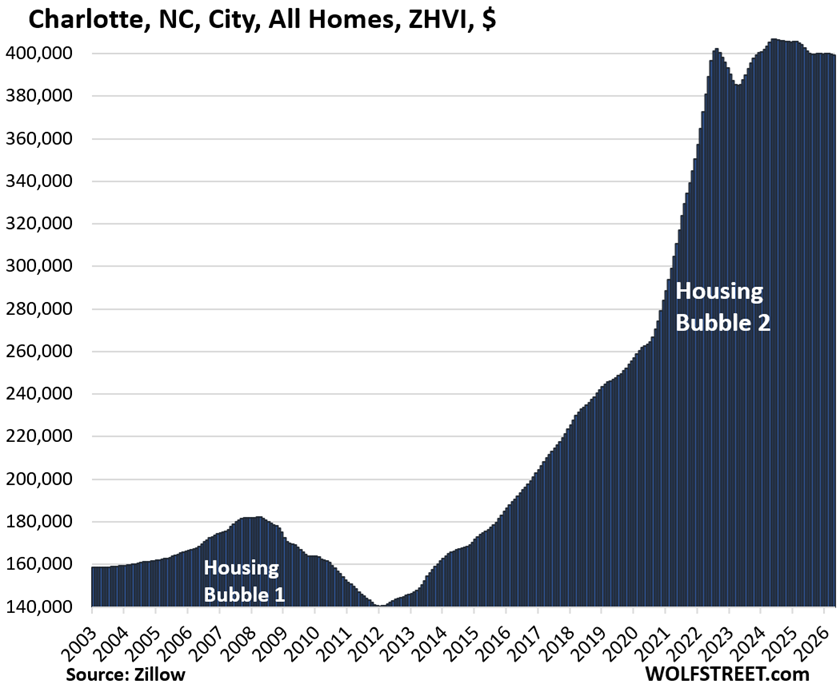
| Charlotte, NC, City, All Homes, Prices | |||
| From May 2024 peak | MoM | YoY | Since 2000 |
| -2% | -0.2% | -1.2% | 168% |
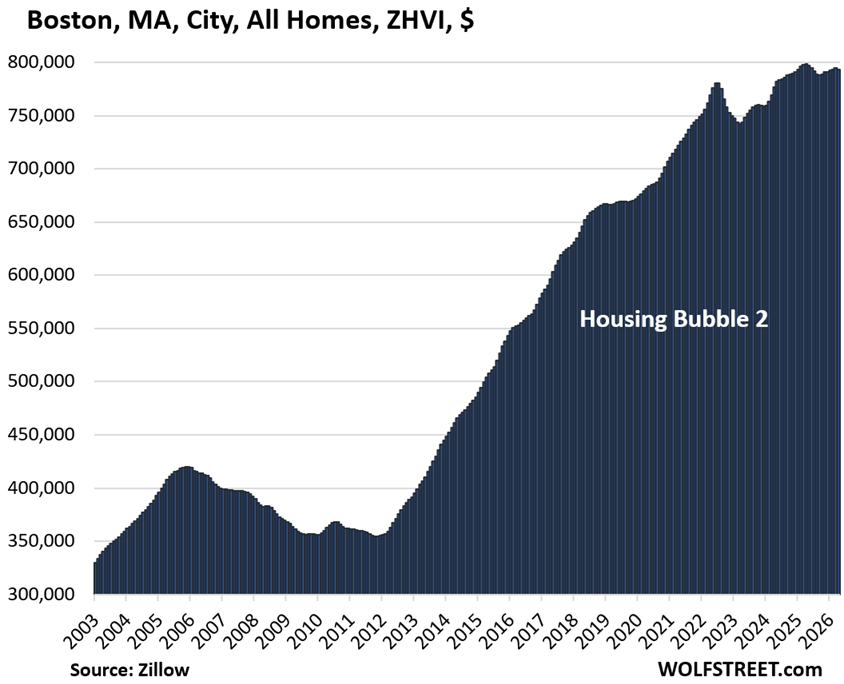
| Boston, MA, City, All Homes, Prices | |||
| From Apr 2025 peak | MoM | YoY | Since 2000 |
| -1% | -0.2% | -0.7% | 265% |
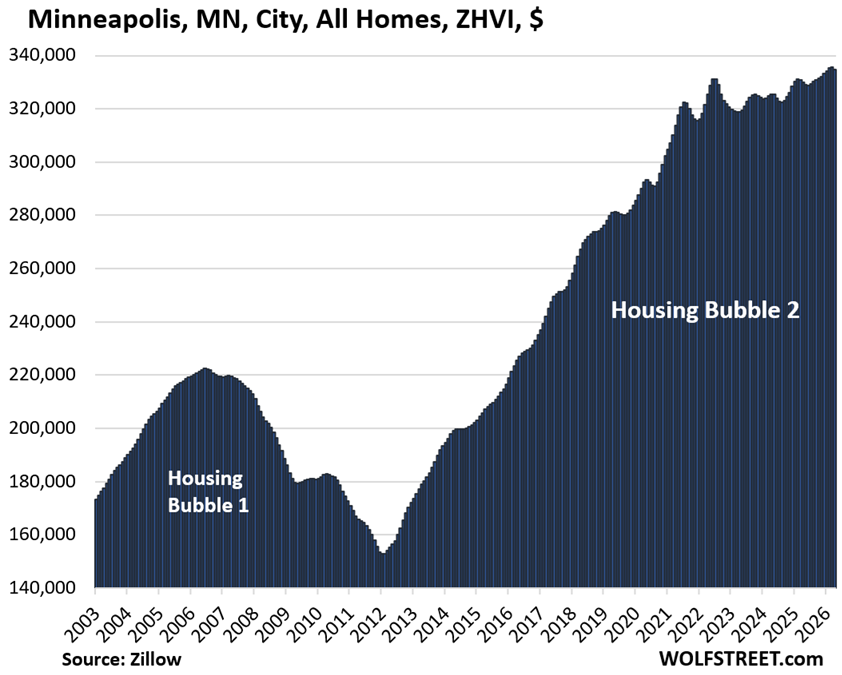
| Minneapolis, MN, City, All Homes, Prices | ||
| MoM | YoY | Since 2000 |
| -0.3% | 1.4% | 196% |
| Omaha, NE, City, All Homes, Prices | ||
| MoM | YoY | Since 2000 |
| 0.0% | 1.3% | 151% |
| Philadelphia MSA, All Homes, Prices | ||
| MoM | YoY | Since 2000 |
| -0.3% | 1.5% | 272% |
| Chicago, IL, City, All Homes, Prices | ||
| MoM | YoY | Since 2000 |
| 0.4% | 3.1% | 116.7% |
| New York City, NY, All Homes, Prices | ||
| MoM | YoY | Since 2000 |
| 0.3% | 4.4% | 240% |
Enjoy reading WOLF STREET and want to support it? You can donate. I appreciate it immensely. Click on the mug to find out how:

![]()