In the San Jose metro (Silicon Valley), active listings hit at least a 10-year record for March. But Orange County lags behind.
By Wolf Richter for WOLF STREET.
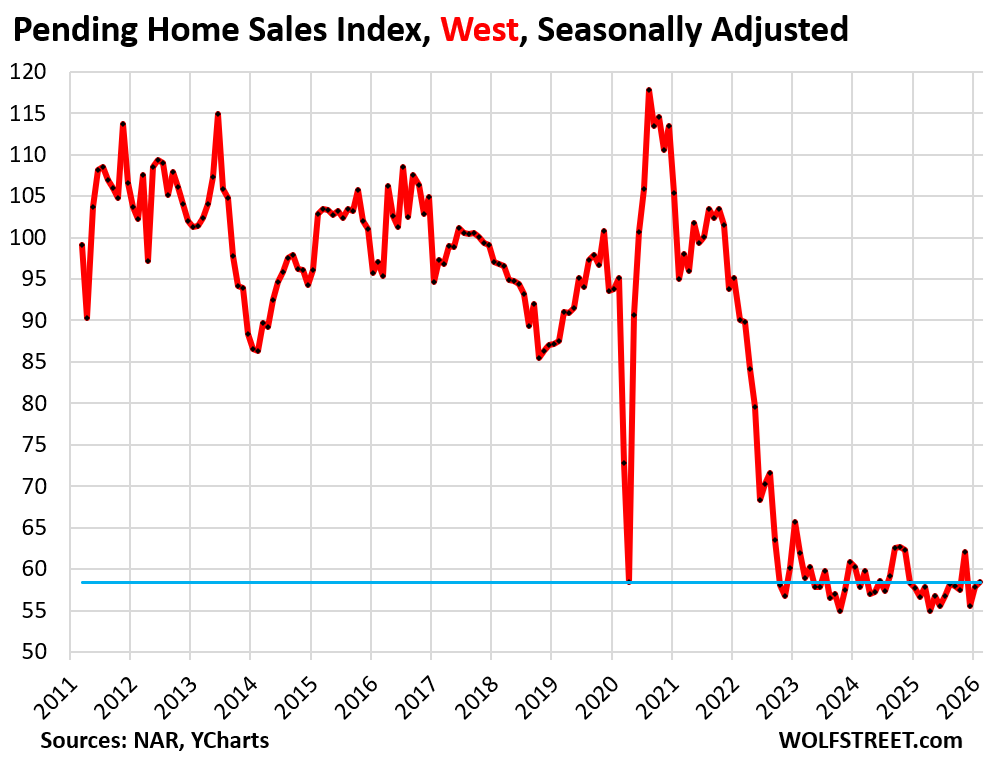
The average 30-year fixed mortgage rate is back in the 6.4% range, after the surge in March, which has pulled the rug out from already weak demand for existing homes in March. Even before mortgage rates began to re-surge, in February, pending sales of existing homes in the West were still down by 33% from 2019, hobbling along at very low levels (see chart at the bottom of this article). And March was even tougher, as shown by the drop in mortgage applications to purchase a home.
But active listings continued to rise in California and in March reached 60,521 homes for sale, the second-highest for any March over the past 10 years, behind only March 2019 (purple dotted line), but ahead of 2017, 2018, and all the others.
Compared to March 2025 (double red line), active listings were up by 5%; compared to March 2024 (dotted red line) by 57%; and compared to March 2021 by 105%, according to the data from Realtor.com, which goes back to mid-2016.
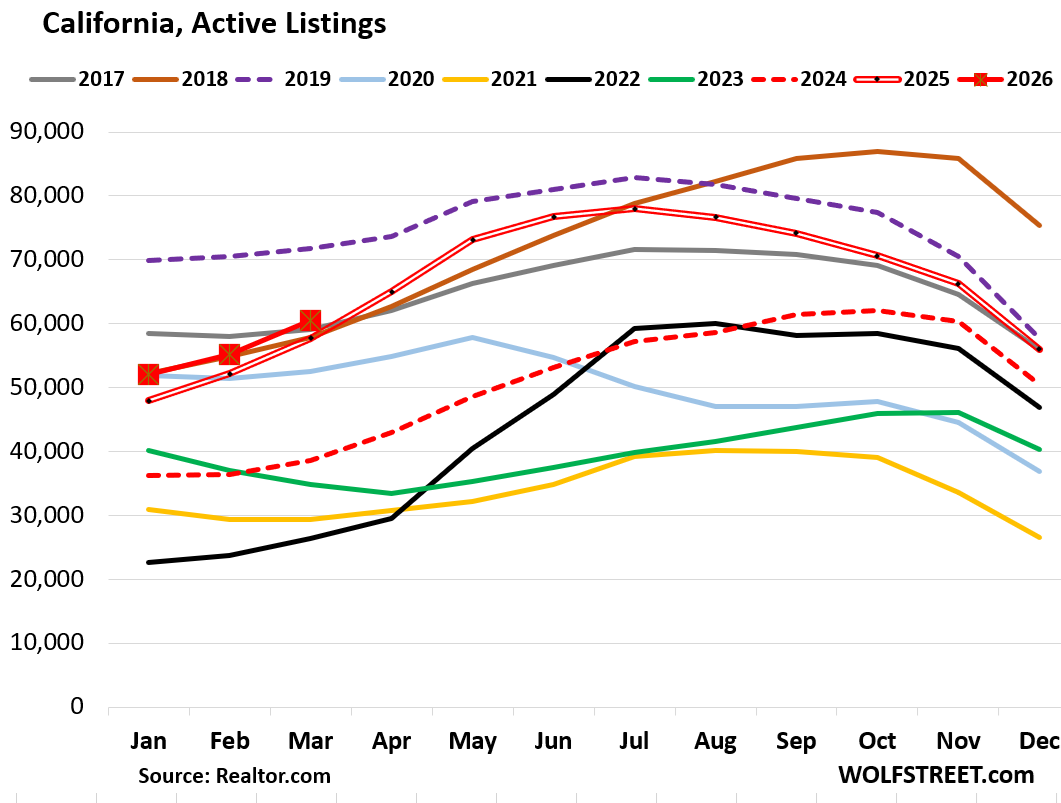
The dynamics in 2018 and 2019: In 2018 (brown line in the chart above) and through July 2019 (dotted purple), inventories were piling up amid the Fed’s hiking cycle when the average 30-year fixed mortgage rate rose and briefly hit 5% by November 2018. Mortgage rates then began declining as the Fed indicated a pivot at its December 2018 meeting, when it hiked for the last time in that cycle. In July 2019, with inflation below target, the Fed cut its policy rates. And mortgage rates had already dropped, and home sales were picking up, and active listings began to ease.
The reason active listings are now piling up isn’t a flood of new listings – there isn’t – but a plunge in demand of roughly 25% to 35% compared to pre-pandemic levels, and what is on the market is slow in selling. Delistings have also run high, which have kept the inventory from surging further.
The plunge in demand is a result of home prices having exploded during the pandemic’s below-3% mortgage rates to levels that are beyond where they make any kind of sense.
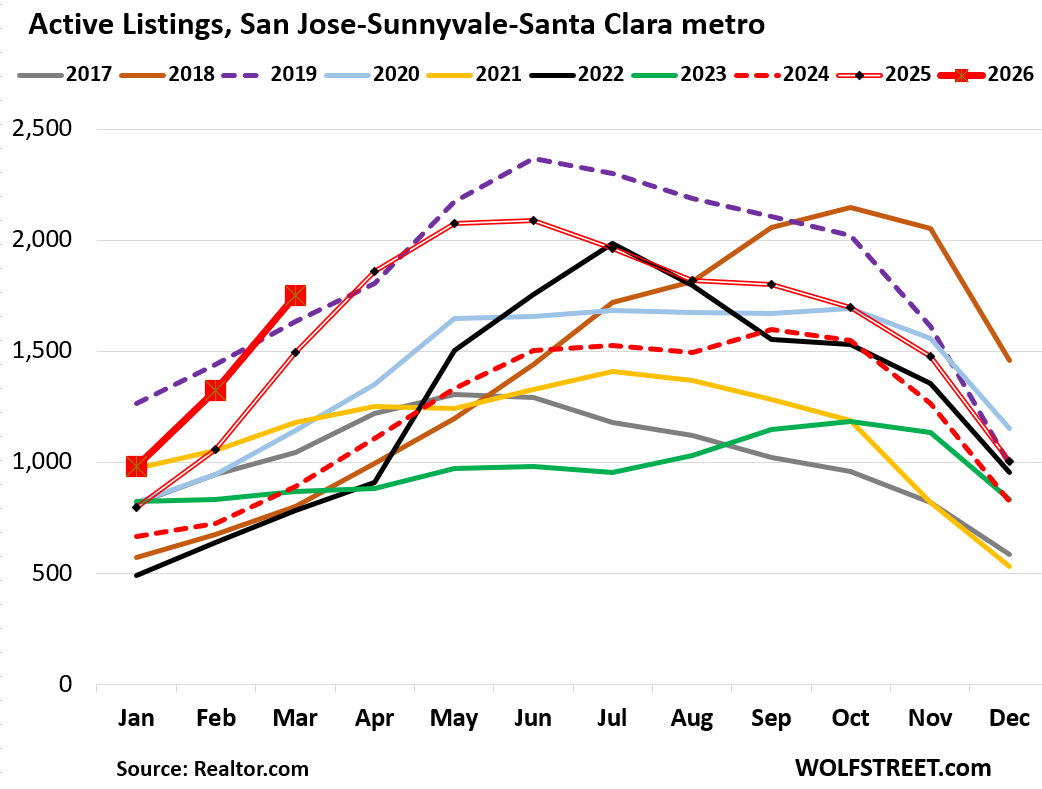
In the San Jose-Sunnyvale-Santa Clara metro, the southern portion of Silicon Valley, active listings rose by 17% from March 2025 (double red line), and by 97% from March 2024 (dotted red line), to 1,753 homes for sale, the most for any March in at least these 10 years of available data from Realtor.com.
This is quite an amazing turn of events.
The metropolitan statistical area (MSA) includes Santa Clara County and San Benito County, which extends south into rural areas.
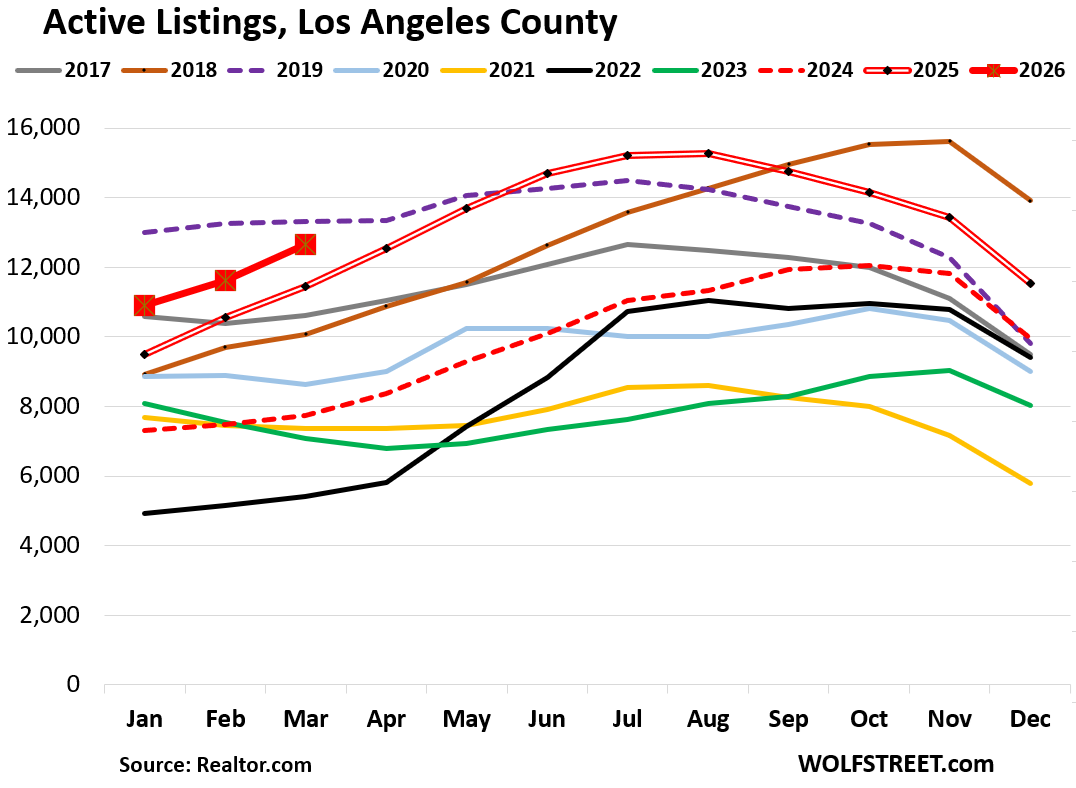
In Los Angeles County, active listings jumped by 10% year-over-year, and by 63% from March 2024, to 12,647 homes for sale, the second-most for any March over those 10 years, behind March 2019, in the data from Realtor.com going back to mid-2016.
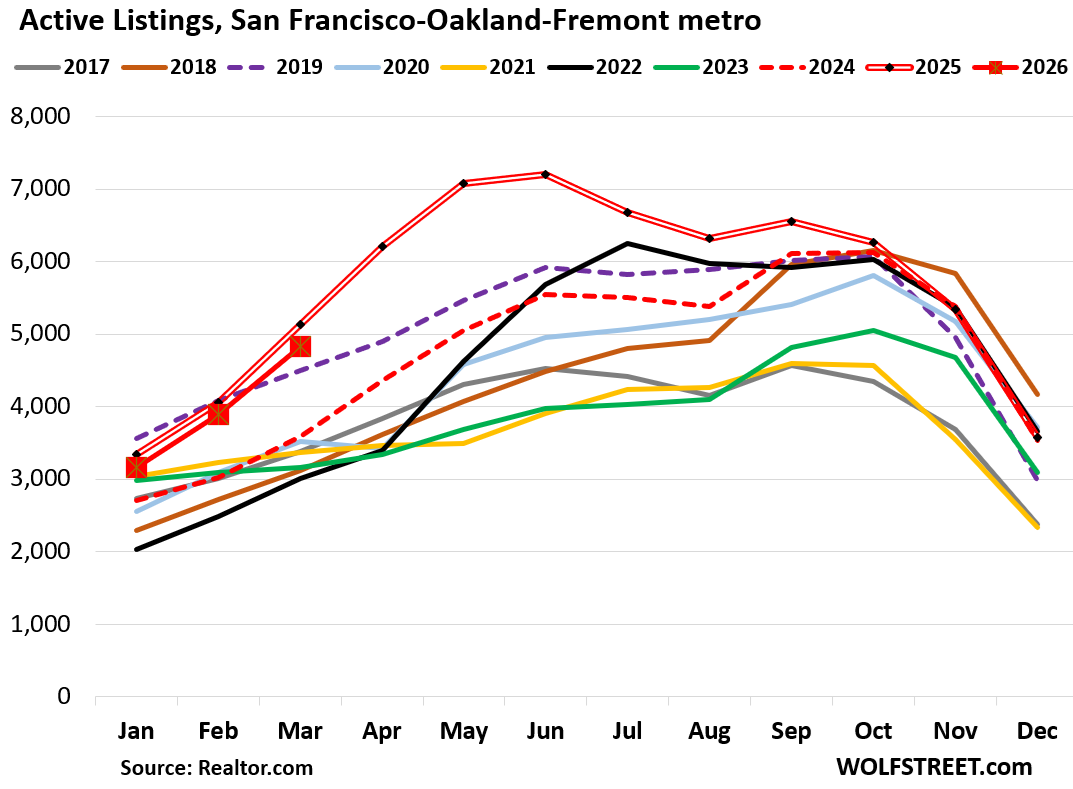
In the San Francisco-Oakland-Fremont metro, active listings were 6% below March 2024, which had been the highest for any March in those 10 years.
Compared to March 2024, listings were up by 35%. Compared to March 2019, listings were up by 7%; compared to March 2018, listings were up by 55%.
The MSA includes the city of San Francisco, the county of San Mateo (northern portion of Silicon Valley), part of the East Bay including Oakland, and part of the North Bay.
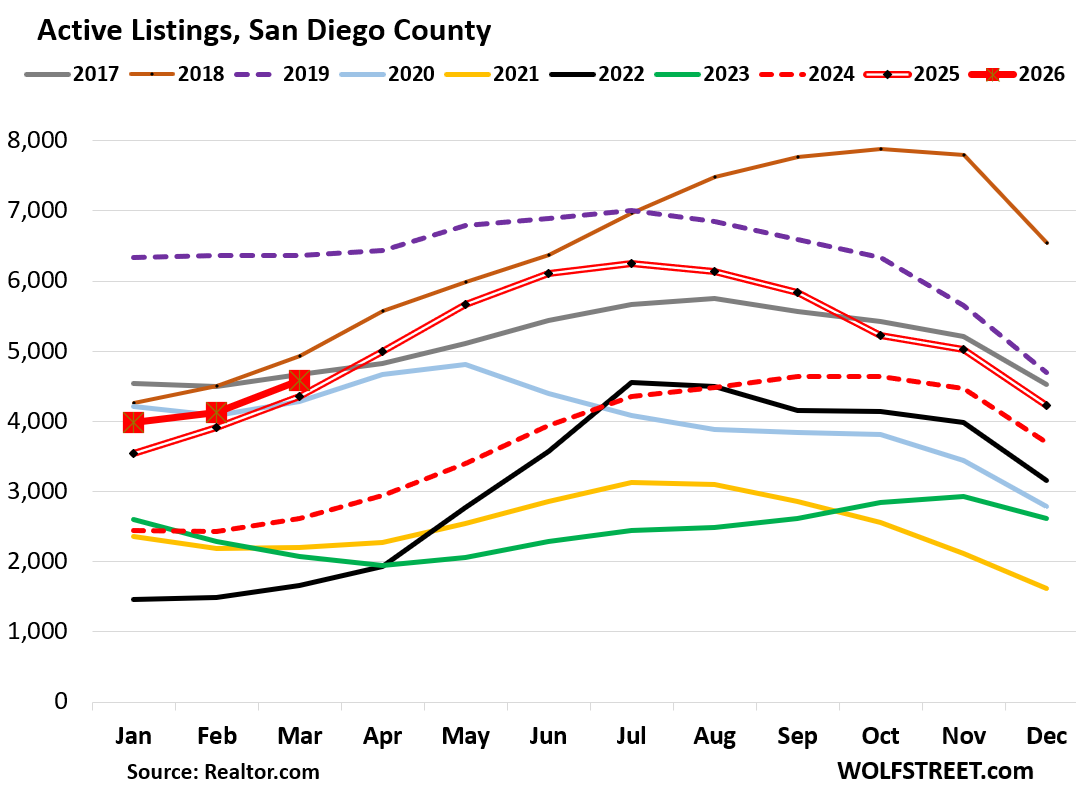
In San Diego County, active listings rose by 5% year-over-year and by 76% in two years, to 4,586 homes for sale, almost even with March 2017, and behind 2018 (brown line), and 2019 (purple dotted line).
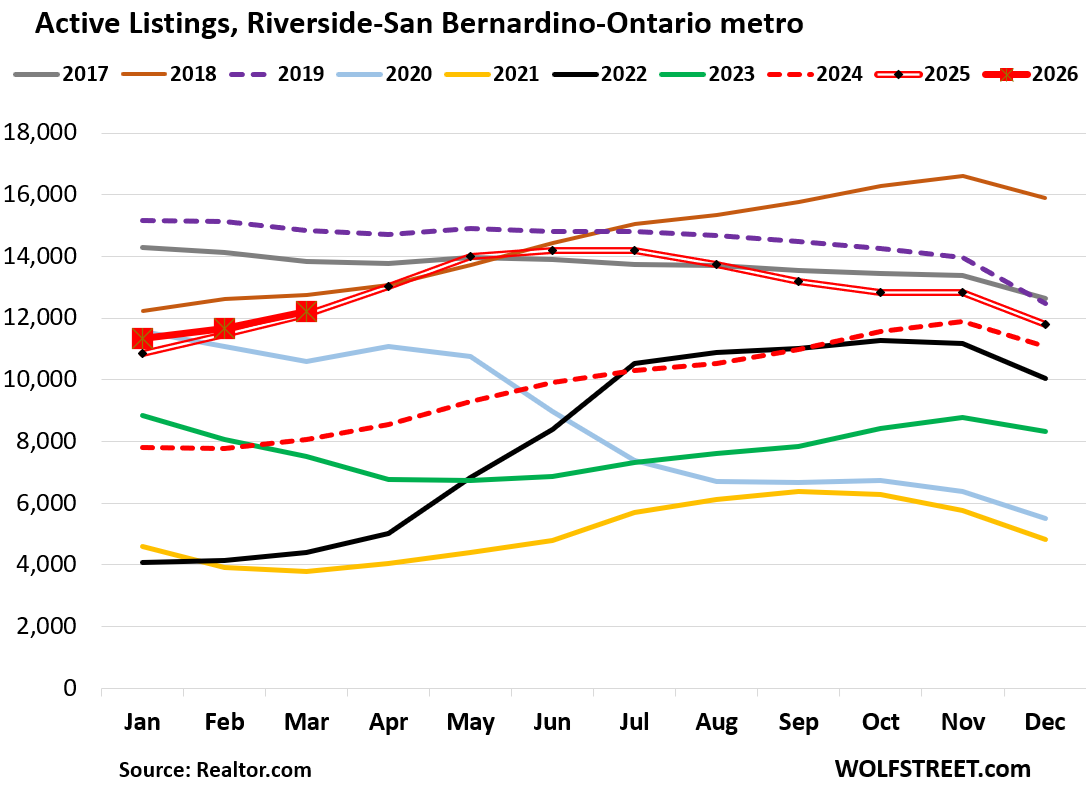
In the Riverside-San Bernardino-Ontario metro, active listings rose by 1% year-over-year, and by 51% from two years ago, to 12,232 homes, still below 2018-2019.
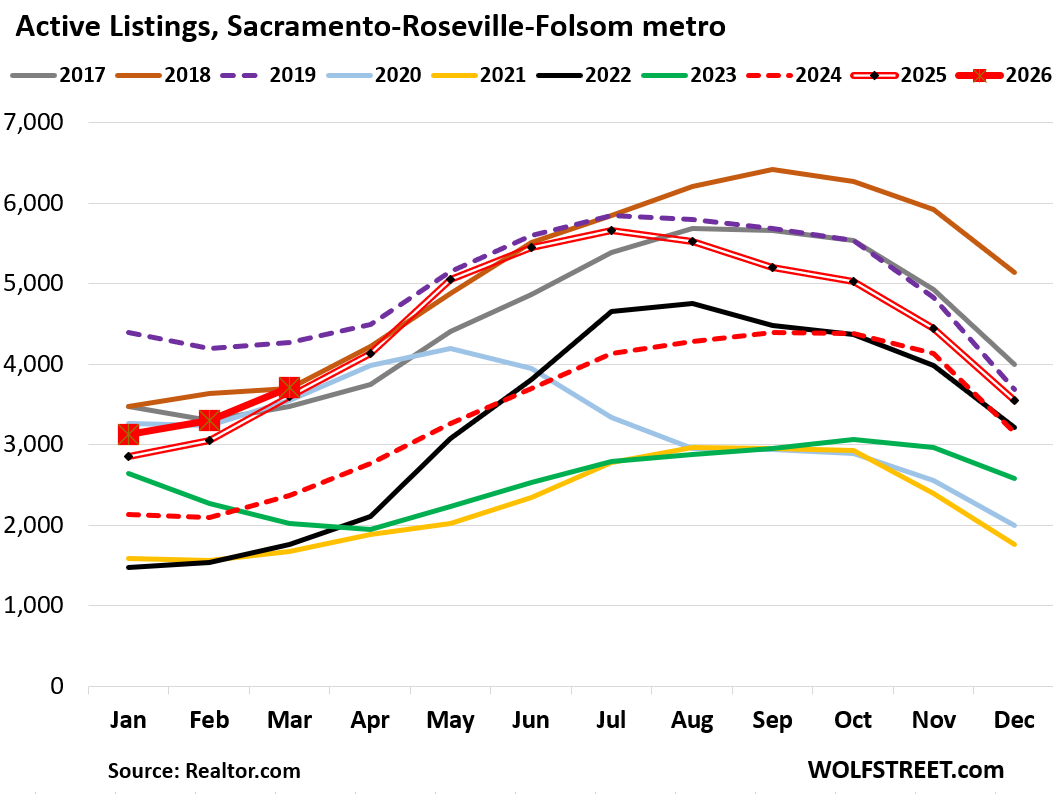
In the Sacramento-Roseville-Folsom metro, active listings rose by 3% year-over-year, and by 57% from two years ago, to 3,715 homes for sale, the second-highest March in those 10 years, behind only March 2019.
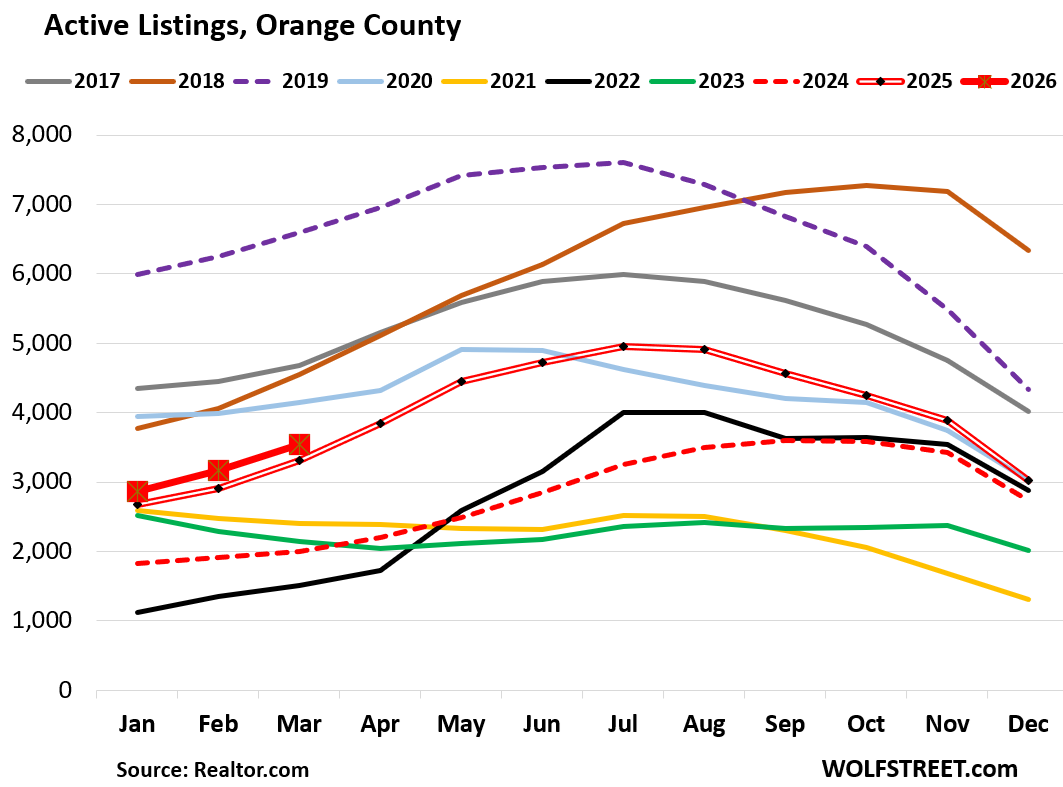
Orange County: Active listings rose by 7% year-over-year, and by 78% from March 2024, to 3,544 homes.
Inventory in Orange County got a late start taking off, but spiked from those very low levels starting in 2024. It still has some catching up to do.
Fresno metro: Active listings rose by 10% year-over-year, and by 55% from two years ago, to 1,872 homes for sale, the second-highest March in those 10 years, behind only March 2019.
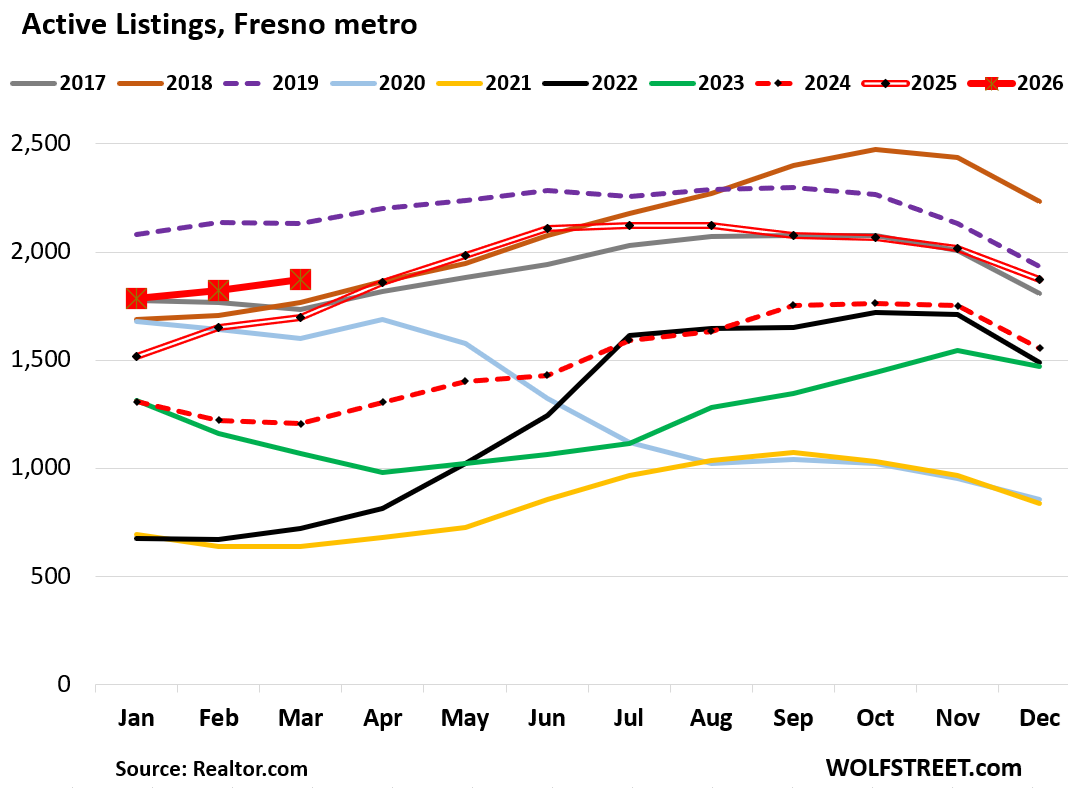
It’s a buyers’ market, but the buyers left.
Pending sales of existing homes in the West inched up by 0.9% in February from January, seasonally adjusted, and by 3% from a year ago, wobbling along at rock-bottom, down by 33% from February 2019, according to data from the National Association of Realtors (more here).
Pending sales track contracts that were signed but haven’t closed yet. A portion of them get canceled for various reasons, including difficulties in getting affordable homeowners’ insurance.
Enjoy reading WOLF STREET and want to support it? You can donate. I appreciate it immensely. Click on the mug to find out how:

![]()
Looks like this Mexican standoff is not ending anytime soon… Price still nuts for the lost part, demand is in the gutter but that stubbornness of pulling off the market and hoping for a better day mindset is still rampant..
Maybe we do need the global event in the middle east to play out that might trigger a forced downturn to “motivate” some of these boomer sellers with extra houses to sell, if their retirement portfolio tank fast and hard, it might give them less room to wait out the market. Until then Mexican standoff continues especially in SoCal