Each city has its own housing market. In some, home prices have dropped a lot; in others, prices have hit new highs.
By Wolf Richter for WOLF STREET.
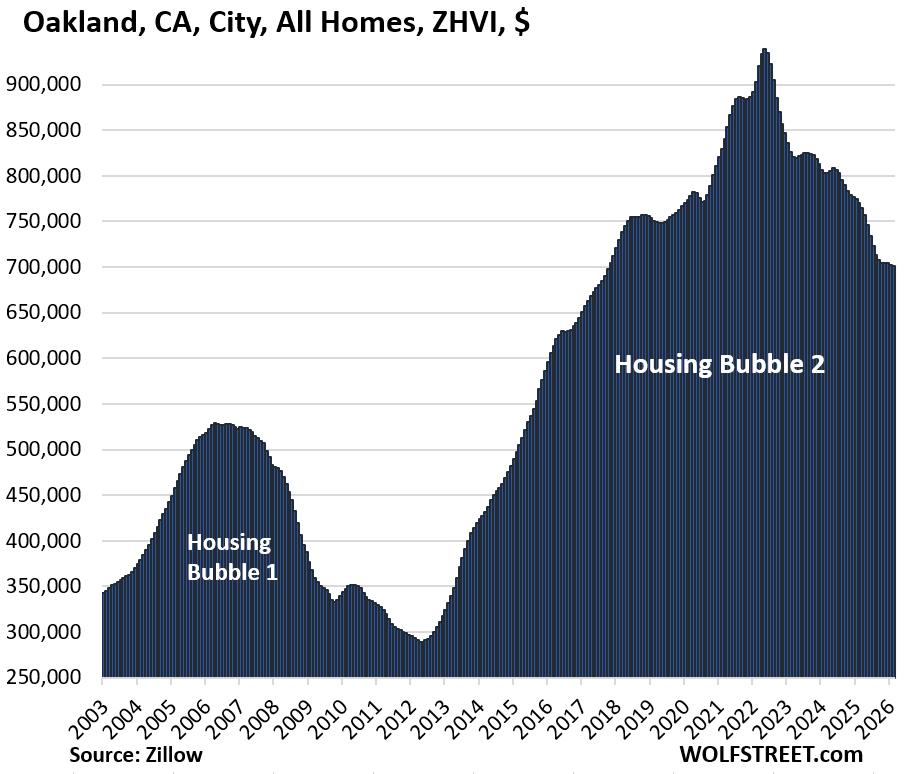
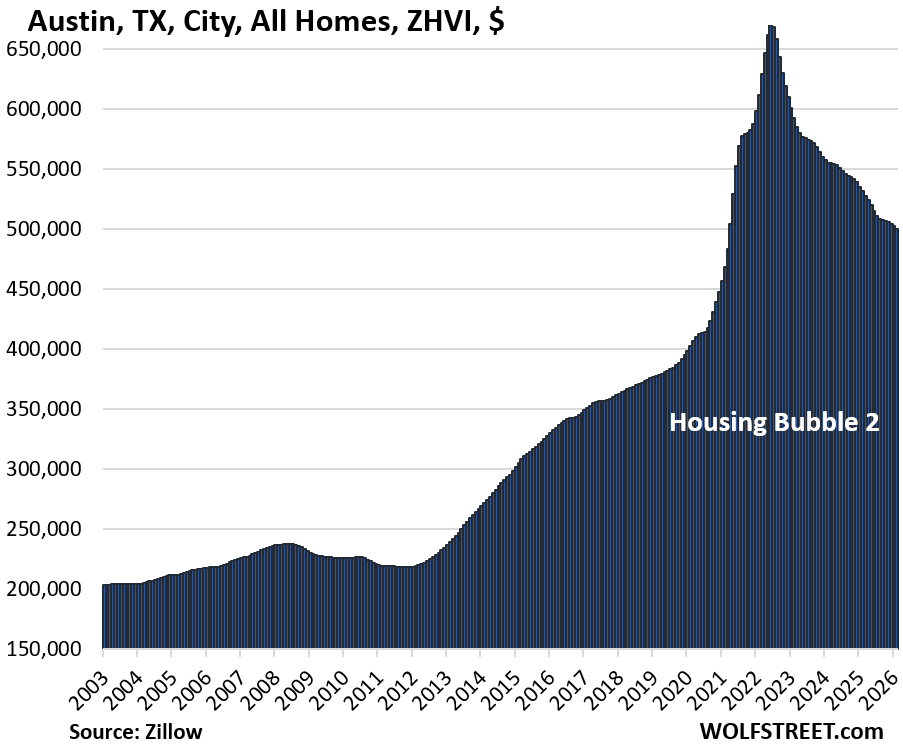
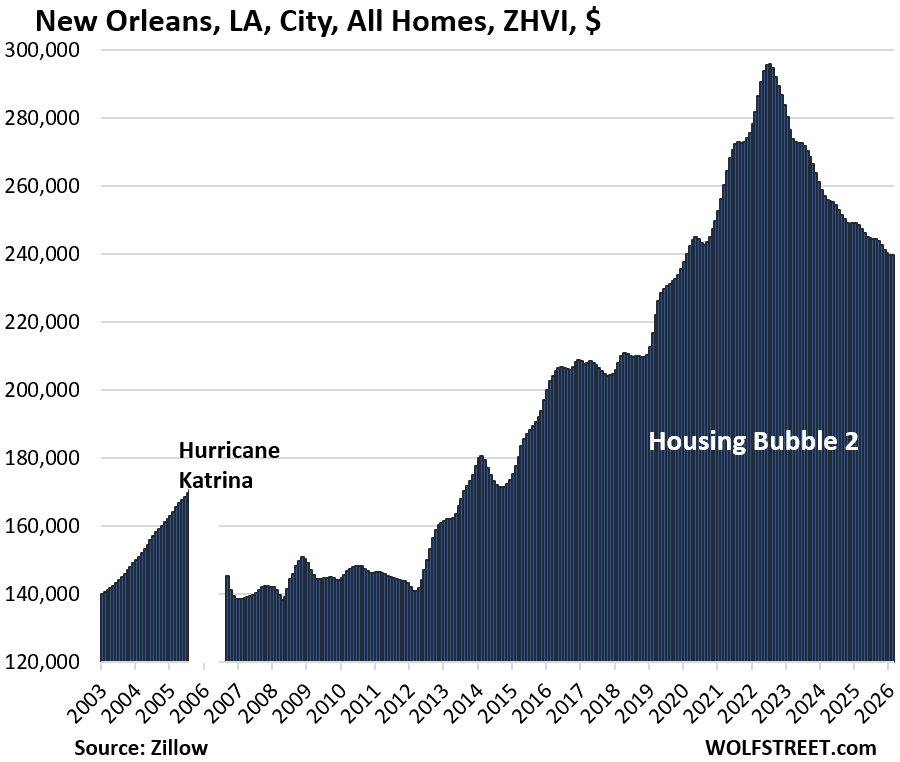
Here we track 33 big and expensive cities. In 27 of the 33 cities, prices of mid-tier single-family homes, condos, and co-ops in February were down from their respective peaks in prior years, led by Austin (-25%), Oakland (-25%), and New Orleans (-19%).
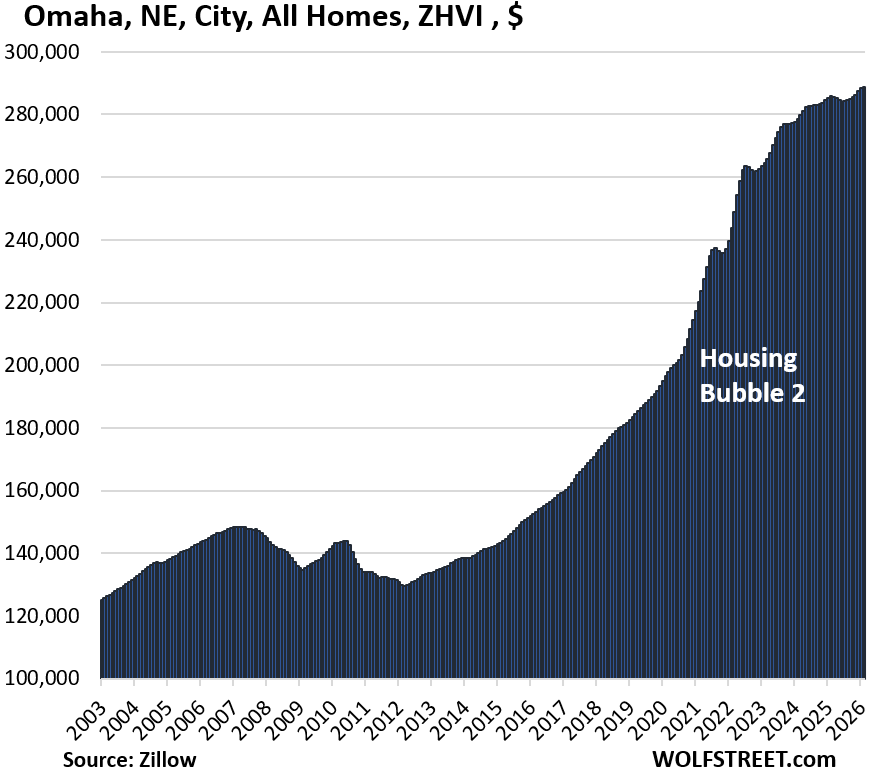
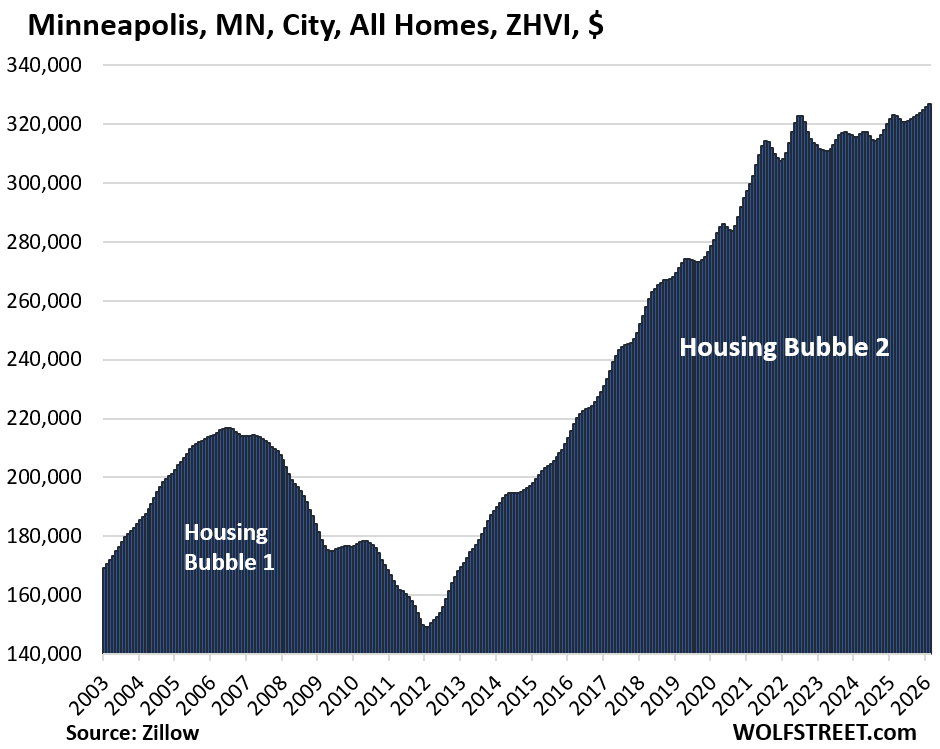
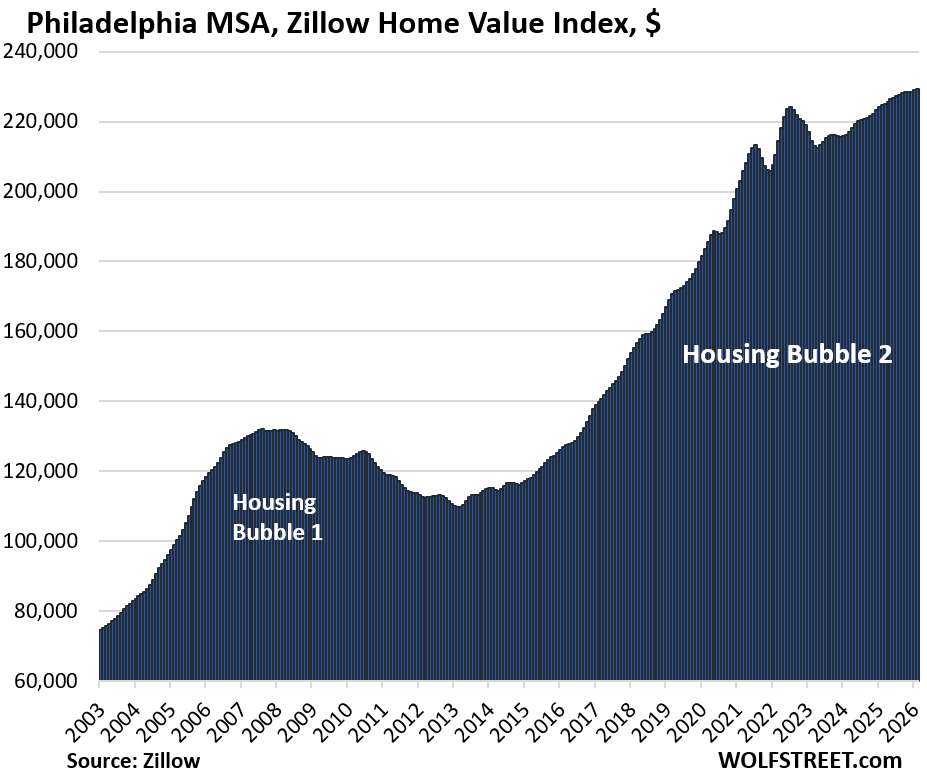
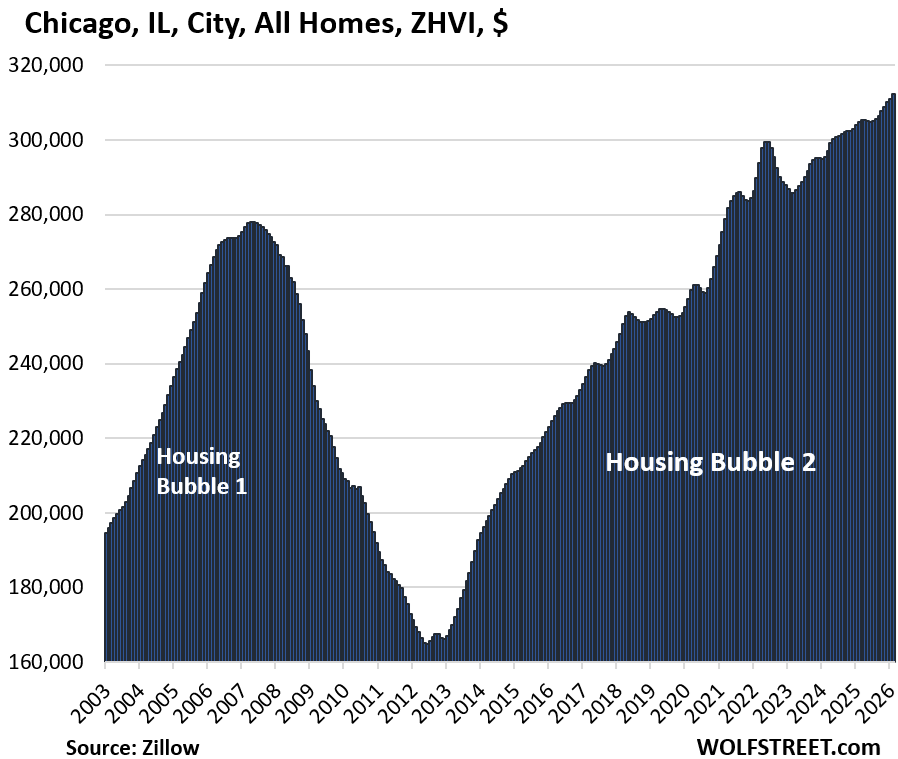
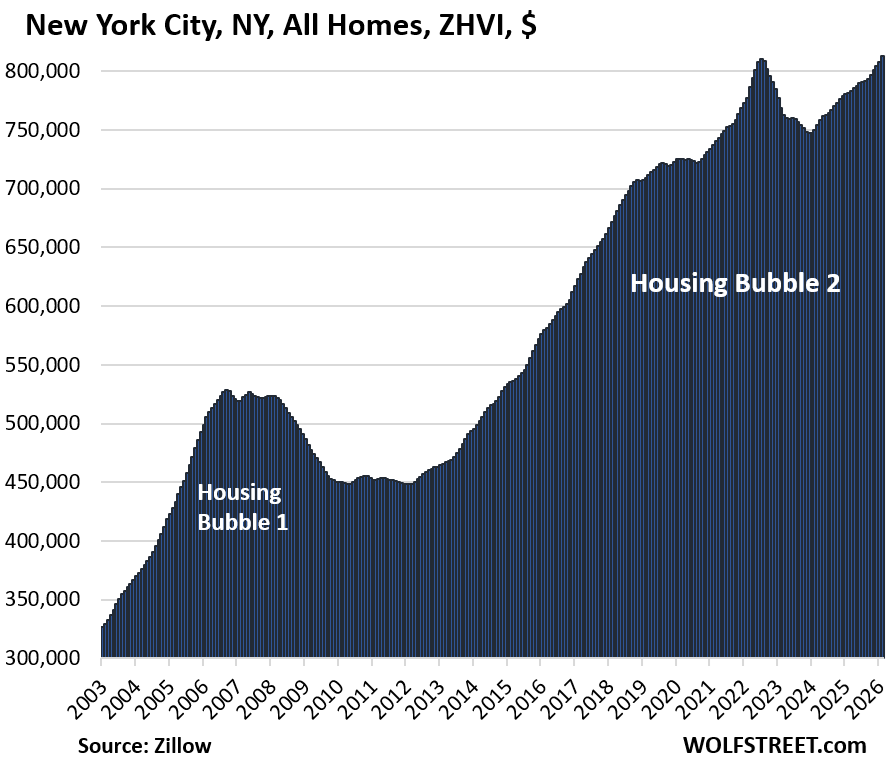
In five of the 33 cities, prices have continued to rise, though at a much slower pace than in the heady free-money days of 2021 and 2022, and reached new highs in February on a seasonally adjusted basis: New York City, Minneapolis, Chicago, Philadelphia, and Omaha.
All of these 33 cities had huge price gains in the two years between mid-2021 and mid-2022, and some had veritable price explosions in those two years, led by Austin +62%, Phoenix +60%, Fort Worth +50%, Raleigh +49%, and Sacramento +39%, fueled by the Fed’s reckless free-money policies which generated the below-3% mortgages even as inflation was heading toward 9%, and by crazed FOMO buying behavior.
Those price gains came on top of the outsized price gains in the prior years. In many of the 33 big and expensive cities here, prices have more than doubled in the 10 years between 2012 and 2022, and in some cities more than tripled, such as in Oakland, Austin, and others — a historic affordability problem with big economic and social consequences. Price drops have begun to whittle away at the affordability problem, but just barely.
The price measurement here is the seasonally adjusted three-month-average mid-tier Zillow Home Value Index (ZHVI), released today. Mid-tier means the middle-third by price in each market. The ZHVI is based on millions of data points in Zillow’s “Database of All Homes,” including from public records (tax data), MLS, brokerages, local Realtor Associations, real-estate agents, and households across the US. It includes pricing data for off-market deals and for-sale-by-owner deals. Zillow’s Database of All Homes also has sales-pairs data.
To qualify for the list of the 33 most splendid housing bubbles, the city must be one of the largest by population and be among the expensive cities where the ZHVI for all mid-tier homes must have been at least $300,000 at some point. Some cities that are large enough don’t qualify for this list because the ZHVI for all homes never reached $300,000, despite the surge in recent years, such as the cities of New Orleans, Houston, Philadelphia, Memphis, Oklahoma City, Tulsa, Kansas City, Cincinnati, Pittsburgh, etc.
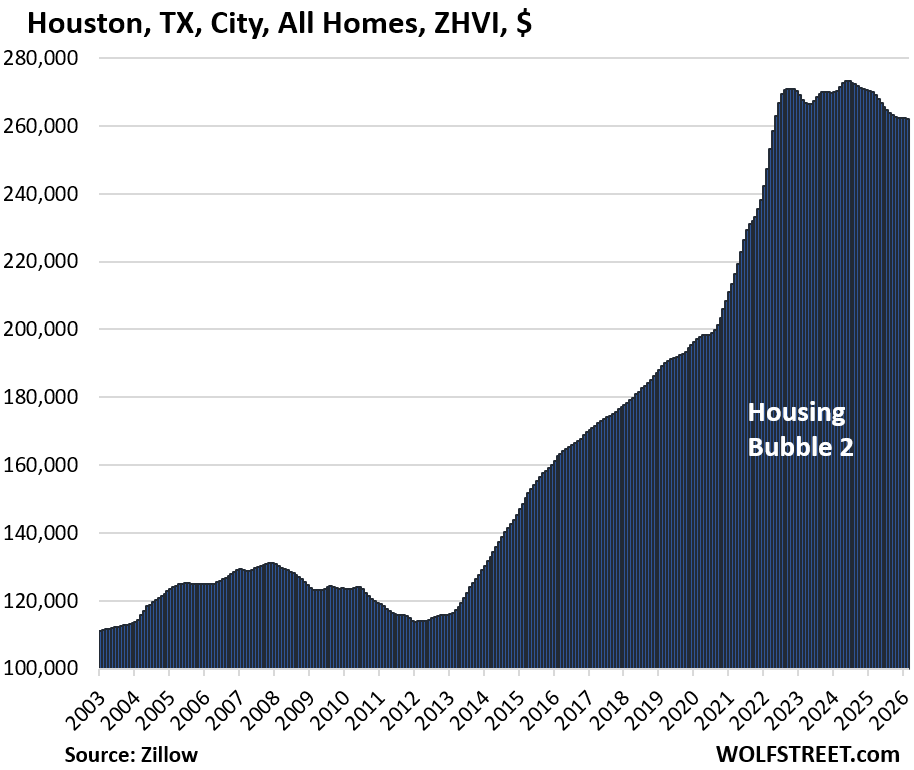
But, but, but… Houston, New Orleans, Philadelphia, and Omaha are included anyway:
- Houston because it is the fourth-largest city in the US, and at the peak was not that far from $300,000;
- New Orleans because it got within spitting distance of $300,000 in 2022;
- Philadelphia because it’s the sixth-largest city in the US, though home prices were far below the $300,000 cutoff (it’s a deal: 6 mid-tier homes in Philadelphia for the price of 1 in San Jose);
- Omaha, because it’s within spitting distance of the $300,000, and because it’s the most expensive big city in the center of the US.
The 33 Most Splendid Housing Bubbles.
In the little tables, MoM = month over month; YoY = year-over-year. The column furthest to the right shows the percentage increase “since 2000.” All seasonally adjusted.
| Oakland, City, CA, All Homes, Prices | |||
| From May 2022 peak | MoM | YoY | Since 2000 |
| -25.4% | -0.2% | -9.1% | 247% |
Lowest since October 2017.
| Austin, TX, City, All Homes, Prices | |||
| From Jun 2022 peak | MoM | YoY | Since 2000 |
| -25.3% | -0.5% | -5.9% | 156% |
And prices continue their return to reality.
| New Orleans, LA, City, All Homes, Prices | |||
| From Jun 2022 peak | MoM | YoY | Since 2007 |
| -19.0% | 0.0% | -3.6% | 106% |
Lowest since February 2020.
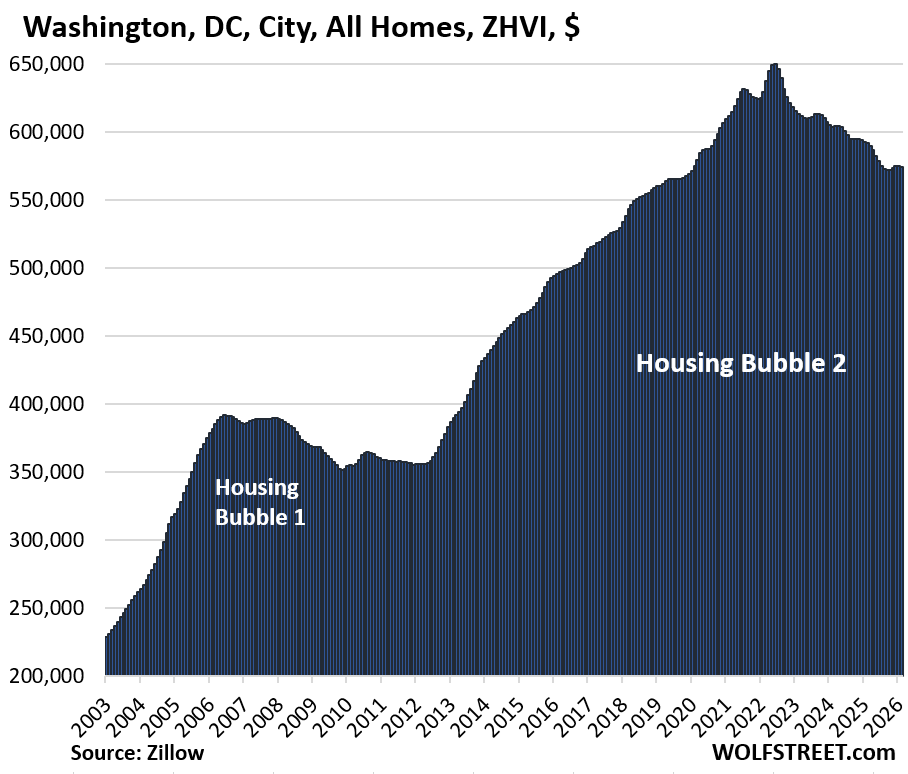
| Washington D.C., All Homes, Prices | |||
| From Jun 2022 peak | MoM | YoY | Since 2000 |
| -11.7% | -0.2% | -3.0% | 259% |
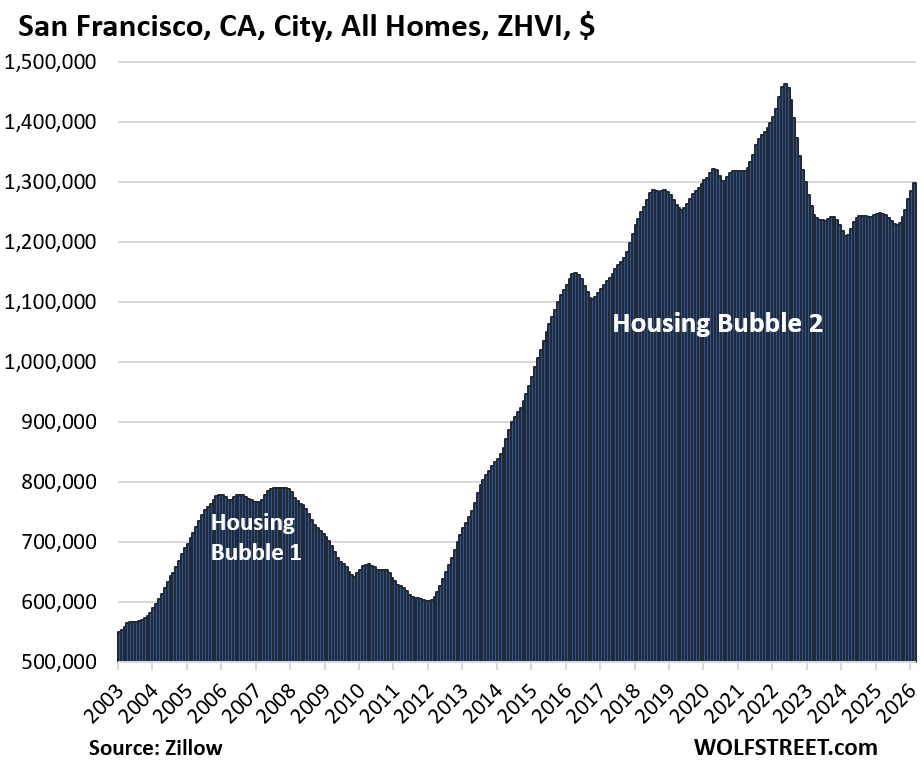
| San Francisco, CA, City, All Homes, Prices | |||
| From May 2022 peak | MoM | YoY | Since 2000 |
| -11.3% | 1.0% | 4.0% | 223% |
As AI mania is now in full swing, despite all this talk about tech layoffs, and with investor-provided circular AI money flowing knee-deep through the streets, there is now a “mansion shortage,” that is spreading pressures into mid-tier homes too.
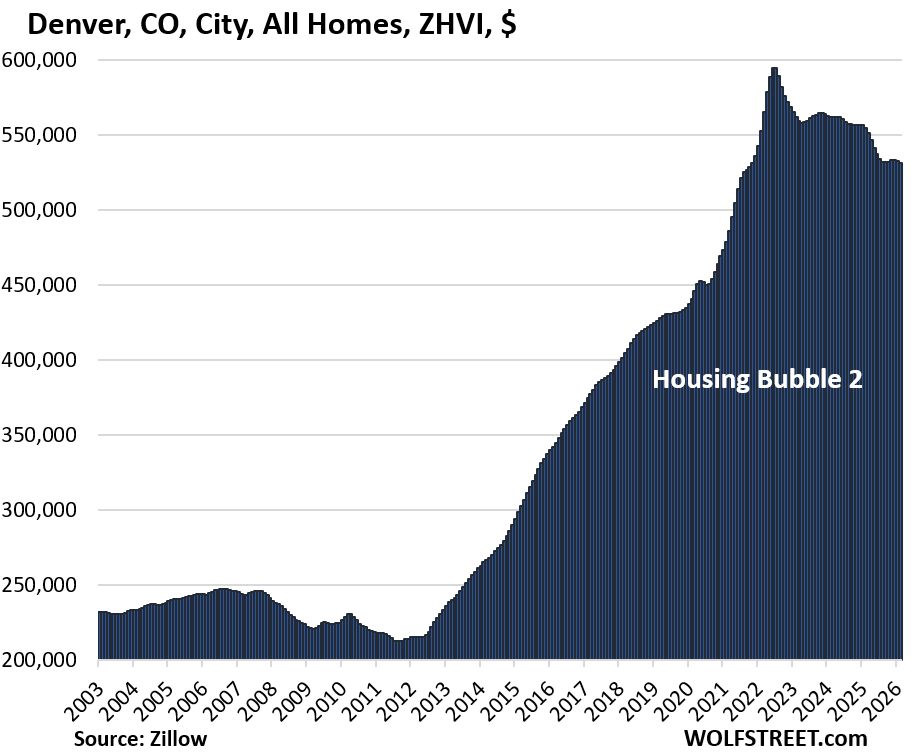
| Denver, CO, City, All Homes, Prices | |||
| From Jun 2022 peak | MoM | YoY | Since 2000 |
| -10.7% | -0.4% | -4.3% | 202% |
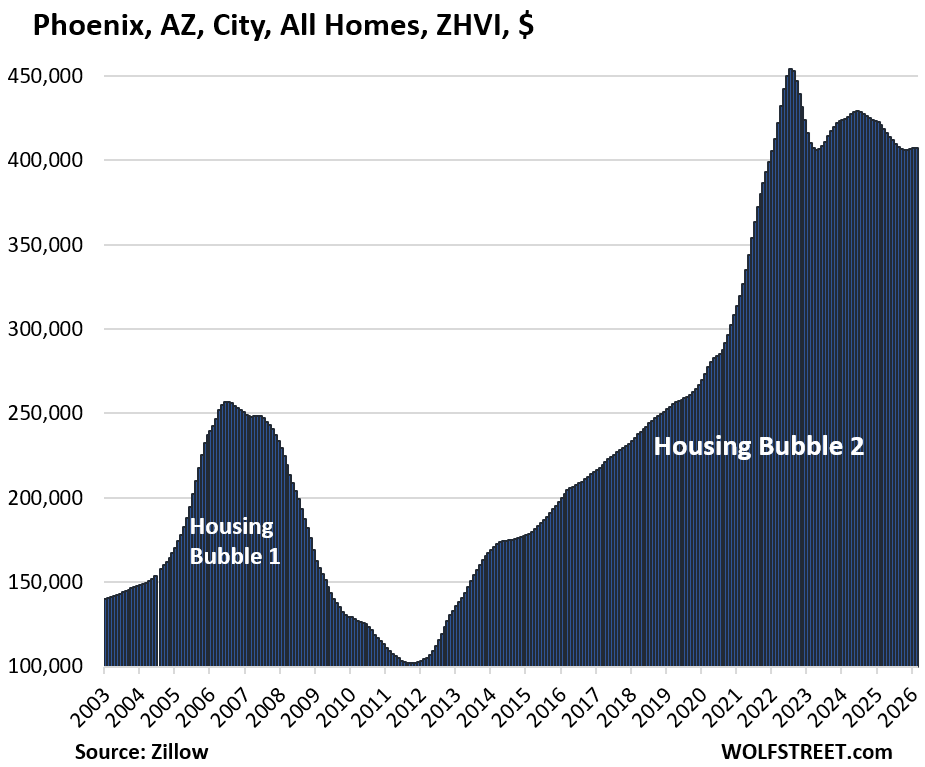
| Phoenix, AZ, City, All Homes, Prices | |||
| From Jul 2022 peak | MoM | YoY | Since 2000 |
| -10.3% | 0.1% | -3.2% | 250% |
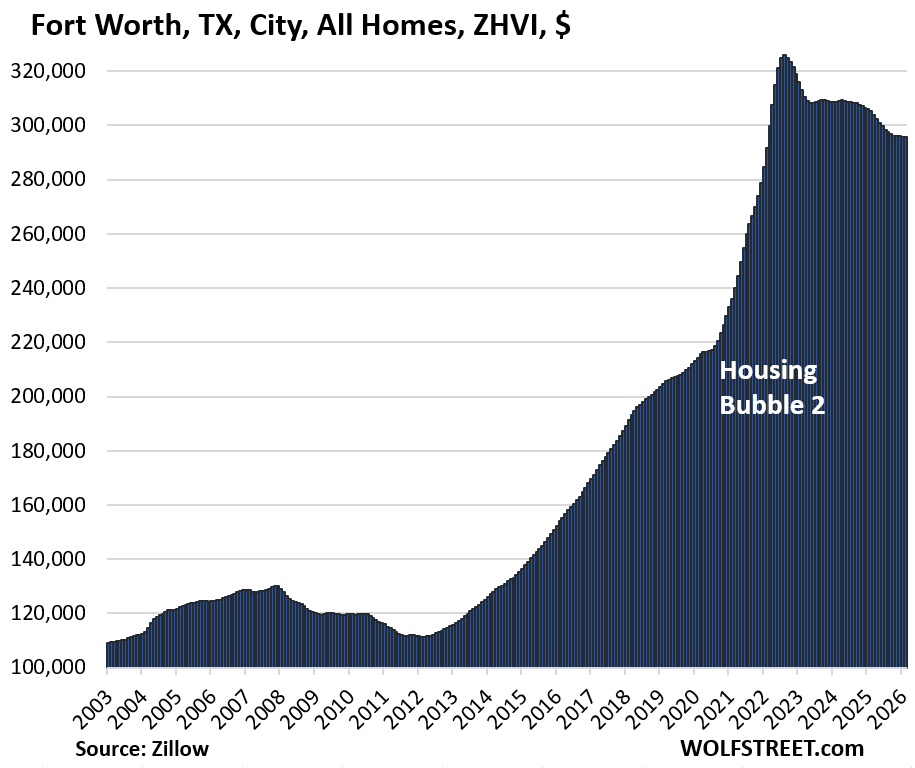
| Fort Worth, TX, City, All Homes, Prices | |||
| From Aug 2022 peak | MoM | YoY | Since 2000 |
| -9.3% | 0.0% | -3.1% | 189% |
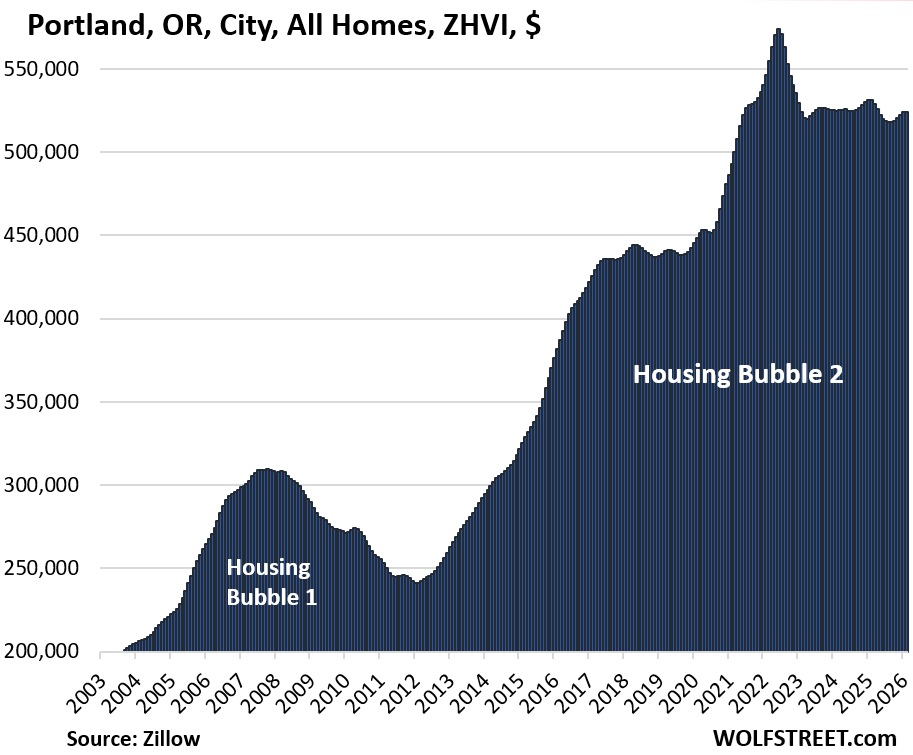
| Portland, OR, City, All Homes, Prices | |||
| From May 2022 peak | MoM | YoY | Since 2000 |
| -8.7% | 0.1% | -1.3% | 218% |
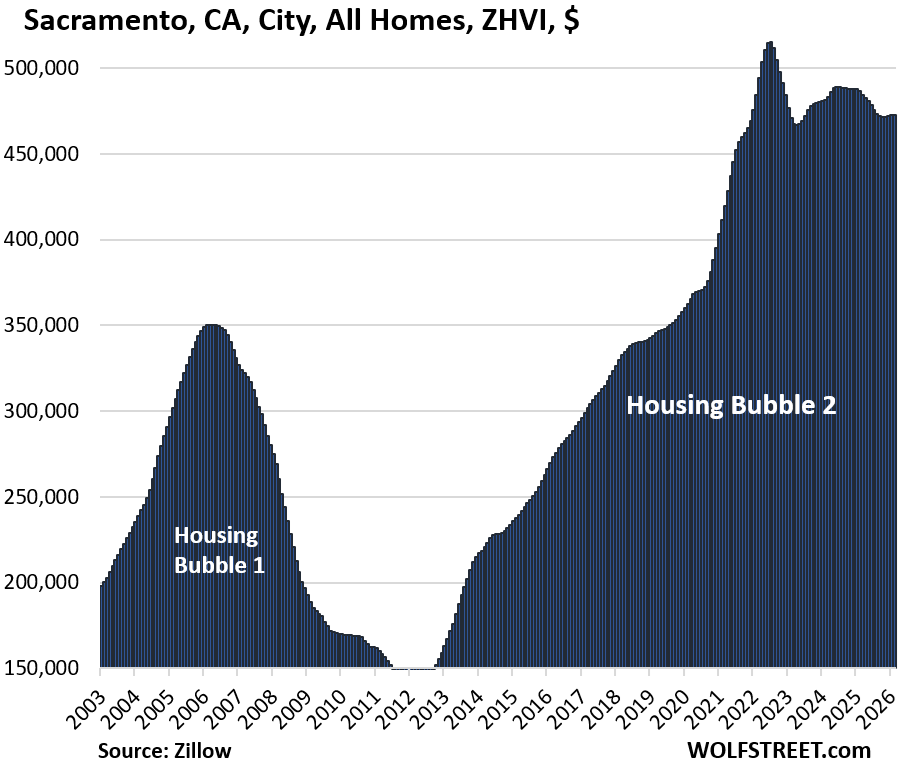
| Sacramento, CA, City, All Homes, Prices | |||
| From July 2022 peak | MoM | YoY | Since 2000 |
| -8.3% | 0.0% | -2.9% | 286% |
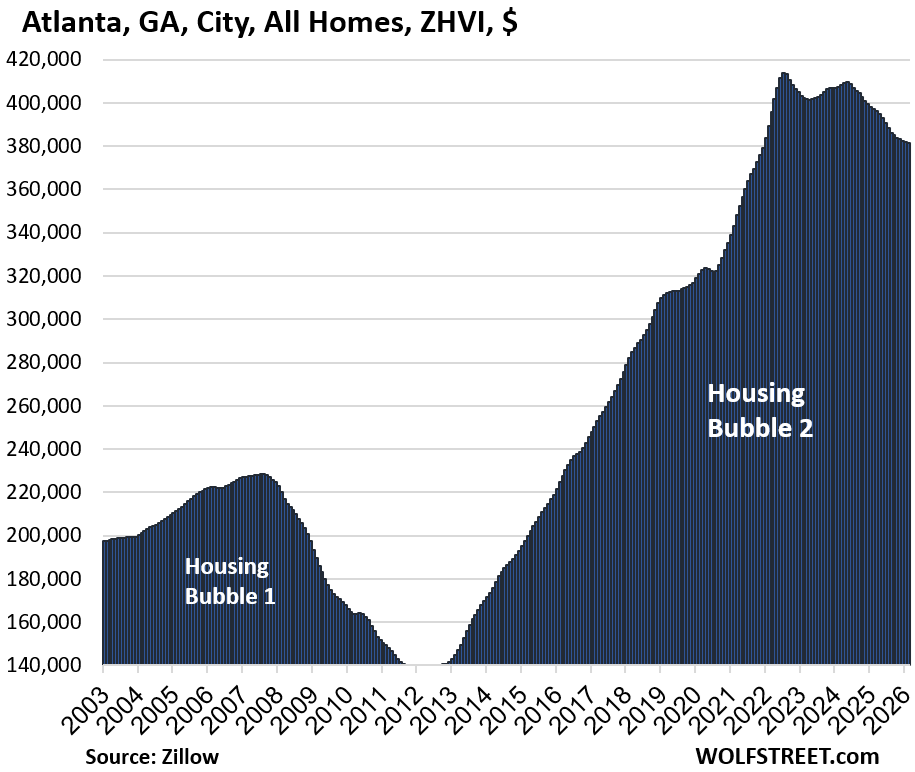
| Atlanta, GA, City, All Homes, Prices | |||
| From Jun 2022 peak | MoM | YoY | Since 2000 |
| -7.8% | -0.1% | -4.0% | 140% |
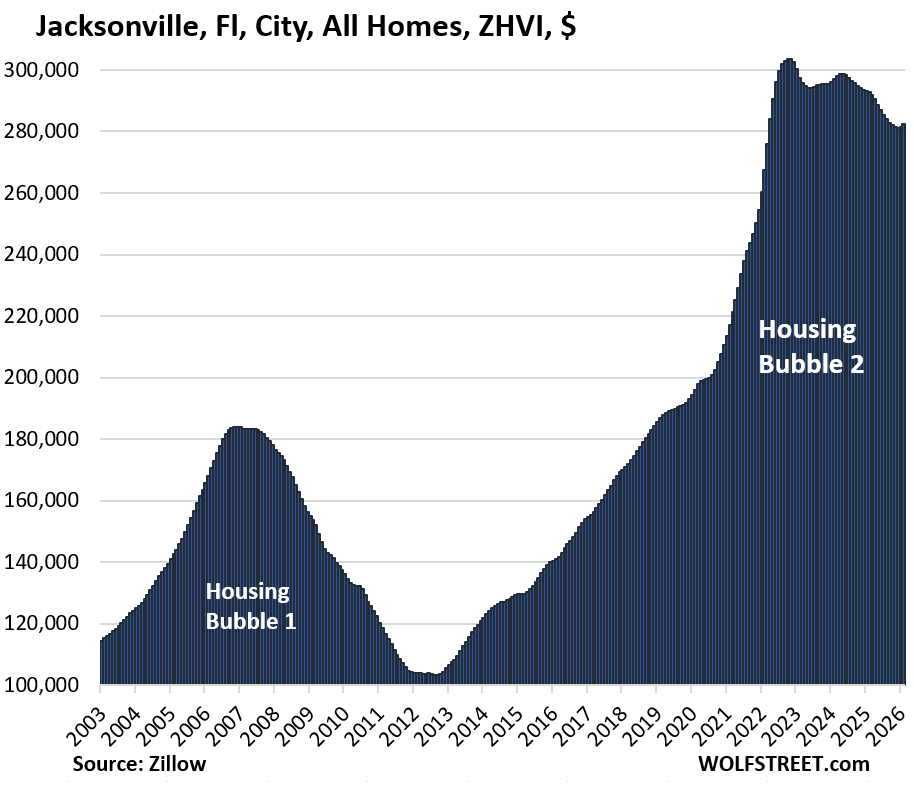
| Jacksonville, FL, City, All Homes, Prices | |||
| From Nov 2022 peak | MoM | YoY | Since 2000 |
| -7.0% | 0.3% | -3.6% | 204% |
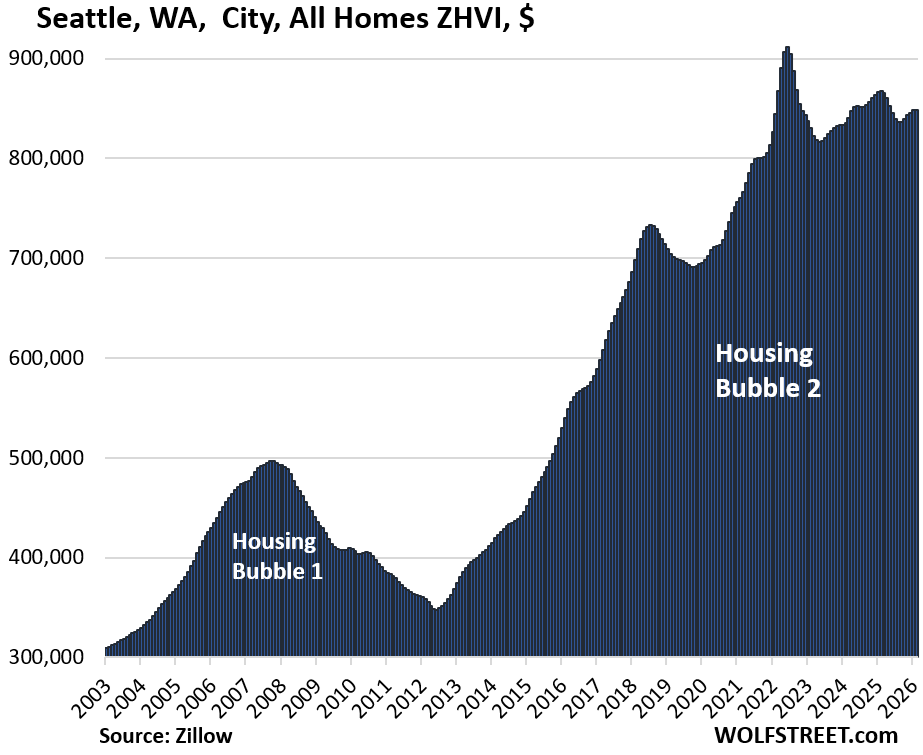
| Seattle, WA, City, All Homes, Prices | |||
| From May 2022 peak | MoM | YoY | Since 2000 |
| -6.9% | 0.1% | -2.2% | 231% |
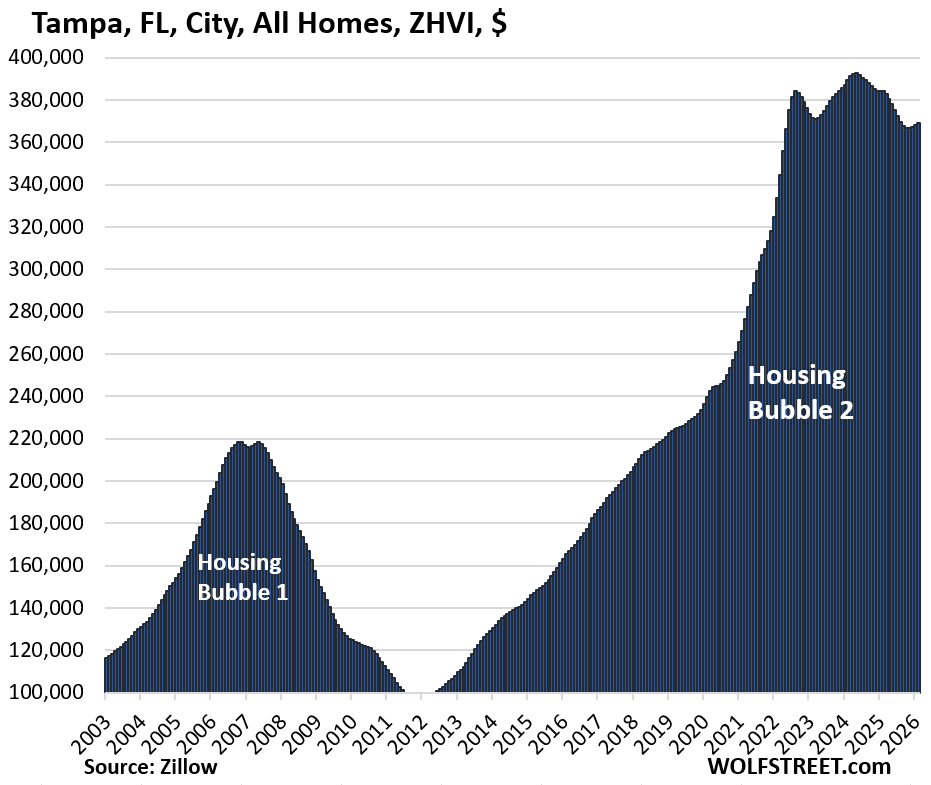
| Tampa, FL, City, All Homes, Prices | |||
| From May 2024 peak | MoM | YoY | Since 2000 |
| -6.0% | 0.2% | -3.9% | 312% |
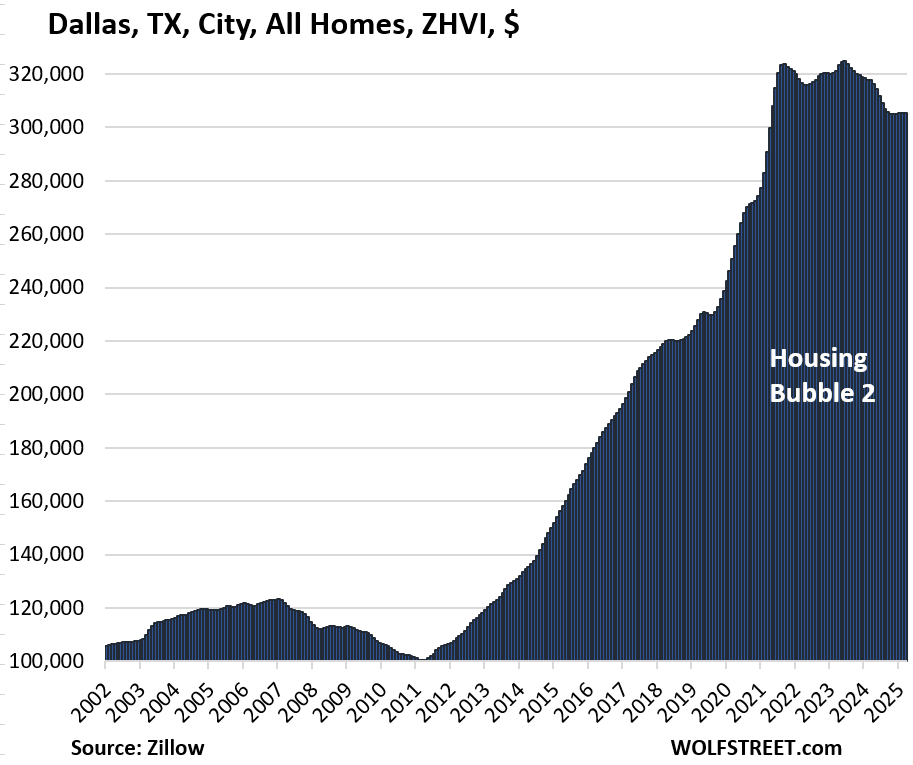
| Dallas, TX, City, All Homes, Prices | |||
| From May 2024 peak | MoM | YoY | Since 2000 |
| -5.9% | 0.0% | -3.8% | 216% |
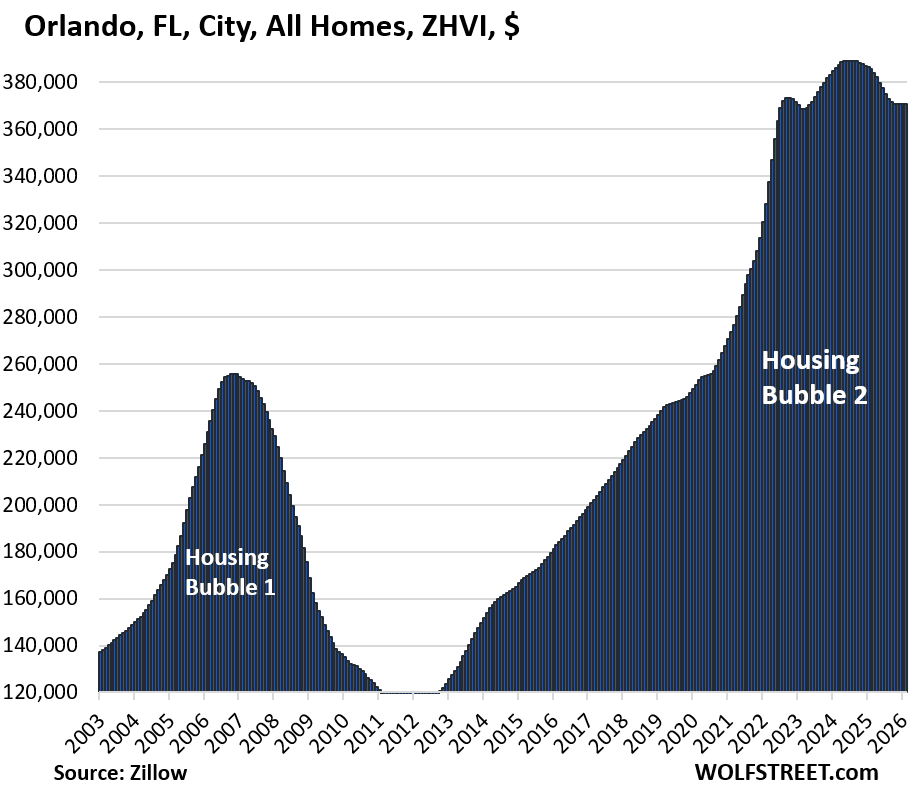
| Orlando, FL, City, All Homes, Prices | |||
| From Jun 2024 peak | MoM | YoY | Since 2000 |
| -4.7% | 0.0% | -3.8% | 241% |
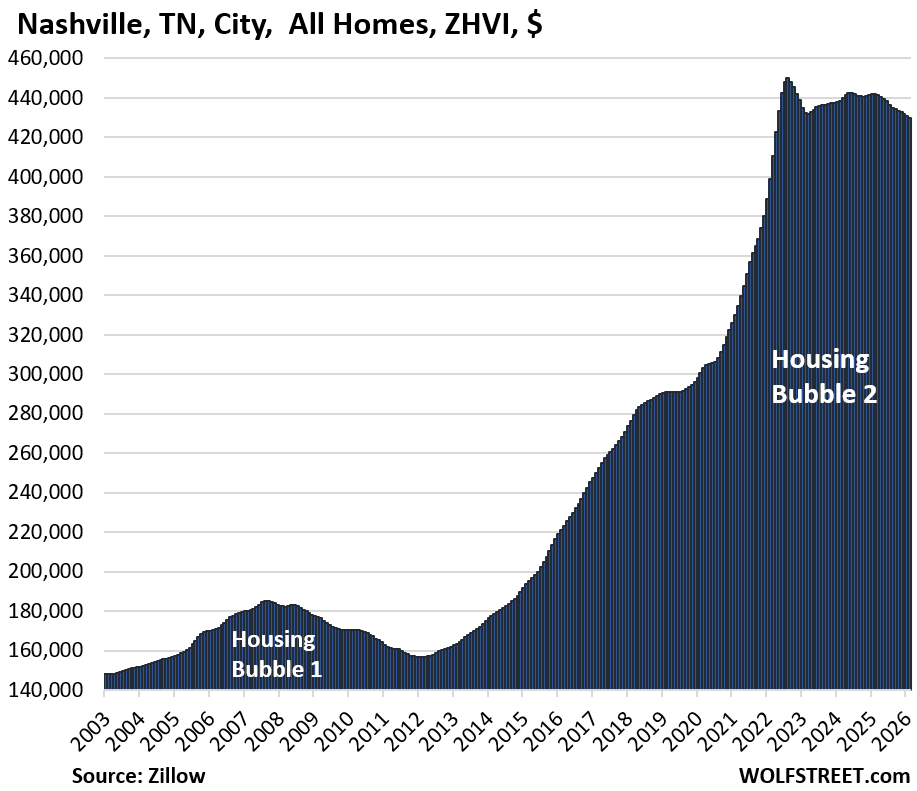
| Nashville, TN, City, All Homes, Prices | |||
| From July 2022 peak | MoM | YoY | Since 2000 |
| -4.5% | -0.3% | -2.8% | 215% |
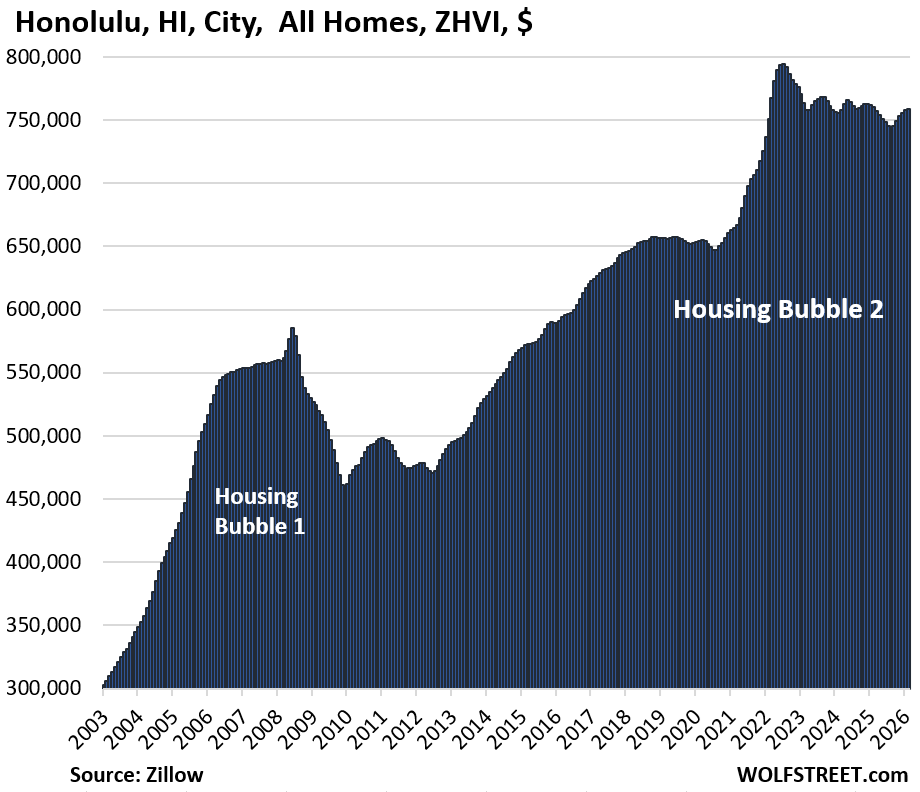
| Honolulu, HI, City, All Homes, Prices | |||
| From Jun 2022 peak | MoM | YoY | Since 2000 |
| -4.5% | 0.1% | -0.3% | 207% |
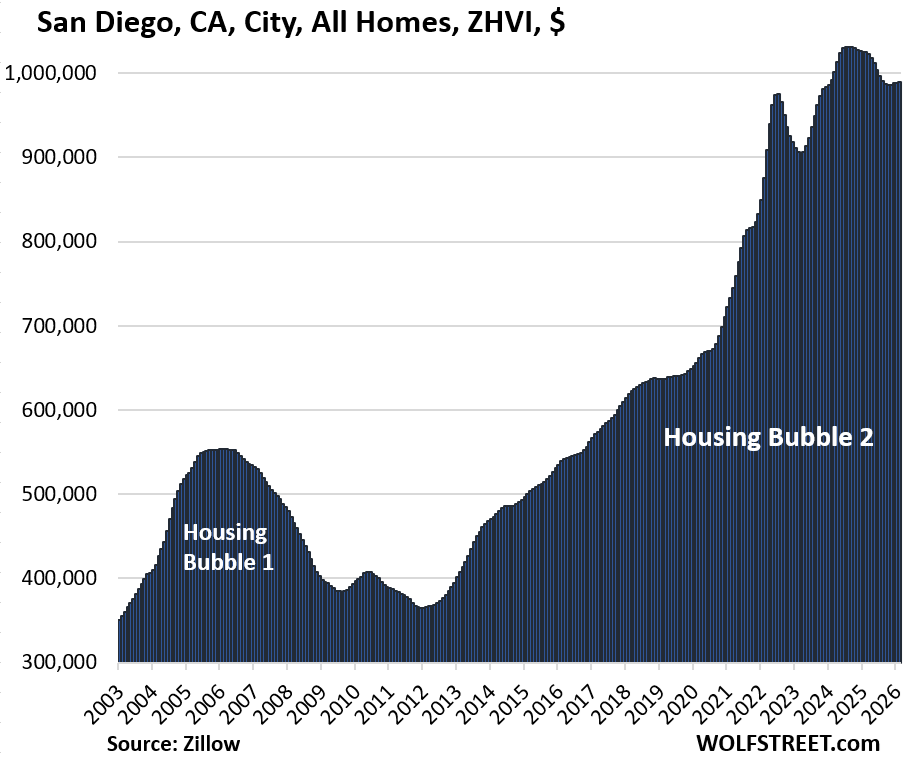
| San Diego, CA, City, All Homes, Prices | |||
| From July 2024 peak | MoM | YoY | Since 2000 |
| -4.1% | 0.1% | -3.4% | 348% |
| Houston, TX, City, All Homes, Prices | |||
| From Jul 2022 peak | MoM | YoY | Since 2000 |
| -4.1% | -0.1% | -3.0% | 155% |
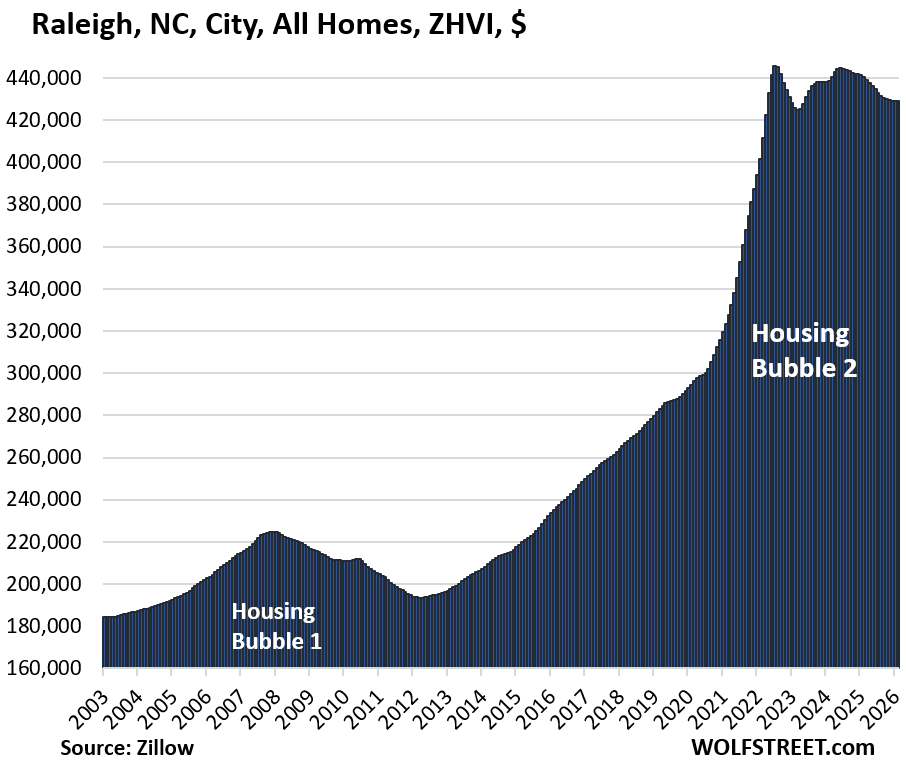
| Raleigh, NC, City, All Homes, Prices | |||
| From July 2022 peak | MoM | YoY | Since 2000 |
| -3.8% | 0.0% | -2.6% | 149% |
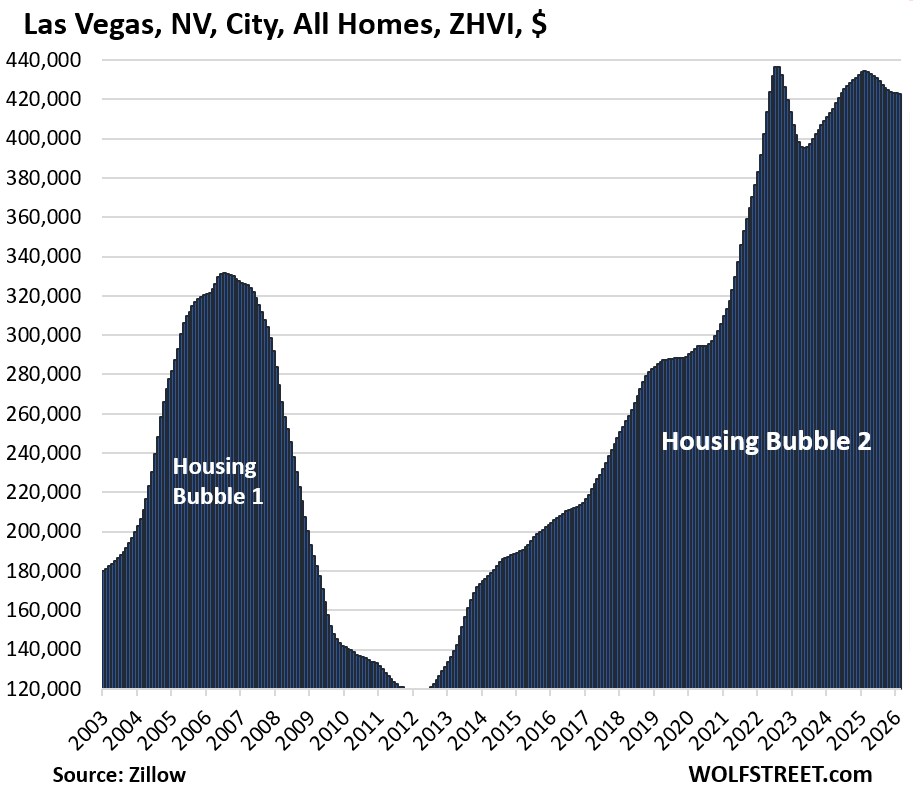
| Las Vegas, NV, City, All Homes, Prices | |||
| From June 2022 peak | MoM | YoY | Since 2000 |
| -3.2% | -0.1% | -2.6% | 177% |
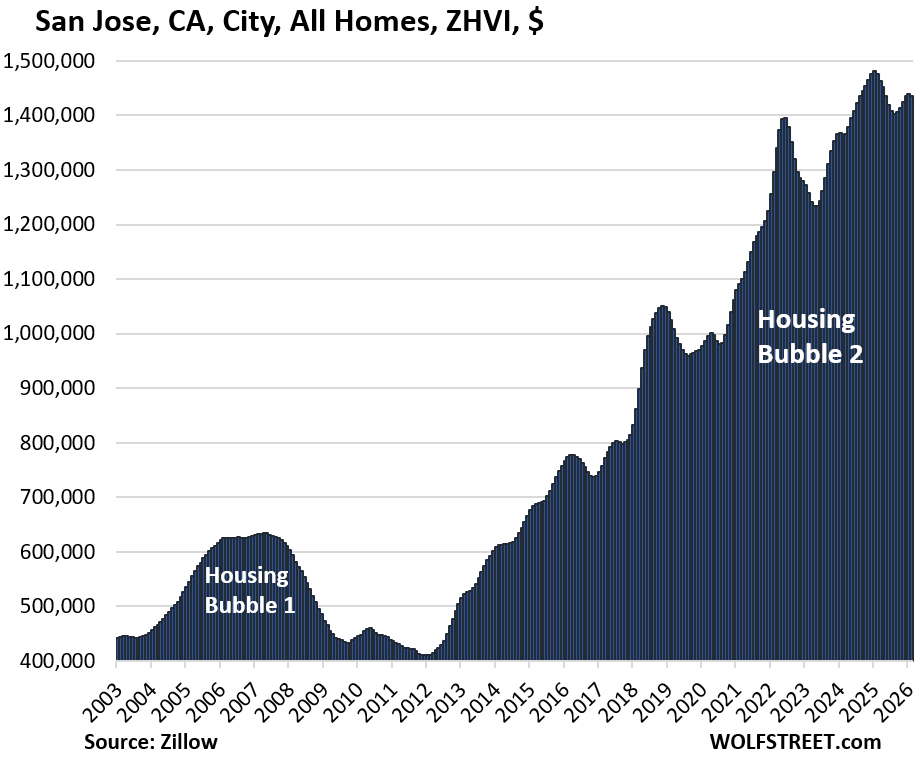
| San Jose, CA, City, All Homes, Prices | |||
| From Jan 2025 peak | MoM | YoY | Since 2000 |
| -3.0% | -0.2% | -2.7% | 344% |
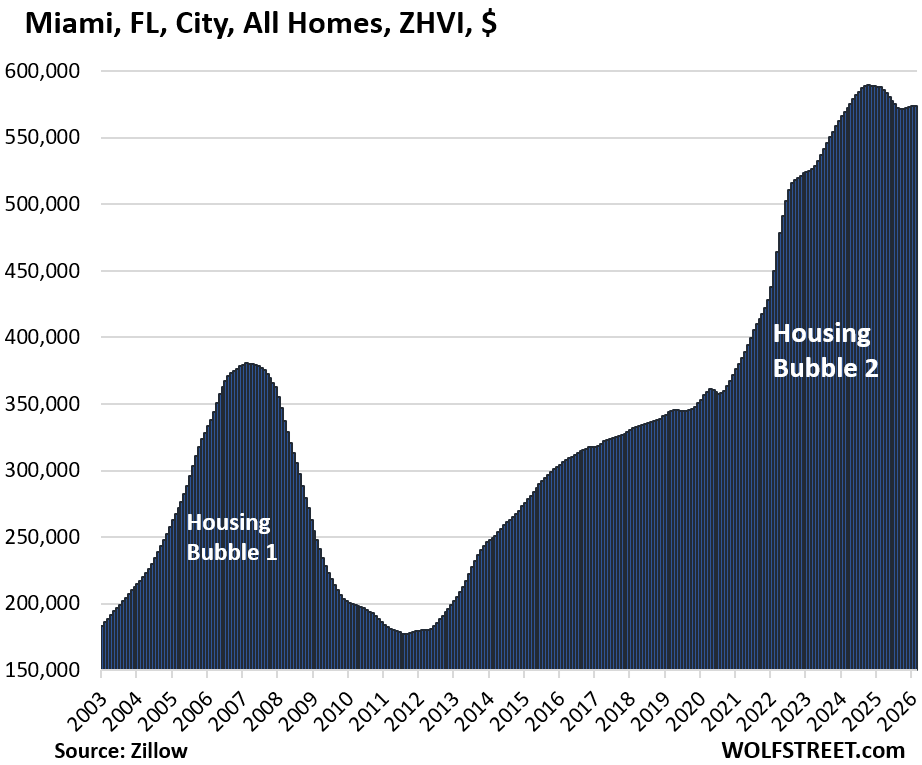
| Miami, FL City, All Homes, Prices | |||
| MoM | YoY | Since 2000 | |
| -2.7% | 0.1% | -2.3% | 342% |
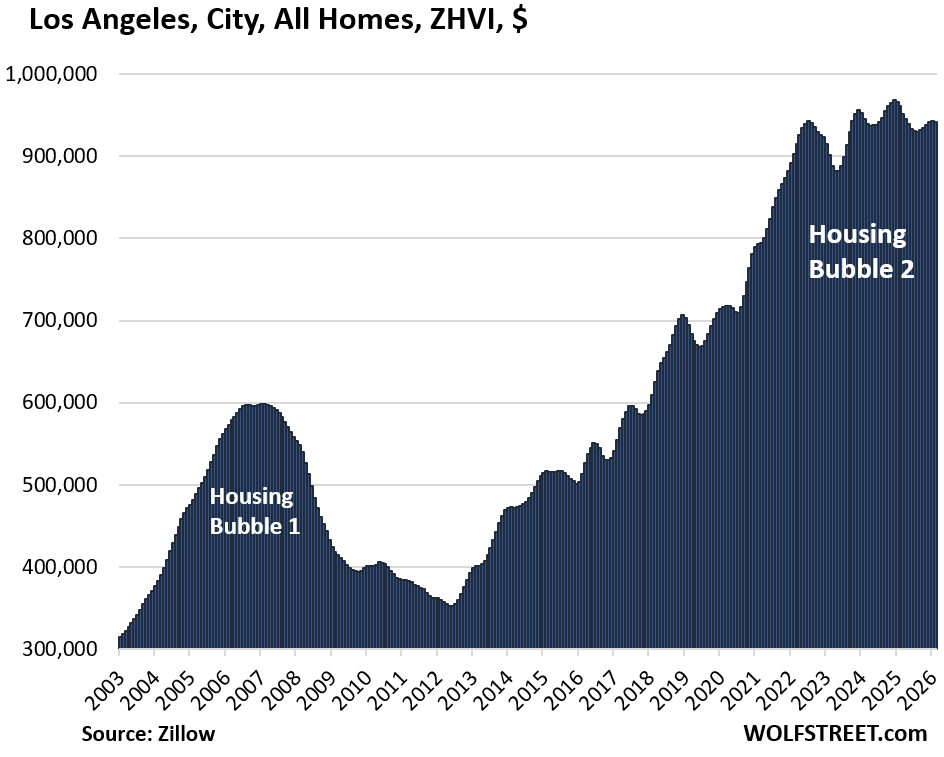
| Los Angeles, CA, City, All Homes, Prices | |||
| From Dec 2024 peak | MoM | YoY | Since 2000 |
| -2.7% | -0.1% | -1.9% | 328% |
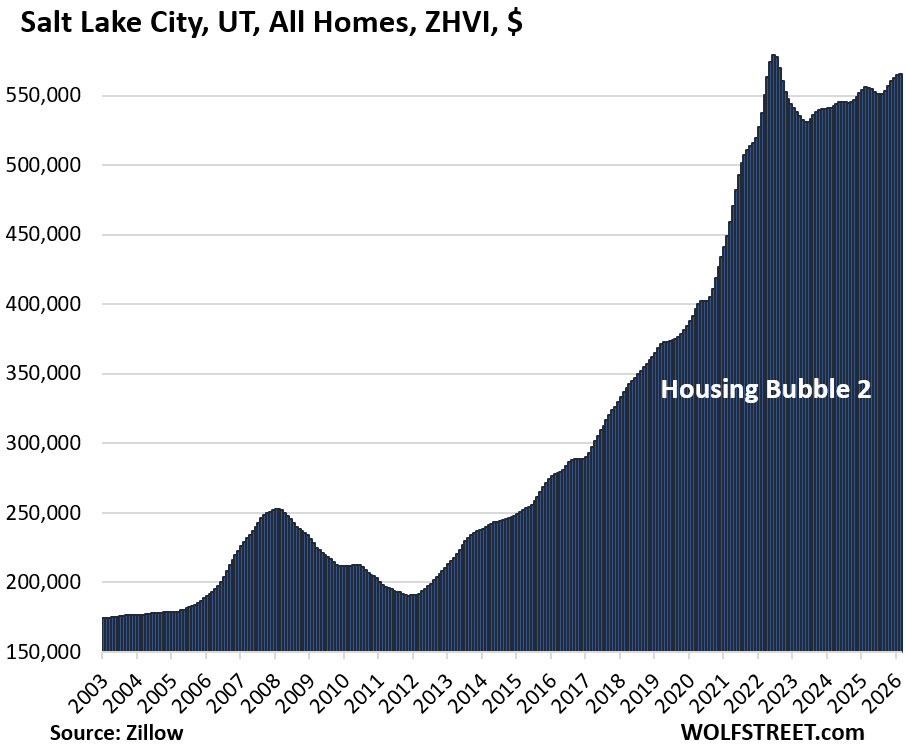
| Salt Lake City, UT, All Homes, Prices | |||
| From July 2022 peak | MoM | YoY | Since 2000 |
| -2.4% | 0.2% | 1.7% | 242% |
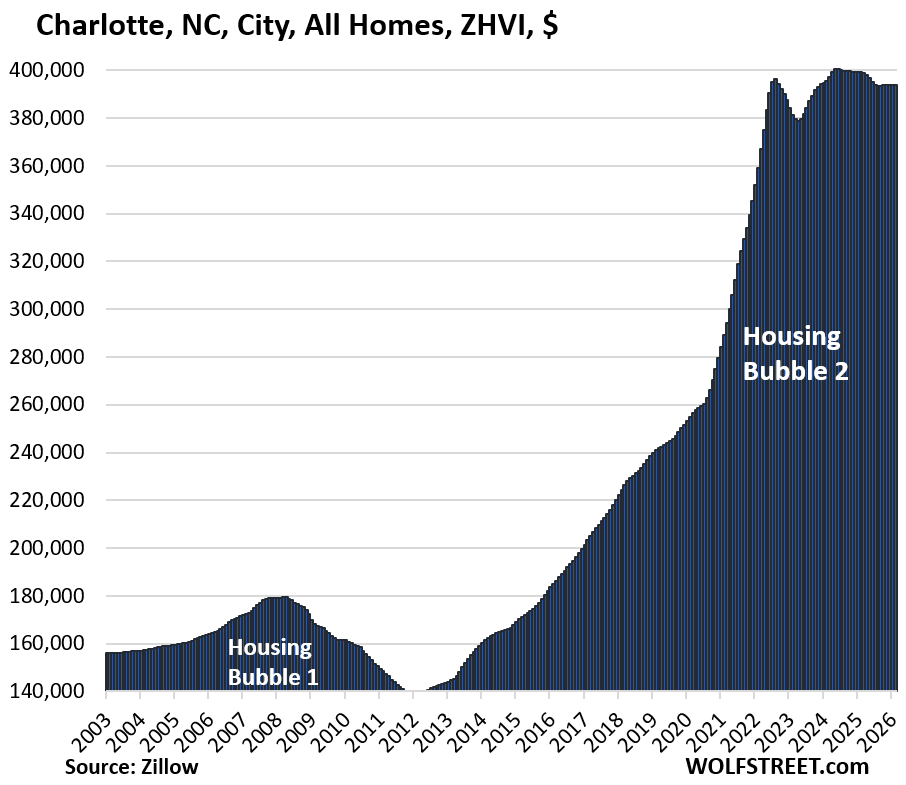
| Charlotte, NC, City, All Homes, Prices | |||
| MoM | YoY | Since 2000 | |
| -1.7% | 0.0% | -1.4% | 168% |
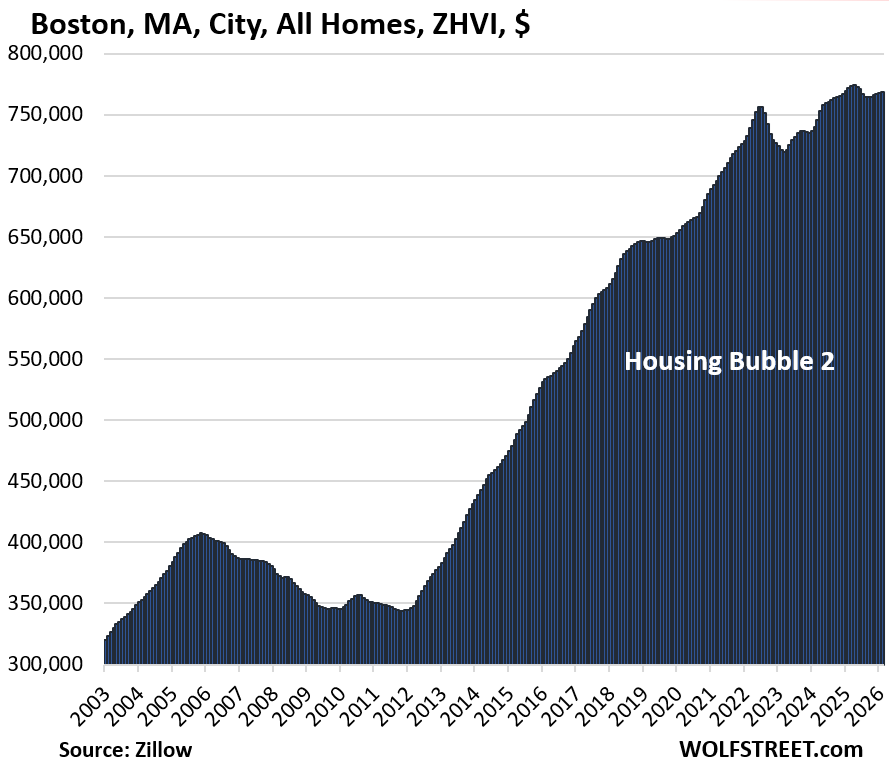
| Boston, MA, City, All Homes, Prices | ||
| MoM | YoY | Since 2000 |
| 0.1% | -0.4% | 265% |
Just a hair below a year ago. March 2025 had been the high so far seasonally adjusted.
| Ohama, NE, City, All Homes, Prices | ||
| MoM | YoY | Since 2000 |
| 0.2% | 1.0% | 151% |
| Minneapolis, MN, City, All Homes, Prices | |||
| MoM | YoY | Since 2000 | |
| 0.3% | 1.2% | 197% | |
| Philadelphia MSA, All Homes, Prices | ||
| MoM | YoY | Since 2000 |
| 0.2% | 2.1% | 273% |
| Chicago, IL, City, All Homes, Prices | ||
| MoM | YoY | Since 2000 |
| 0.4% | 2.5% | 115.0% |
| New York City, NY, All Homes, Prices | ||
| MoM | YoY | Since 2000 |
| 0.6% | 4.0% | 236.6% |
Eked out a new high, surpassing the high from July 2022.
Enjoy reading WOLF STREET and want to support it? You can donate. I appreciate it immensely. Click on the mug to find out how:

![]()
What about Las Vegas?
Doesn’t it fit your criteria?
Ctrl F las vegas
This housing doesn’t look like it will be affordable without a “black swan” event. Looking at the 1950s nevada atomic testing fallout maps shows the entire country covered by huge swaths that no one cares about today. Perhaps world current events are not so worrying…
It’d be, just have patience:
“In 27 of the 33 cities, prices of mid-tier single-family homes, condos, and co-ops in February were down from their respective peaks in prior years, led by Austin (-25%), Oakland (-25%), and New Orleans (-19%).”
Austin was one of the hottest market , many thoughts come what may, it wont crash.
Price Reduction not at all sufficient. Prices have to go down across all cities by 40% to go back to 2019 levels to make it affordable.
I thought NYC was dead? No yet!
Realtors in Miami are reporting massive numbers of NYC’ers who have been buying houses in Miami sight-unseen since Mamdani proposed his “millionaire tax”.
“Realtors reporting” is where I stop listening. They’re hyping real estate. That’s their job. Buy now before it’s too late.
Wealthy New Yorkers have been buying their 2nd/3rd home or condo in FL for years. This is nothing new. Realtors and the media pretend the wealthy are “fleeing” NYC which is such bs propaganda.
Why? Who told you? Why’d you believe it?
NYC is too crowded, no one goes there anymore.
As bubbles go, this one is taking a long time to burst.
These price decreases look more like consolidation after a mania.
So all the kings horses and all the kings men,
Just couldn’t put that housing bubble back to where it’s been. So we thought. Now what wolf?
Like the proverb describes that what goes up will come down as preached by my Irish Catholic Mother as waiting for the other shoe too drop.
Patric’s day too celebrate at least the notion that perhaps humanity is what was required too relieve the grinding poverty as British subjects they endured.
They populated America and brought with them a first hand knowledge of being Irish which often results in unpopular opinions.
Hey, why’d you delete the content on ratio of median income to house values?
Do you not find the data fascinating? E.g. that Minneapolis is still relatively affordable even with all the price inflation?
Go to social justice warrior websites to engage in that stuff.
Here we do asset prices, interest rates, that kind of stuff. You don’t adjust the S&P 500 to median household incomes either to get a stock market affordability ratio.
In addition, all those ratios are fraught with BS, including that they use median household incomes, which is pushed down by lots of singles, including those that are starting out, and widows and widowers, with no interest in buying a house. They should at least use married couple median incomes, which is much higher, and which the Census Bureau also provides. Anyway, this is social justice warrior stuff. Doesn’t belong here. If I wanted to post “affordability” charts, I would. But I don’t.
Wolf is in the process of developing/launching his
“Social Justice Warriors” website. You (those interested) can buy the IPO stock for $195/share. Price should quadruple within a year!
Last year I saw SF Bay Area prices going up or stayed same. specially closer to SF and Single family homes.
Nice to see It is reflected here too. So it was not just “not in my city” perception.
Not sure when AI boom in Stock market and Bay Area RE will vanish.
Other nearby East Bay counties prices have come down 10%.
Is the disproportionate number of new homes (less expensive) in suburbs being sold versus dormant sales of more expensive infill homes – further fueled by condo pricing plummeting – dramatizing the decline of sunbelt markets where there’s more suburban growth? Also, new construction suburb builders are bringing down prices organically.
All these data are for “cities.” Cities are specific administrative areas with a mayor, a city government of some sort, and well-defined “city limits.” If a home is in a suburb and therefore outside the city limit, it is not part of the data here.