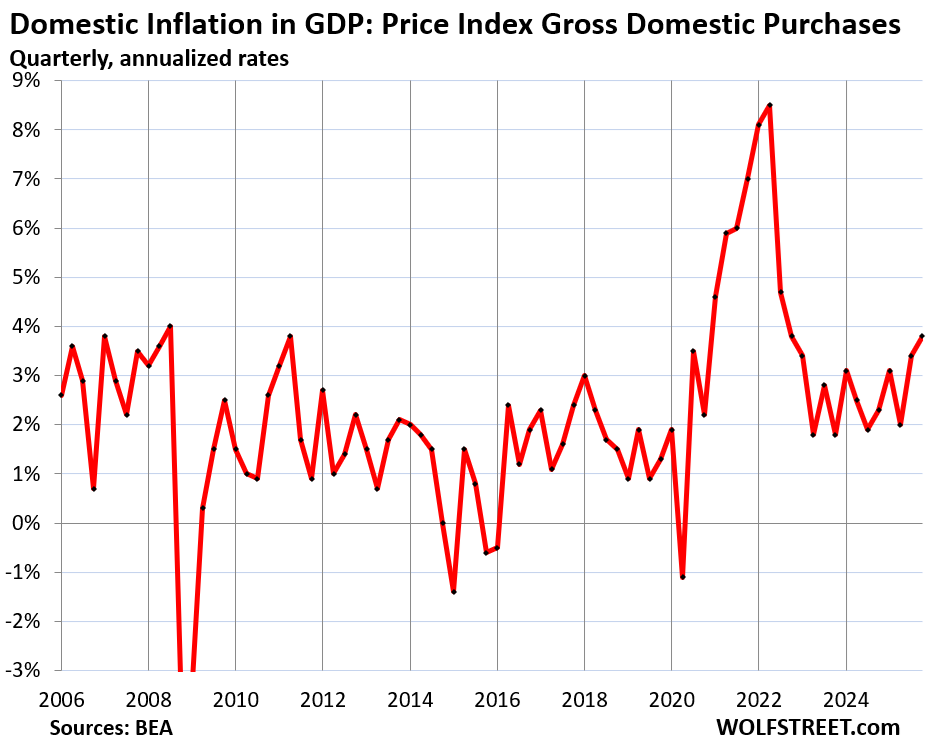
Energy spike is still to come. And today’s GDP inflation measure was revised up to 3.8%, worst since Q4 2022. The Fed needs to pay attention.
By Wolf Richter for WOLF STREET.
The Fed is going to talk a lot about inflation – as are households – given the spike in oil prices that started in March and that has already driven up prices of gasoline, and that is going to drive up overall inflation indices starting for March. But oil-price spikes tend to reverse, and to see longer-term underlying inflation trends, the Fed is also going to talk about “core” inflation measures that exclude the volatile energy components (such as gasoline) and food.
The Fed’s favored inflation measures are the all-items PCE price index, which includes food and energy, and the core PCE price index, which does not include them. The Fed uses them as yardstick for its 2% inflation target. But since May last year, PCE inflation has moved further away from the target, well before the energy price spike that is now coming at it.
The all-items PCE price index rose by 2.8% in January compared to a year ago, and the core PCE price index accelerated to 3.1%, according to the Bureau of Economic Analysis today.
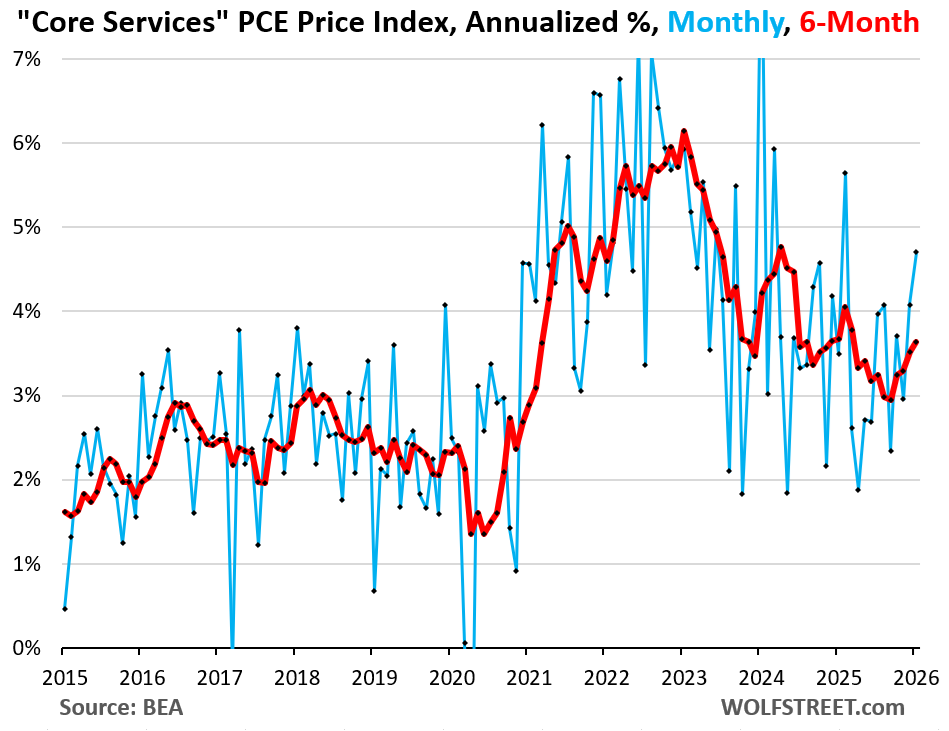
It was driven by the disturbing acceleration of underlying inflation, which is dominated by core services. Core services account for roughly 60% of the overall PCE price index.
The core services PCE price index accelerated sharply both, on a month-to-month basis (+0.38% or +4.7% annualized, blue line in the chart), and a 6-month basis (+3.6% annualized, red line). This acceleration in January came on top of the acceleration in December.
Year-over-year, the core services PCE price index accelerated to 3.4%. And it did so despite the deceleration of its housing components.
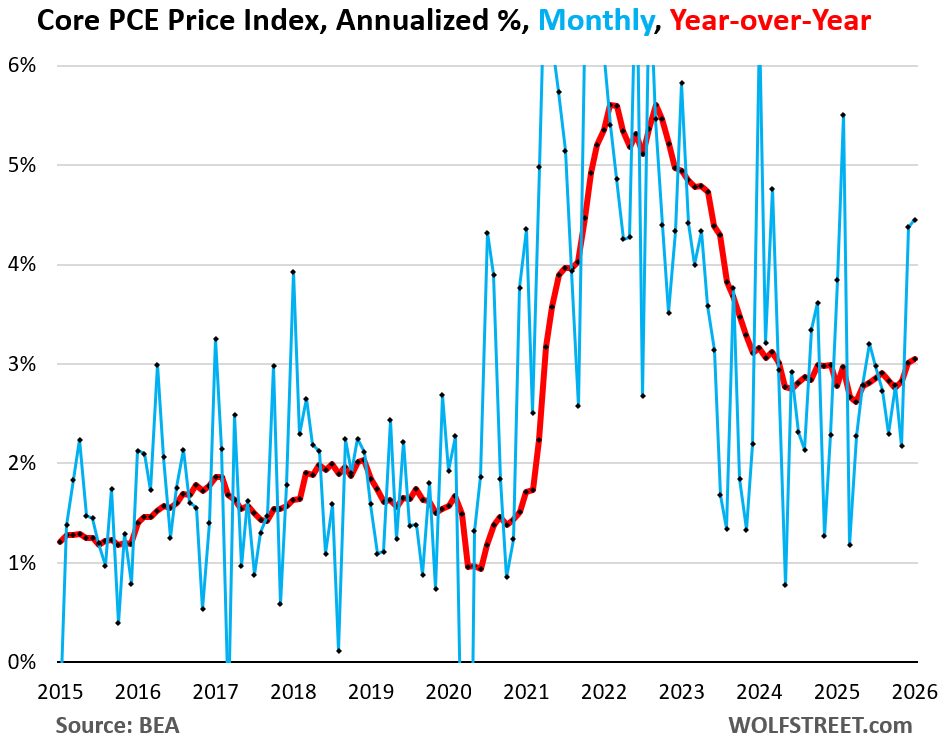
The core PCE price index, driven by core services, jumped by 0.36% (+4.5% annualized, blue line) in January, after the big jump in December.
Year-over-year (red line), it accelerated to 3.1%, the worst in nearly two years. It has been zigzagging higher and ever further away from the Fed’s 2% target since May 2025.
But wait… CPI has been cooling for months.
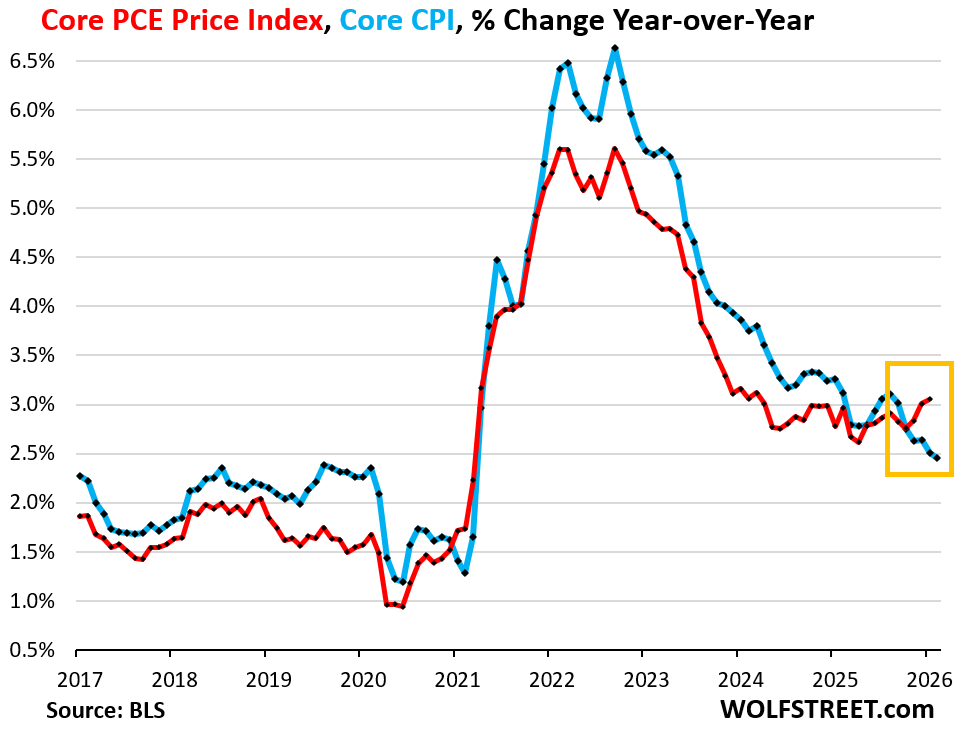
Normally, the core PCE price index shows lower inflation readings than the core Consumer Price Index. But now they have gone in opposite directions: the core PCE price index has been accelerating for months and hit 3.1% in January, worst in nearly two years, while the core CPI has been decelerating for months to 2.5% in January.
That they shoot off in two different directions by that much is a unique twist. And there is a reason for that, and it has to do with a problem in CPI.
The chart shows the year-over-year change of the core PCE price index through January (red, data released today by the BEA) and of core CPI through February (blue, data released earlier this week by the BLS).
This is a very disturbing trend:
So what gives? CPI is getting pushed down by the housing components, especially Owners Equivalent of Rent (OER), that were doctored for the three months September, October, November, and that weigh 35% in the overall CPI (my detailed analysis for data geeks is here).
The PCE price index uses the same housing components, but they weigh only half as much in the index, only about 17%, and they also pushed down on the PCE Price index, but with half as much force as in CPI. The PCE price index also includes other components that the CPI does not include.
The all-items PCE price index was pushed down in January by its energy components that plunged month-to-month by 1.7% (-18.9% annualized). But that was for January. Energy costs, especially gasoline and utility natural gas piped to the home, already jumped in February. And in March, there will be the spike in gasoline prices that is now underway. So the month-to-month plunge of the PCE price index for energy in January was the final leg of the long decline since mid-2022.
But energy is a big component, and its huge plunge in January was enough to push down the overall year-over-year PCE inflation rate by a hair, to 2.8%, despite the surge of core PCE and core services PCE.
The chart below shows all three, on a year-over-year basis: the all-items PCE price index (red), the core PCE price index (blue), and the core services PCE price index (yellow):
The Fed’s target is 2% for PCE inflation. And PCE inflation has been going the wrong way and moving further away from the target since May 2025.
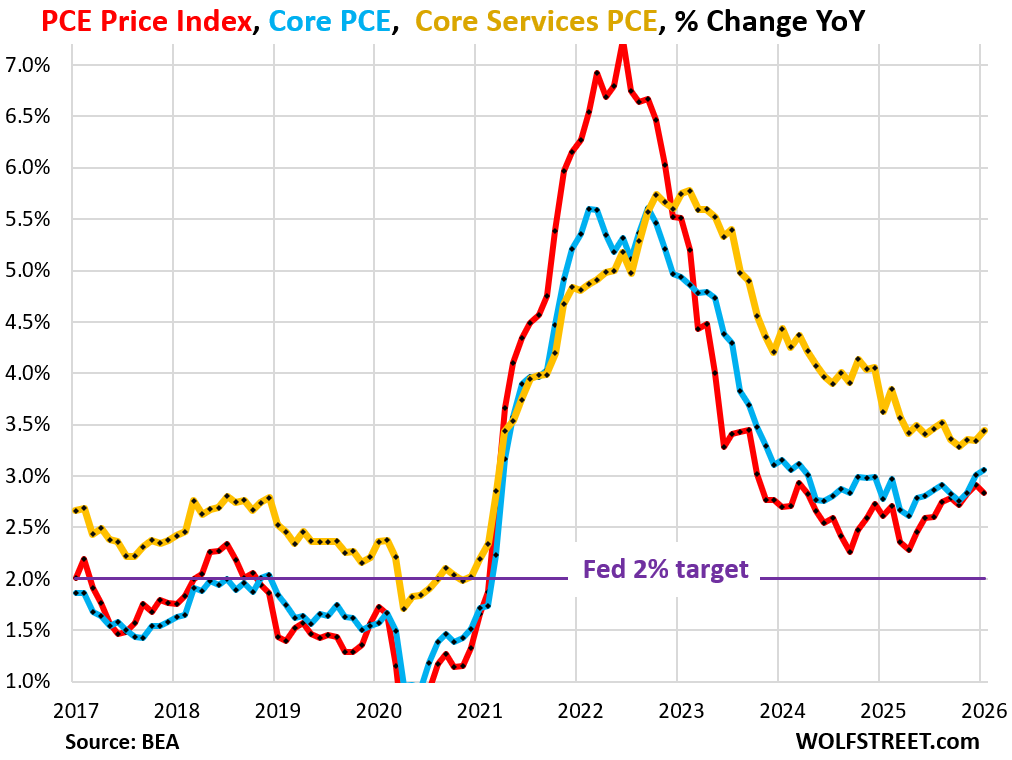
The energy price spike in March will come on top of it.
The Fed needs to pay attention to inflation. As we can see in the core PCE price index at 3.1%, inflation is already percolating through the economy, aside from energy. The gasoline price spike will come on top of all this starting in March.
There is a lot of stimulus in the economy: Government deficit spending, tax cuts for companies and individuals, bigger tax refunds to consumers now during tax-refund season, massive corporate investments in anything related to AI, too-low interest rates, and too narrow spreads. Inflation feeds on these combined conditions.
And domestic GDP inflation surges to 3.8%.
The BEA also released its revised GDP data for Q4, including the Price Index Gross Domestic Purchases, the broadest inflation index for domestic inflation, which excludes import prices. It was revised up to 3.8% for Q4 annualized, the worst since Q4 2022:
In case you missed it:
Energy Inflation for Americans
Enjoy reading WOLF STREET and want to support it? You can donate. I appreciate it immensely. Click on the mug to find out how:

![]()
Call me crazy but charts can be great predictors of the future. It seems traders are aware of the fundamentals and enter times of decision/indecision that are reflected i the charts? Who knows? Your analysis here today who conclude bond traders to sell and drive up yields. Then there is this i came across which is a casual confirmation of the fundamentals you have laid out. IMO own “I see entrails” opinion.
I found this on yahoo which for once I actually agree with(confirmation bias!)
Well I suggest we label this period appropriately as the hillbilly elegy period.
Any journalist that wants to glom onto that alliteration is welcome to it.
So about to pass six continuous years of PCE above target. Is there a point where we just stop believing that’s the target? 7 years? 10 years?
After a certain amount of time passes I think we have a different word in our language for a promise not kept: a lie.
Sorry, five years. I mathed the axis of that graph wrong. I guess we have another year or two to hit the snooze button.
The Federal Reserve has thrown away its credibility.
The Fed’s official legal mandate (12 USC 225a): “…promote effectively the goals of maximum employment, stable prices, and moderate long-term interest rates.”
Since that became law in 1977, we have not had “stable prices”.
Greenspan (unofficially) and Bernanke (officially) set a “2% upper bound”, which in practice meant 0-2% inflation was tolerated.
Since 2012 there’s been a “symmetric 2% target”. You’d think maybe that meant 1-3% inflation, but the past 5 years show it means “whatever people will politically tolerate, is fine with us”.
The Fed was late to combat the 2021 inflation wave. If it had credibility in fighting the current 3% inflation, interest rates would already be higher in anticipation.
2% is unlikely without a recession IMO.
I am ready to admit that I survived the insanity of QE.
The cause of the current housing bubble balloon that requires continuous inflation to sustain the historically high valuation of most asset classes.
So yes. I don’t think your suspicion is untoward.
I have a hypothesis that the primitive inflation is the increase in asset prices which is measured as the increase in rent.
While at the same time, the dreaded deflation is measured by the decrease in asset prices.
Anyone can make a hypothesis. That’s an essential part of the beauty of the system.
As long as we keep electing reps who are deficit spending 2 trillion or whatever huge amount it is per year, it’s unrealistic to expect inflation being at or under the target and inflation over target is not surprising.
Trump’s campaign against Fed chair Jerome Powell dealt crushing blow in court
A federal judge has quashed two subpoenas the Justice Department issued to the Federal Reserve.
You forgot the part about how activist the judicial system has become. One more problem this country is going to have to eventually fix.
……not unless your including the “activism” the current administration Dept. of Justjuice has promoted. If the past U.S. administrations would have been more active our President would be in jail.. as of now he is protected by his elected office, that too will pass.
Thanks for this. Any idea why the Bureau of Economic Analysis uses OER from the BLS CPI report at all. It’s a dumb measure of the cost of homeownership for existing homeowners. Then maybe add some other measure to account for the cost of purchasing a house? Between the health insurance and homeownership indexes, it seems like CPI is vastly underestimating effective consumer prices right now, and it’s a bit distressing that BEA is carrying over that error into the GDP accounts. But I don’t know all the details.
It’s actually the Census Bureau that sends out the housing surveys and obtains the raw data, including for OER and for Rent. Both the BLS and the BEA use that data. The Census Bureau does most of the actual data collection, and the other agencies use it in various ways.
I just updated the article with this:
The BEA also released its revised GDP data for Q4, including the Price Index Gross Domestic Purchases, the broadest inflation index for domestic inflation, which excludes import prices. It was revised up to 3.8% for Q4 annualized, the worst since Q4 2022:
CPI is clouded by subsidies. CPI measures out-of-pocket prices for consumers, rather than net prices paid directly to companies for the actual good or service received. A lot of that $2+ trillion annual budget deficit (if not all of it) goes towards subsidies, either directly or indirectly.
GDP UGLY: GROWTH REVISED DOWN TO JUST 0.7%…
CORE INFLATION 3.1%…
MASSIVE REVISIONS…
Federal government spending collapsed in Q4 during the shutdown, and today’s revisions made that collapse even worse. But that spending is going to happen since it was appropriate funds, and they’re spend it in Q1 and Q2, so watch out for huge swing.
Consumer spending growth in Q4 was decent +2.0%, despite the shutdown.
Real Final Sales to Private Domestic Purchasers (GDP without government spending, without exports & imports), so GDP of the domestic private economy was revised down to +1.9%, pretty decent and will in the normal range.
Today the 30 year bond was 4,87/4.88 which is up from 4.77 a week or so ago. Perhaps this will drive gold down a bit, and keep the FED from lowering their rate. I’m my opinion, rates should be a lot higher in the long end of the market.
Credit spreads should be a lot wider. There is too much liquidity in the system, thanks to the Fed during Covid.
Well I have heard some talk that the Fed next week may reduce the interest rate by 50 bps ahead of the economic tsunami coming our way,
Long term Interest rates are at least 100 bps to low. imo
“I have heard some talk that the Fed next week may reduce the interest rate by 50 bps”
🤣
How bout that S&P?!
today basically fell to 5% from the peak.
Woo
Seems like a solid time to nationalize our oil assets as most of the world does. That will fix everything.
The beatings will continue until morale improves. Or rather, the numbers will be doctored until inflation is controlled.
Can’t wait to see what happens when we get a brown nosing yes man in the Fed and if voting members are removed and also replaced. Combine that with the Iran situation we could very well be headed to an economic calamity.
The cult are all chanting the same line. “War is good. It makes the economy go gangbusters.” Yeah, except this ain’t post WWII where Europe is smoldering ruins and rebuilding and the US in pristine shape with the factories ready to cut loose fixing everything.
Blueanon
What would it take for the OER number to be more fact-based and relying on sold data , as you’ve shown other countries do already Wolf, instead of opinion based?
Would this be a tall order to change? Does it take an act of Congress?
That should have said “solid data”; not “sold data” but maybe data purchased from third parties is the answer.
These people have resources a solo guy behind a screen can only dream of. What they need is data on homeowners’ insurance premiums, deductibles, etc.; data on property tax rates; data on repair costs; data on HOA fees; data on mortgage rates; data on home prices (replacement values).
They can get (even buy) some of these data from industry organizations and large companies.
And they can supplement this data with data from their surveys they already send to the addresses now. Instead of asking, How much would your home rent for today?” They could ask: What is your HOA fee today? What is your homeowners’ insurance premium? What is your property tax rate? etc.
Same housing survey as they’re sending out now, just different questions, supplemented with corporate data.
Currently they’re sending a housing survey to each address in their survey panel (tens of thousands of addresses) on a rotating schedule, to where each address gets one survey every six months, and they rotate. Whoever lives there answers the survey. This way they have established a long record of same-address responses to housing questions. There are a lot of questions on these surveys, and OER is based only on one question that only homeowners in that group answer. Renters answer rent-related questions.
That would give them a current data base and data going forward. That would not be that hard to do. They could run this data for two years before releasing it, so they have a base for year-over-year changes.
To establish data going back many years is much harder to do. They might only go back a couple of years to reconstruct the data, and then fuse those two indices together for the historic period.
They have done that with the new and used vehicle data when they switched from dealer surveys to buying this data from JD Power (which gets all this data electronically from dealers for its various pricing guides, etc., that it provides dealers.
BLS didn’t release this data for a few years but built a track record that ran in parallel with the existing survey data. Then they fused the old index as index value and the new index value together in the historic data, so that the line today looks smooth for the back-years. I’m really impressed with how they did this. The results are good. The JD Power-based new and used vehicle CPIs nailed the price increase through 2022 and the drops since then. BLS released this new version in parallel with the old version for a while before switching over. The new version started in April 2022. I wrote about at the time because this is in my wheelhouse:
https://wolfstreet.com/2022/01/18/the-new-version-of-cpi-new-vehicles-will-blow-your-doors-off-spikes-even-more-whoosh/
At the time the FED started cutting, it was way too early.
Then they continued cutting, despite the fact that inflation started to rise yet again.
Inflation had not been stamped out. It was way over target.
This was FED malpractice.
You don’t screw around with inflation, yet they did.
FAFO
Thank you Wolf for your work! Does the fed funds rate have the same impact it did 10-15 years ago? In the housing market there is a disconnect as any drop in Fed funds rate seems to do the opposite to the mortgage rates. Unless the Fed starts buying MBS again or indirectly funding a federally subsidized low mortgage rate via Freddy and Fanny, I don’t see any meaningful drop in mortgage rates. Would you tie up $400,000.00 of your money for 30 years @ 6%. I would not.