The Bad Joke of Owners Equivalent of Rent (OER) explained.
By Wolf Richter for WOLF STREET.
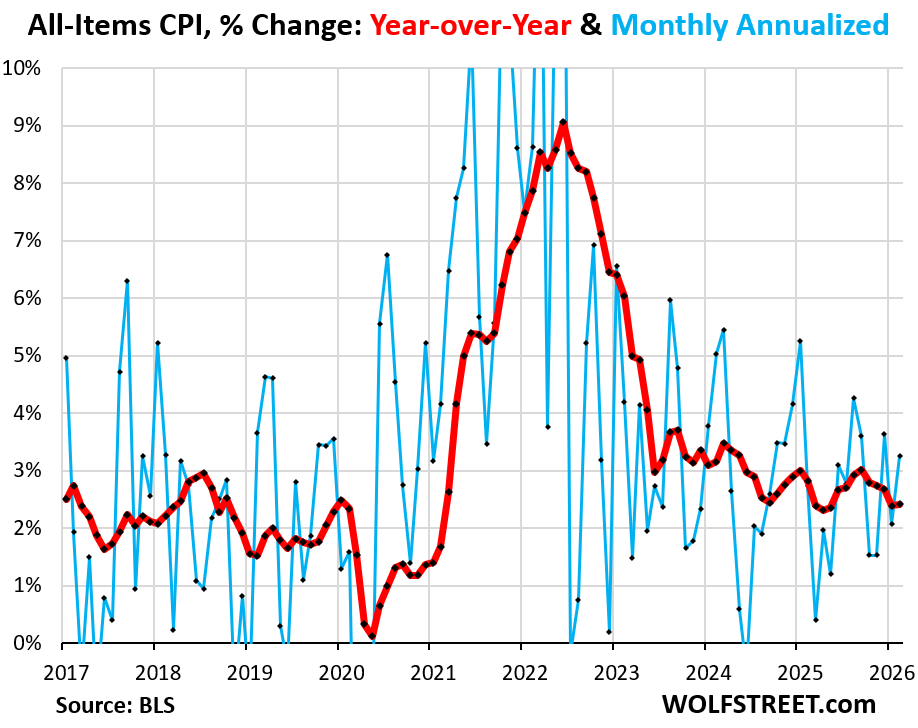
The Consumer Price index for February, released today — which does not yet include the gasoline price spike in March — rose by 0.27% (+3.3% annualized) in February from January (blue line in the chart).
The year-over-year increase – which is still, and will continue to be, pushed down by the doctored figures for Owners’ Equivalent of Rent (OER) for September, October, and November (more in a moment) – rose by 2.4%, same increase as in the prior month (red line). OER accounts for 26.1% of total CPI, it moves the needle, and it’s a scandal, a politically-convenient and Wall-Street-convenient scandal, so everyone over there is going along with it.
The energy CPI jumped by 0.63% in February from January (+7.9% annualized). Gasoline prices jumped in February from January, even on a seasonally adjusted basis. The price of utility natural gas piped to the home spiked, as did prices of other fuels used at home, largely propane, heating oil, and firewood, amid a harsh winter in parts of the country. Electricity prices backed off for the second month from the spike that had topped in December.
Year-over-year, the energy CPI was up just a hair thanks to the 5.6% YoY drop in gasoline prices that is now in the process of flipping.
Food prices jumped by 0.44% in February from January (+5.4% annualized). Year-over-year, food inflation accelerated to 2.6%. Food prices are up by 31% from January 2020.
But prices of durable goods, many of which are imported, fell for the third month in a row and were nearly flat for two months before then. So year-over-year, the CPI for durable goods is now essentially unchanged, despite the tariffs. Durable goods are dominated by new and used vehicles.
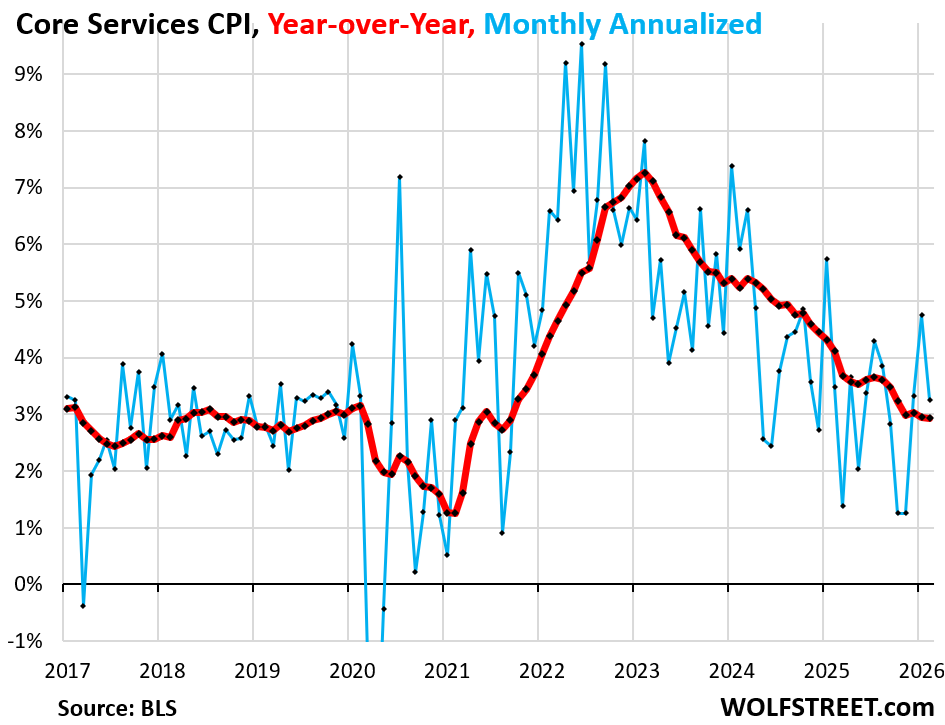
Core services CPI rose by 0.27% (+3.3% annualized) in February from January, a deceleration from what had been the worst reading in a year. It accounts for roughly 60% of the CPI basket of goods and services.
It includes housing costs (OER and Rent), medical care services, health insurance, auto insurance, tenant’s insurance, subscriptions; telephone, internet, and wireless services; lodging, rental cars, airline fares, education, movies, sports events, club memberships, water, sewer, trash collection, motor vehicle maintenance and repair, etc. It does not include energy services, such as electricity.
Year-over-year, the services CPI rose by 2.9%, as it continues to be pushed down by the CPI for Owners’ Equivalent of Rent (OER), which had been doctored for the September-November period. OER is the biggest component of the CPI basket, weighing 26.1% in overall CPI, and over 40% in core services CPI, and it moves the needle.
The Bad-Joke OER explained.
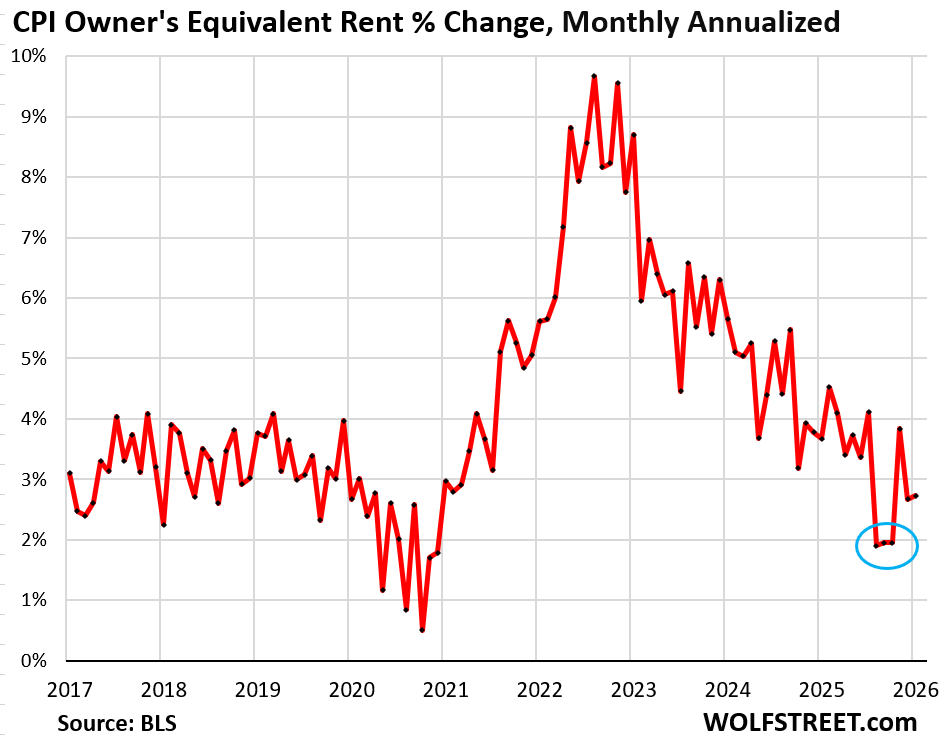
The Owners’ Equivalent of Rent CPI rose by 0.22% (+2.7% annualized) in February from January.
The issue here is the year-over-year increase that is still getting pushed down by the three doctored months September-November. Year-over-year, the index rose by 3.2%.
OER is based on what a large group of homeowners estimates their home would rent for. It’s supposed to reflect the cost of homeownership as a service.
Homeowners experience a lot more inflation, but it is not reflected in CPI. The expenses of homeownership – homeowners’ insurance, HOA fees, property taxes, and repairs & maintenance – are not included in CPI, and OER takes their place. Those expenses have soared for many homeowners, and inflation is rampant in them, but not reflected in OER.
Many countries, including Canada, track homeowner inflation by the actual costs they pay for homeowners’ insurance, HOA fees, maintenance and repairs, and property taxes. Canada includes an index for mortgage rates and an index for home replacement values. Why can’t the US switch to a system like this? That’s a conceptual shortcoming with OER, it’s a lazy way of bypassing a more complex job – and always has been.
The immediate issue with OER is September, October, and November. In September, the month-to-month increase of OER did a suspicious outlier-plunge, and with no data for October due to the government shutdown and apparently no data for November either, the September outlier was carried forward through November. Since then, the month-to-month increases seem normal, given what OER represents.
But the year-over-year increase is still getting pushed down by those artificially low readings in these three months (circled in blue).
What is getting pushed down by those three months is the index value. It was 430.5 in August. In the four months through August, the index value increased by 1.18 to 1.44 points each month. Then in September there was this outlier when the index value increased by only 0.68 points, roughly half the prior rate. October was officially left blank, but the index value for November is there (432.5), and so we know that in effect, they carried the outlier monthly increase in points (0.68) from September forward to October and November, and combined the two increases averaged out to be 0.70 per month, the excuse being the government shutdown and lack of actual data.
The table shows the OER index value, seasonally adjusted; the changes month-to-month in points and percentages; and the changes year-over-year (not seasonally adjusted) in percentages. Note how the year-over-year increases plunged from +4.0% in August to +3.4% in November.
The index values of these three months that barely increased carry forward in the index value for all times to come. But next fall, they will fall out of the 12-month window of the year-over-year percentage comparison, which is when the year-over-year impact of those three months will vanish.
| OER index value | MoM change in pts | MoM % | YoY % | |
| Jan/2025 | 421.1 | 1.30 | 0.31% | 4.6% |
| Feb/2025 | 422.4 | 1.27 | 0.30% | 4.4% |
| Mar/2025 | 423.9 | 1.56 | 0.37% | 4.4% |
| Apr/2025 | 425.3 | 1.42 | 0.33% | 4.3% |
| May/2025 | 426.5 | 1.19 | 0.28% | 4.2% |
| Jun/2025 | 427.8 | 1.30 | 0.31% | 4.2% |
| Jul/2025 | 429.0 | 1.18 | 0.28% | 4.1% |
| Aug/2025 | 430.5 | 1.44 | 0.34% | 4.0% |
| Sep/2025 | 431.1 | 0.68 | 0.16% | 3.8% |
| Oct/2025 | 431.8 | 0.70 | 0.16% | 3.6% |
| Nov/2025 | 432.5 | 0.70 | 0.16% | 3.4% |
| Dec/2025 | 433.9 | 1.36 | 0.31% | 3.4% |
| Jan/2026 | 434.8 | 0.95 | 0.22% | 3.3% |
| Feb/2026 | 435.8 | 0.98 | 0.22% | 3.2% |
IF OER index values had increased in September through November at the average rate of the months June, July, and August, year-over-year OER today would be +3.6%, not +3.2%.
The CPI for Rent of Primary Residence is dogged by a similar issue, but to a lesser extent. It weighs 7.8% in overall CPI. Together, the two indices weigh over one-third of total CPI!
The core services CPI rose by 0.22% (+2.7% annualized) in February from January. Year-over-year, the OER issue continued to push down core services CPI to an increase of 2.9%.
“Core” CPI, which excludes food and energy components to track underlying inflation, rose 0.22% (+2.60% annualized) in February (blue in the chart below).
Year-over-year, “core” CPI rose +2.5%, also pushed down by the months of the doctored OER (red):

Later today and over the next few days, I will post separate detailed analyses on food inflation, which intensified; and energy inflation, which also intensified even before the current price spike in March; and on inflation for owners and buyers of cars and trucks. So stay tuned.
Enjoy reading WOLF STREET and want to support it? You can donate. I appreciate it immensely. Click on the mug to find out how:

![]()
MW: Stock-market indexes fall as traders weigh inflation risks and latest Middle East developments
SPX -0.21% DJIA -0.73%
MW: The real inflation rate? Try 3.3% — and that’s before the jump in gas prices.
Yes. The Fed’s preferred and usually lower PCE Price Index was already at 3% for December (latest available). The CPI is really screwed up right now.
The domestic GDP inflation rate was 3.7% annualized in Q4.
https://wolfstreet.com/2026/02/20/hot-inflation-plunge-in-federal-government-spending-slam-real-gdp-but-trade-deficit-least-bad-in-2-years/
BIG BEAUTIFUL GAS PRICES: Soaring costs to cast long shadow across economy…
Imma get on my soapbox here…
4.4% unemployment ain’t natural. That’s low. What’s your favorite extended period of sub-4.5% unemployment? Post WW2? We aren’t operating on reasonable expectations anymore.
Sorry folks, ain’t everybody employable. Some job seekers in society, let’s just call it 1 in 20, do not have the maturity or responsibility to be practically employable after we consider the normal hard working people just between jobs. When companies bloat their staff with poor-fit workers, it’s harmful to the company. That’s why when layoffs happen, stock prices go up.
So what does that have to do with this…? Because the narrative that the Fed rate has to balance unemployment with inflation is a red herring. At 4.4%, we can let unemployment rise out here as it trends 5% and we don’t need to panic about that.
We can panic about inflation 👍
It seems neither party can get a handle on inflation because neither wants what is necessary: job losses and a recession.
We did have some of these bumps in late 2024 as well where inflation bounced back up, but I have no clue how we ever get to 2% without a meaningful pullback.
Just keep rates the same
I want to add, what are wages doing versus PCE?
Wages still increased faster than PCE inflation through December, but the margin is shrinking. Average hourly earnings of nonfarm payroll jobs rose by 3.8% yoy in February. We only have Dec PCE which was up 2.9% (core 3.0%). But PCE inflation has been accelerating while YoY wage gains have about stabilized in the 3.6%-3.8% range.
Accurate
If you take AI spending out of cyclical GDP and adjust for what’s more likely the real inflation rate, I think GDP is headed negative! That’s not to mention, how much of this AI spending is real vs. accounted for more than once!
nope.
1. AI spending is counted as capital expenditures when the funds are actually disbursed, not when the announcements are made. So far, the announcements have been huge, but actually spending was smaller. It’s the actual spending that counts in GDP.
2. It’s conceptual BS to take something as economically important as AI spending out of GDP and say that without it, the economy would be weaker. I mean sure, without consumers, the economy would be weaker too 🤣
3. CPI is NOT used to adjusted GDP for inflation. People need to get this into their heads.
Domestic GDP inflation in Q4 was 3.7% annualized (Price Index for Gross Domestic Purchases).
https://wolfstreet.com/2026/02/20/hot-inflation-plunge-in-federal-government-spending-slam-real-gdp-but-trade-deficit-least-bad-in-2-years/
https://wolfstreet.com/2026/02/21/pce-inflation-2-9-3-0-and-gdp-inflation-3-7-got-hotter-but-cpi-inflation-2-4-cooled-why-the-fed-needs-to-pay-serious-attention/
Each category of products and services has its own price changes, which are established by the Bureau of Economic Analysis and cover goods and services that consumers, businesses, and government buy. From this emerges the domestic inflation rate for the overall economy (not just consumers), which was 3.7% in Q4 annualized, excluding imports. So this was the overall DOMESTIC inflation rate.
“Real” GDP growth (adjusted for inflation) was what it was after this inflation rate.
Wolf, are you the only one who is bringing up this of outlier plunge in OER for the 3 months of government shutdown? The rebound for 3 months now should cause others to scream from the rooftops !
Great explanation for it falling out of the year over year increase next Fall. However because it’s an index the LEVEL of OER will be understated forever ! An index is not the same as measuring continuous dollar prices which would immediately correct this understatement.
“When you can’t hit the target, MOVE IT!”
The Fed will tolerate a new level of inflation: 3 Percent
And watch for another Too Big To Fail event in private equity.
If the FED were ever serious about the 2% number, then they would have never lowered rates anytime in the last 4 years.
Or did ZIRP or any of the other dumb shit they have done.
The FED panders to the ABA.
The FED should be draining reserves to lower prices while driving the banks out of the savings business (which increases the supply of loanable funds thereby lowering interest rates).
The FED operates the economy in reverse. Lending by the banks is inflationary. Lending by the nonbanks is noninflationary.
This data manipulation helps the narrative for lowering interest rates, but I’m not sure consumers believe it. I sure don’t. Every year my car insurance, HOA dues, and homeowners insurance keep increasing and not by just 2-3%. It’s gotten to the point I dread renewal time.
Thankfully the Fed favors the PCE price index, and the core PCE price index, and core was already at 3.0% in December (last reading). We get January in two days. And February’s at the end of March.
Hard to believe I would ever say “thankfully” about the PCE price index, but that’s what it has come down to 😬
The YoY core PCE price index and YoY core CPI have diverged and gone into opposite directions for the past few months of OER issues because the PCE price index puts much less weight on housing which reduces the issues of OER in the index.
A lower official inflation rate could also be very useful to the Social Security system. Lower inflation, lower increases in payments.
A 0.1% difference could mean many billions per year of difference.
“Those expenses have soared for many homeowners, and inflation is rampant in them.”
I have a “special” housing situation in a special market. I definitely have increased costs, both today and on tomorrow’s horizon.
One is our insurance. Due to some bad timing on quotes and renewals, we were forced into a different, more expensive option.
Another is the age of our building. It’s a 45 y/o condo complex with 5 units. I’m pretty sure all the exterior is original. Depending how far we go, I am ballparking $200k to redo roof, siding and windows (including skylights).
The interesting part about MY personal scenario is that I have a “deed restricted unit.” This means they create a small slot for me to fit in, and the ceiling is based on my *purchase price*.
Of course, that doesn’t rise, but the general cost of living DOES. As does my need for savings (college fund, et al), AND the ongoing investment in the home to keep it tenable.
I’m anticipating some sort of interaction with the housing authority to address this: how can I be expected to pay $40k in maintenance costs and keep my income and net worth at an uncomfortably low level?
“In September, the month-to-month increase of OER did a suspicious outlier-plunge, and with no data for October due to the government shutdown and apparently no data for November either, the September outlier was carried forward through November. Since then, the month-to-month increases seem normal, given what OER represents.”
If the BLS was going to make a wild guess for October and November OER, why wouldn’t they do something reasonable or defensible like averaging the previous six months data? Carrying over the “suspicious outlier” of September across three months seems hard to explain without a motive from the BLS acting director who was installed, suspiciously, in August, right before the September outlier number.
Definitely an “*if you trust the numbers” disclaimer moment.
My thoughts exactly and yet I am not aware of any significant criticism in the (oligarphy-controlled) mainstream business media. I guess honest factual data doesn’t serve a lot of people’s interests.
How can we expose the year over year owners equivalent of rent scandal? That is really not ok. How can we trust a government doctoring numbers?
I was at a Stop and Shop yesterday and my jaw dropped when I saw a box of Kellogs Corn Flakes’ priced at $6.29. WTF???!!!
That is pretty scary. Think about it. $100 doesn’t even buy you 16 boxes of Corn Flakes. This is absolutely criminal. Why is the government not doing anything???!!!
It’s $3.98 at my Walmart (I just looked it up on the app). If you’re just walking into a grocery store and paying whatever price they’re asking without doing your diligence, that’s on you.
Is that price for Kellog’s or a generic brand?
Kellogg’s. $3.98 for the 9.6 ounce box, $4.98 for the 18 ounce box, and $6.28 for the 25.2 ounce box.
The “Great Value,” which is Walmart’s store brand, is $1.93 for 13.5 ounces.
You have to shop around. That’s part of the reason inflation got out of control in the past 5 or 6 years. People just paid whatever stupid prices people asked, and people paid them with nary a peep. The retailers, of goods and services, realized they had more pricing power than they thought they did. And here we are.
I just checked Wal Mart, Kellogg’s is $6.28 for the mega size, which is 25.2 ounces. That’s what I saw at the Stop and Shop. That is still a lot of money for friggin’ corn flakes!
I looked at the Stop & Shop in NJ where I used to live, and it’s $2.69 for the store brand for 18 ounces. No one forces you to pay extra to pay for Kellogg’s marketing budget.
Wolf, silly question, but won’t this stupid game they’re playing hurt them next year? Those suspicious three months are causing the base to be lower, so won’t the YoY inflation in the late summer and fall of 2026 look worse than it is?
Run it hot and lie is the fed mantra. I suspect real inflation is above the FFR, which is where they want it. Only way to outrun the debt.