Despite the wailing about tapped-out, struggling and cracking consumers, the credit card delinquency rate dropped to multi-year low.
By Wolf Richter for WOLF STREET.
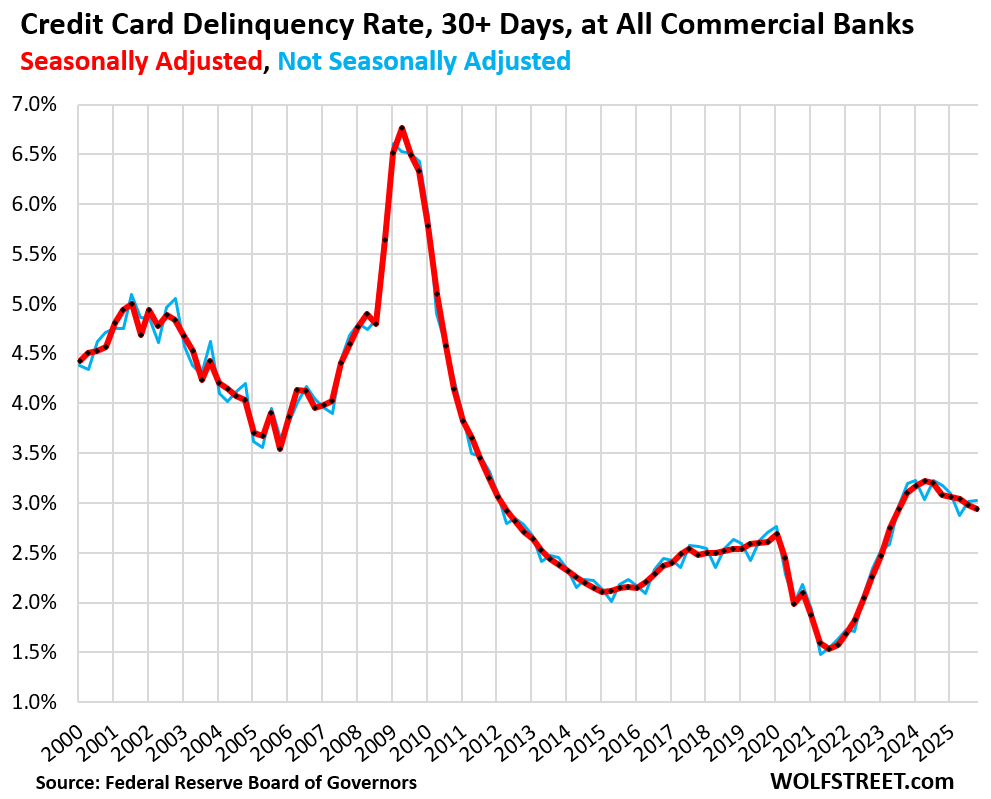
The 30-day-plus delinquency rate on credit cards issued by all commercial banks declined to 2.94% at the end of Q4, seasonally adjusted (SA, red in the chart), the lowest since, and the same as, Q3 2023, and down from 3.08% a year ago, and from 3.10% two years ago, according to the Federal Reserve Tuesday afternoon, based on regulatory reports filed by all commercial banks. This includes credit cards by subprime-rated cardholders.
Not seasonally adjusted (NSA, blue in the chart), the 30-day delinquency rate, at 3.03%, was the lowest for any Q4 since Q4 2022.
During the Free-Money era, credit card delinquency rates had dropped to very low levels. But after the Free-Money fizzled, delinquency rates rose out of the trough, overshot a little, and then in 2024 started heading lower again. Throughout, delinquency rates remained relatively low compared to the 25-year context of the data.
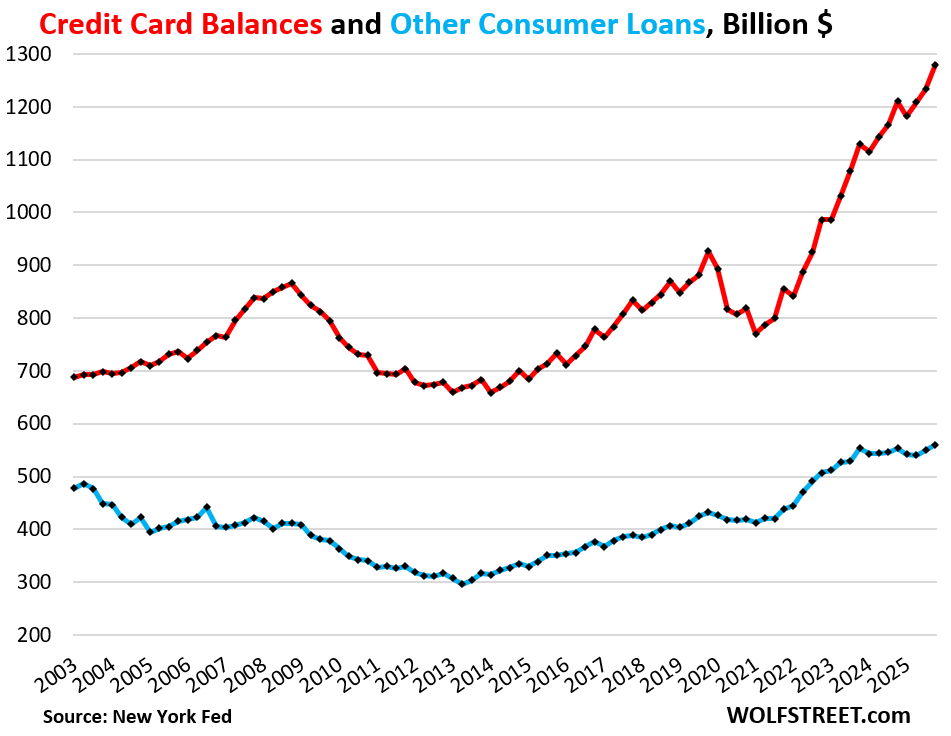
Credit card balances: a measure of spending, not of borrowing.
Credit card balances are statement balances before payments are made. They’re a measure of spending, not a measure of borrowing. Most of these charges get paid off every month by due date and never accrue interest.
Credit cards have become the dominant consumer payments method in the US, largely replacing checks and cash. Debit cards are the second most popular payment method. That’s why watchers of the economy keep an eye on credit card balances: They indicate growth of consumer spending.
Credit card balances (red line in the chart below) rose by $69 billion year-over-year at the end of Q4, or by 5.7%, to $1.28 trillion, on growth in consumer spending and price increases (data from the New York Fed’s Household Debt and Credit report based on Equifax data).
This data is not seasonally adjusted. Typically, spending spikes during the holiday period and then drops in Q1. The data confirms that spending growth was solid.
“Other” consumer loans (blue line) – such as personal loans, Buy-Now-Pay-Later (BNPL) loans, and payday loans – inched up 1.1% year-over-year, far less than the rate of inflation, to $560 billion. Many of these balances, except current BNPL balances, accrue interest.
These other consumer loans have barely risen over the past 22 years, despite the growth of the population, income, inflation, and spending.
The declining and relatively low delinquency rates and the rising statement balances are not hard to explain.
Consumers are earning record amounts of income, and there is a record number of consumers, and they’re buying record amounts of goods and services via electronic means, dominated by credit cards.
Consumers’ aggregate balance sheet is in good shape: 65% own their own homes, and about 40% of these homeowners don’t have a mortgage, and others have whittled down their mortgages. Over 60% of households have at least some stocks. Many hold precious metals and cryptos. Many are sitting on a record pile of interest-earning cash.
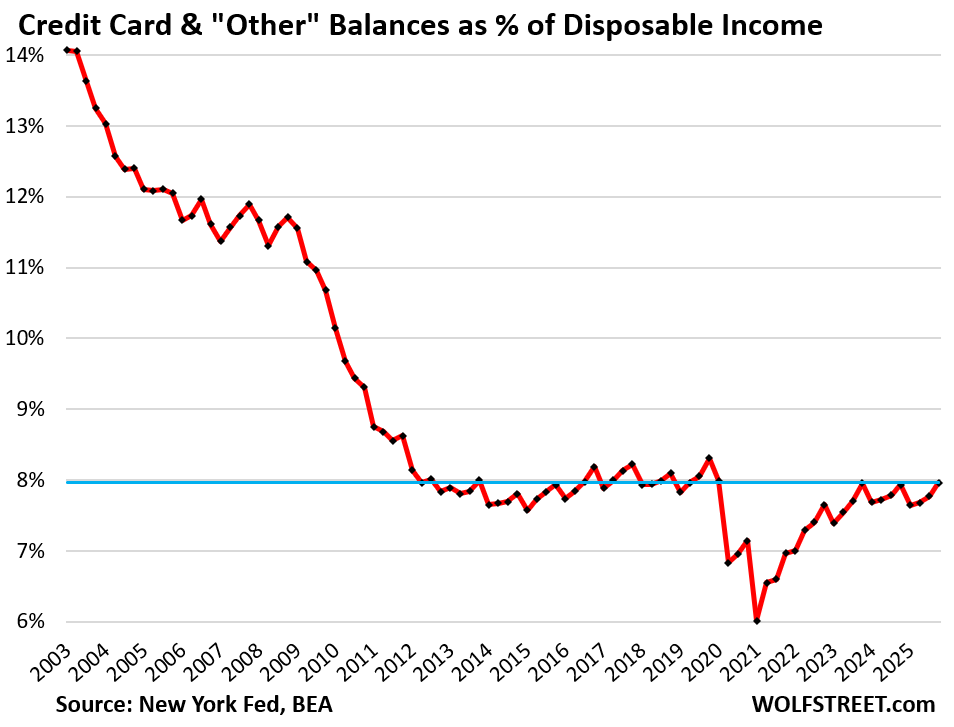
The burden of credit card balances.
Credit card balances (red in the chart above) and “other” consumer debt (blue above) combined, rose year-over-year by $75 billion, or by 4.2%, to $1.84 trillion.
The debt-to-income ratio is one of the classic ways of evaluating the burden of a debt. With households, we can use the debt-to-disposable-income ratio.
Disposable income, released by the Bureau of Economic Analysis, is essentially the monthly after-tax income consumers have available to spend on a monthly basis for their daily costs of living, and to service their debts, and then to save and invest the rest. It’s income from after-tax wages, plus income from interest, dividends, rentals, farm income, small business income, transfer payments from the government, etc.
It excludes income from capital gains, which is where the super-wealthy make most of their money. So this upper echelon of income is excluded here.
The ratio of credit card and other consumer loan balances to disposable income in Q4, at 8.0%, was where it had been in Q4 2024 and in Q4 2023 and below the Q4s in the years before the pandemic. And it has come way down from the years before the Financial Crisis.
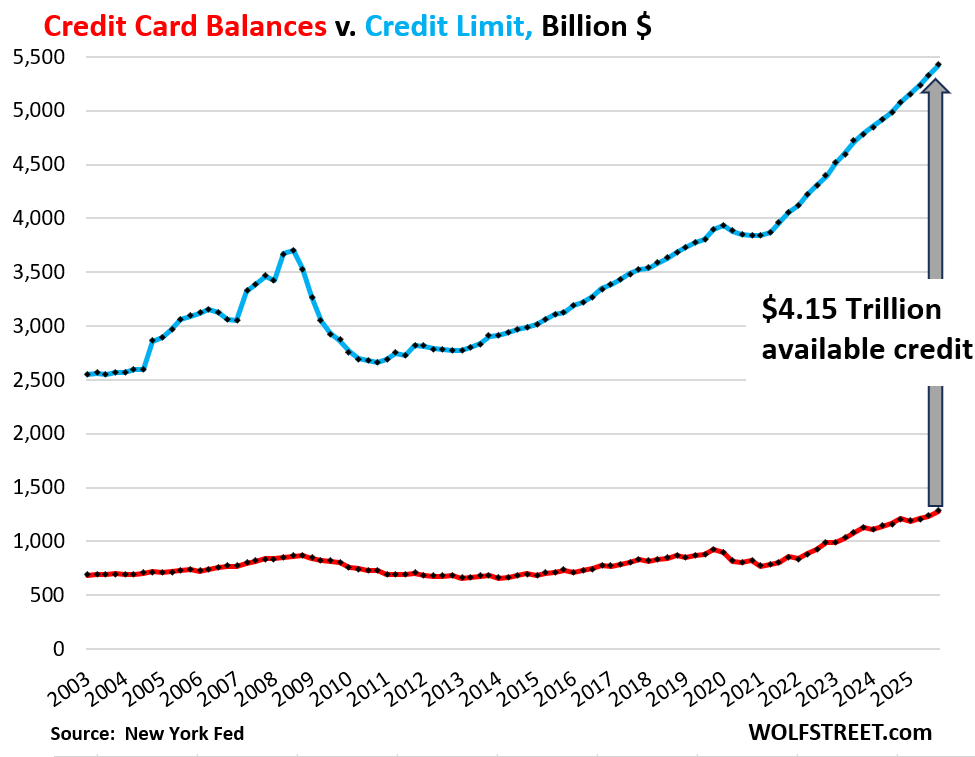
Available Credit rises to record.
Credit cards are very profitable for banks because of the swipe fees they earn on every purchase. So banks are trying aggressively to get people to set up new credit card accounts, and they incentivize people to use those cards by kicking back 1% or 2% or more in form of cash back, loyalty points, miles, etc., on the logic, “The more you spend, the more you make,” meaning, “The more you spend, the more we make.”
So the aggregate credit limit (blue in the chart below) rose to a record $5.4 trillion, outgrowing balances (red).
And the available unused credit has soared to a record $4.15 trillion (gray arrow).
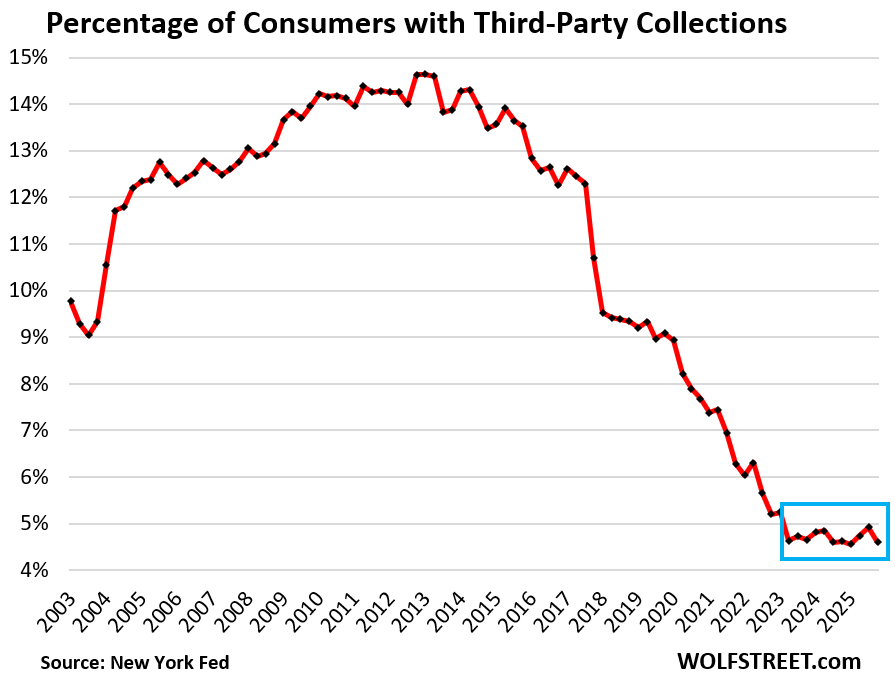
Third-party collections hit record low.
This is where defaulted credit card accounts end up if the cardholders fail to catch up with their payments or make some kind of deal with their bank.
In terms of credit reporting, a third-party collection entry is made into a consumer’s credit history when the lender reports to the credit bureaus, such as Equifax, that it sold the delinquent credit card debt to a collection agency for cents on the dollar.
The percentage of consumers with third-party collection entries on their credit reports again hit the rock-bottom of 4.6% in Q4.
This rounds off my four-part quarterly analysis of consumer debt and credit. And in case you missed them:
Serious Delinquency Rates for Subprime & Prime Auto Loans, Balances, and Debt-to-Income Ratio in Q4 2025
Enjoy reading WOLF STREET and want to support it? You can donate. I appreciate it immensely. Click on the mug to find out how:

![]()
Who do you believe? Wolf Street or the MSM? Wolf digs deeper.
I interpolation (grin)
The post says: “Credit card balances are statement balances before payments are made. They’re a measure of spending, not a measure of borrowing. Most of these charges get paid off every month by due date and never accrue interest.”
Is it possible to translate “Most” into a % and, if so, is there a trend?
No one tracks interest-accruing credit card debts on a quarterly basis. This data would have to be obtained from each of the 4,000 banks. There are estimates floating around out there. And every five years, the Fed does a study on this, etc. The figure that has been floating around out there is now at about $650 billion in interest-accruing credit card debt, with everyone having a different estimate.
So let’s pencil this out on a napkin.
Credit card transactions are close to $6 trillion a year (last figure I have was for 2023, of $5.8 trillion). This means theoretically that if no one pays off their credit cards, credit card balances would grow by $6 trillion a year, every year, and would be in the high gazillions by now.
So if interest-accruing balances ($650 billion now) grow by $30 billion a year of the $6 trillion a year in credit card transactions, then cardholders pay off $5.97 trillion a year spread over 12 statement balances. And the remaining $30 billion spread over 12 statement balances gets stuck as interest accruing debt and gets added to the $650 billion in interest accruing debt balance.
The reason interest-accruing credit card debt is so low is because interest rates are so high. People buy new living furniture and borrow on their credit card, but then pay off the balance asap, motivated by the high interest rate. Young people have a learning curve in that department, but they figure it out very quickly. So that balance might jump to $10,000 after big purchases, and then five months later, it’s paid off. I did that in my younger years, everyone is doing that in their younger years when they need some long-lasting stuff, have good income, and don’t want to or can’t disrupt their investments.
What about another round-about way to estimate, like looking at FDIC quarterly summary of total banking industry “Interest from Credit Cards”, and applying an average interest rate of maybe 21% and maybe another estimate of X% of rolling average balances?
Thank you, there is never any real analysis of how many of us ‘credit card deadbeats’ are out there. It is good to hear that it is rather normal utilizing the practice of using cards for the added financial protections and credit utilization, but paying them off before the banks can get an interest charge.
Thank you, this was very helpful. As I now see it:
(i) if you look at the total credit card charges for any year you see that a very high percentage (maybe 90%) are paid off before interest charges accrue, but
(ii) if you look at the total of all statement balances for any month you see that a large portion (somewhere near half) will not be fully paid off before interest charges are incurred.
But you’re comparing a flow (monthly spending = part of statement balances) to a stock (interest accruing balances). Statement balances reflect the monthly flow of spending plus the existing stock of interest accruing balances. That existing stock doesn’t change much as a whole. You need to compare the flow of spending (maybe $500 billion a month) to the INCREASE of the existing stock of interest accruing balances (maybe $3 billion a month).
How do you understand the long decline of the Labor Force Participation Rate since the early 2000s. Does this actually reflect a growing number of people out of work or are they just in the informal economy ? or are the just living off dividends and other capital gains? https://fred.stlouisfed.org/series/CIVPART
It reflect the largest generation ever (boomers) retiring, starting about 15 years ago. Why don’t you read my articles here?
Look at the prime-age participation rate, which excludes the issue of boomers retiring:
https://wolfstreet.com/2026/02/11/private-sector-ramps-up-hiring-job-losses-mount-at-federal-state-governments/
From my article:
“The prime-age labor force participation rate (25-to-54-year-olds) rose to a multi-decade high of 84.1%.
“The prime-age labor force participation rate eliminates the issue of the retiring boomers. The overall labor force participation rate shows the percentage of the population that either has a job or is looking for a job. When people retire and stop looking for a job, they exit the labor force but remain in the population until they die. The surge of boomer retirements, which started about 15 years ago, has pushed down the overall labor force participation rate, as these retired boomers are still in the population but no longer in the labor force.
“The prime-age labor force participation rate is a cleaner depiction of participation in the labor market, than the overall participation rate, and speaks of a lot of strength in the labor market that has been changing dramatically since early 2025 due to the crackdown on illegal immigration, which has slowed the growth of supply of labor.”
I absolutely love the chart Wolf provides here on prime age labor force participation. It completely DISPELS so many notions:
1- Americans are so rich that everyone has just gotten lazy and doesn’t want to work anymore.
2-The younger generation just sits around on their ass and does nothing because they don’t want to work and just want mommy daddy and the government to provide for them
3-The undocumented are outright stealing our jobs so participation in the labor force has gone down
When we hear that overall labor participation rate has gone down in the economy many of us despair. We forget that the demographics of the older generation are the driver in this but the more important driver to the economic engine is the prime age labor force.
The bottom line is this:
Be optimistic, a record number of us are working hard, not hardly working.
Thank you brother Wolf, I knew you would clear it up. Been reading you for a good number of years now and always look to you when I want straight facts that clear up the BS floating around the internet
Great four-part analysis – thanks!
I don’t dispute the data at all, in fact, am a case example of it. Just curious thought… I wonder how much of these low balances is because everyone has ‘stuff’. Specifically, during the pandemic, millions went out with their Covid dollars and bought a bunch of stuff. (Cool wheels, bro) Many / most probably still have it… i. e., not much need for the old school debt aspect of the credit card. Probably impossible to quantify, just more a random musing on the topic.
I don’t think it’s that. My theory is that it’s more that federal government spending is off the charts. The balance sheet of the American consumer is in superb shape because the balance sheets of corporate America and the federal government have added a lot to their liabilities.
Think about it. If startups burn investor cash (with borrowed money) and pay it out in salaries and bonuses to their employees, those employees are doing pretty well. Same with federal spending that ultimately ends up in consumer hands. Think of that on a national scale, and it’s easy to see why consumers are doing as well as they are.
I work somewhere that gets federal dollars periodically via grant applications mostly. The chick that runs the department that goes after the grant dollars just got a big promotion this week.
So, yeah I think you might be on to something. I like your theory better than my ‘stuff’ musings.
That’s why I’ve said for a long time that we won’t have a recession, or anything even close to it, as long as the federal government is running $1.7 trillion or whatever it is in yearly deficit AND for so long as BigTech makes hundreds of billions in profits due to their pricing power, and uses that free cash flow to invest in AI infrastructure. Put those together, and you have an enormous amount of spending and investment.
One has to crack before we get a recession.
I was talking with my father the other day and was saying that the very wealthy and the federal government learned a lot from 2008 and 2020 on how to keep the party going on.
But boy will there be a big hangover at some point!
Agree with you and your father. America seems to be the poster-child for Keynesian economics:
Get people to consume more all the time, and keep adding liquidity into the economy to keep unemployment low. Repeat forever. More ads. More people putting their excess money back into corporate hands via stockbrokers. No more business cycles. It’s perfect Keynes.
Seems to work, since Treasury bonds are always in demand.
The only problem is when the financial sector severely mis-predicts or misallocates risk. We might’ve done that with AI, yet all the government needs to do (if necessary) is let AI companies collapse and make investors whole, and employment will stay full. Or just start a _different_ sector of spending to keep employment high.
The only other risk is inflation, and yet even that has been managed away.
Agree with both of you. Our leaders seemed to have learned that, at least for now, the U.S. can borrow an unlimited amount of money without rates blowing out. The money printing from 2020-2022 caused major inflation, but there hasn’t been printing in years, and the U.S. is still able to borrow for 10 years at 4%.
So we have no business cycles, and all pain is transferred from the individual or business to the federal balance sheet. Why not? It has an infinite credit limit!
The party won’t end until yields blow out, and rapidly.
The national scale is what throws off this theory.
The startup example doesn’t scale.
A few VC-funded companies burning cash isn’t the same as income rising across millions of households in a $27 trillion economy.
Yes, government spending matters.
No, it’s not the whole story.
Wages matter.
Jobs matter.
Business output matters.
People DECIDING and not forced to spend mostly matters.
It’s not just “the government put it on a credit card.”
If it were that simple, we’d have seen this over and over again.
But it’s not a “few VC-funded companies.” The government putting $2 trillion of borrowed money into the economy every year has many downstream effects.
The unclaimed credit card points are also very valuable to banks. I have heard from a contact inside a large bank that they are holding about $20 billion in unused credit-card points. These points are technically the property of the credit card holder, and the bank has to hold assets in reserve against them. However, until the points are used, the bank can invest the money and make a lot of interest – which goes to the bank, not the credit card holder. Even at 3%, the bank can collect $600 million a year on $20 billion – not bad.
Unclaimed credit points fall into the same category as the card payment. It becomes an ACH to my bank where I use to pay other debts/costs. Don’t begrudge the bank for making a profit.
Something pops up in these charts just as it has in Wolf’s other charts. In late 2021 government began cutting back on the free money. Card balances shortly there after began to rise. Government had changed and renewed the free money and inflation began. So we started a new cycle!
I think we may be into a reduction of deficient spending. If a recession is on the horizon I can’t say. Everyone of the pessimists on this site has also suggested this.
vinyl1,
per JP Morgan’s recent 10-K, credit card reward liabilities reached $16 billion in 2025, up from $9.8 billion in 2021.
So yes, a nice and increasing source of “float”
I use my Fidelity Rewards card for most of my purchases with 2% back.
I’m netting about $450 a year in free cash and never carry a balance.
So, I certainly don’t let my rewards points build up.
I cash them in every month, religously.
$20 billion? Most of it is just a liability on a ledger — not cash, not a liquid asset the bank can spend or invest.
Redemption is unpredictable also.
The idea that banks are pocketing millions extra off of freedom to freely invest it really isn’t how it works.
Points also expire, and programs get adjusted.
Not sure your contact has it accurate.
My mom’s husbands wife told me that the consumer is struggling and she can’t find broccoli and beans
LOL – That is hilarious… seriously.
The credit card companies make a ton of money, but I also make money by swiping. I make as many of my normal monthly purchases as possible on it to get money back, and definitely any big purchases.
All good as long as long as I keep zero balance.
Try to make my money work for me any way I can.
PS… thanks for the article Wolf. No immanent economic doom today.
Ultimately the way it works is that everyone pays the 3% some way or another. You, me, and other schmancy credit card holders just get a portion back in benefits, but you can be sure it’s almost never the full 3%.
Better than nothing, but we’re not actually winning against the casino.
@numbers I get 5% back on all Amazon purchases with the Chase Amazon card but just 2% back on everything else with the Fidelity VISA.
Amazon is Amazon. Everyone else ensures that rewards in specific categories rarely exceed 3% and most definitely that average rewards never exceed even a fraction of 3%. If you aren’t getting 3% back on everything, you are either directly or indirectly (through higher prices) paying the credit card companies.
The 3% is the juice that feeds the entire rewards ecosystem.
@numbers I have not been able to find an unlimited 3% card (aka 3% on everything with no cap). Can you pass on the name of the card you use (Google would not find an unlimited 3% card for me).
Yeah…
I know I am not winning per say…
But it still takes a little of the edge of losing off.
I am trying to be optimistic, and you kinda peed in my cheerios. Haha.
Sorry. Didn’t mean to steal a small joy in the world. I play the points game too and it does make me feel like I’m winning. And it’s better than nothing.
In 2025, U.S. household wealth reached record highs, with total net worth surpassing $180 trillion by Q3 2025, driven by surging stock and real estate prices. While specific, finalized 2025 national median figures are not yet fully released by the Fed, 2025 data shows average middle-class household wealth was approximately $490,000, with significant disparities existing between homeowners ($1.5M+) and renters ($10k+).
Trumps SOTU speech sums it up, we bigger and stronger than ever, 4X deficit and we still have wealth to burn. There is still a conservative base of consumers of all generations who value economic stability. I love this country and its opportunities given forth to the average citizen. Time and the power of compounding has made the difference in many lives.
Measuring the federal debt, which is actual money owed, against “wealth” which is based on investor belief that the stonk market will never go down, is beyond silly.
What if we had a 40% correction like in 2009? At that point, it would only be 2.5x the deficit.
Be careful with averages.
Mean household income is $1.4 million as of last quarter.
Median for 2025 has not been reported yet, but it’s likely to come in around $200-250k (again per household), given that increases in net worth since 2022 are almost entirely concentrated in stocks (three-quarters of all gains in net worth were from stocks), and only about half of all households own any stock at all.
Median household income closely tracks real estate prices, not stocks, because their primary home makes up pretty much all of the median household’s net worth.
I meant median household net worth tracks real estate.
I’ll also add that after adjusting for inflation, average net worth for the bottom 75% of households increased by 75% since 1989, but for the top 10% it increased 165%.
So everyone is doing better, but the bottom half of the net worth distribution is just catching up to where they were in 2007 and the top 10% are doing much better than in 2007.
Folks who want to talk stats need to brush up on some of the basic terminology other than average, median, mean.
The basic function of statistics, the science, is not to quote metrics, which is just counting. The task of statistics in science and industry is this: given a number of samples (of any attribute) what can be known about that attribute in the population as a whole.
So let’s say we are testing 100 samples of ore from a potential mine site. An important stat at the completion will be the ‘standard deviation’ or how much the samples vary from each other. If they vary a great deal, the distribution of the attribute being tested is said to be ‘skewed’ and this being a science, the degree of skew can be calculated.
All five of my credit cards are closed as of early last year. Probably will never have another. If I can’t afford it I simply don’t need it.
I don’t understand this logic. I have tons of credit cards that I use for nearly everything. I only buy things I can afford, whether with cash or credit.
@TSonder305 I don’t know why Knan closed his credit cards but I know many people that need to close the accounts so they won’t use then the way some people can’t have alcohol in the house. I’m OK with credit cards and alcohol but I can’t have candy in the house (or I’ll eat it all, but luckily I won’t go out and buy more).
“Credit card balances: a measure of spending, not of borrowing.”
Hardly anyone uses a credit card because they don’t have the money. We use them for convenience and the points/perks.
It’s funny, actually, what misconceptions some people have about credit cards.
You need to have money to qualify for a credit card. Poor people have to make do with debit cards. Or they get credit cards but with very low limits that render the cards useless for bigger purchases.
Yeah I have never really understood the hesitation behind them. Possibly the horror stories that get amplified 1000x by Dave Ramsay in their boomer doomer porn.
There is a segment of people who can’t control themselves, but if you have enough self-discipline, carrying tons of cash around is just stupid and risky.
Wolf – just an observation – many of your articles seem to present an ‘all is well’ message about the economy and everyday life, It makes me feel, at times, like you are a deck hand on the Titanic, well aware that the ship is in major trouble, telling passengers that ‘everything is okay’.
I don’t own a single credit card. I laugh when I get a credit card solicitation in the mail @ 30% interest. Only fools would sign up for that.
“many of your articles seem to present an ‘all is well’ message about the economy and everyday life”
🤣 you’re not reading anything here, do you? You need to read the articles. they point at lots of problems and risks, including: inflation; the huge fiscal fiasco; ridiculously overvalued stocks; imploding stocks (a whole series on that); the AI spending bubble that will trigger a recession when it slows; the low yields and narrow spreads; and good lordy, the frozen housing market due to too-high home prices that are now correcting painfully in many markets; and on and on.
But the consumer as an economic entity is in good shape – that will change when unemployment explodes, but that’s not happening now.
So if you want to doom-scroll about the cracking, broken, tapped-out, crushed consumer, do it somewhere else; if you want social justice-warrior stuff, go somewhere else.
2. It seems you don’t understand how credit cards work. Credit cards don’t charge interest if you pay off the statement balance by due date every month, month after month. We have plenty of credit cards, and I don’t even know what the interest rates are because we never ever pay interest. It doesn’t matter to us what the rate is, it could be 100%, and I wouldn’t care, because we pay off the statement balance automatically by due date (automatic payment setup, and I don’t even have to mess with it), so no interest is ever charged, but we collect the 1% to 2% and sometimes 5% in cash-back for every dollar we spend with them. Most people do what we do.
I have 3 credit cards
1. Gas
2. periodic services, Internet, HVAC maint contract etc
3. Mail order purchases, medical bills, cell phone
I pay cash for everything else I buy in person. All credit cards are paid off every month.
This is exactly what I do too. With gas, I drive a lot for work (15-20k miles a year). I have a PNC card that gives 4% back for gas and I let it accumulate – by the end of the year I have hundreds of dollars in tax free “free” money to splurge on something for me or my family. And of course I never carry a balance.
There’s a cool federal program/maybe state that helps people in trouble with credit cards. It forces the banks to cease All interest collection, roll the interest to 0%.
its so a consumer can pay off the balance they accrued.
isnt that nice for the drunken sailor?
very humane solution. warm and fuzzy
never heard of that.
These are hardship programs the banks have to enroll the customer in, if they are facing sudden hardships.
Been around forever.
Helps avoid bankruptcy
There’s only one federal program I know of that FORCES banks to cease collection. It’s called the automatic stay that is imposed when a person files for bankruptcy.
I have no idea what you’re referring to.
Makes sense with increasing household consolidations. People have more at their disposal and will continue to spend.
Has there been any increase to HELOCS?
Yes, but they have taken the place of cash-out refis, which have collapsed
Here Come the HELOCs: Mortgages, Housing-Debt-to-Income-Ratio, Serious Delinquencies, and Foreclosures in Q4 2025
C/C available: $4.15T. If C/C rates drop to 13%/23% ==> more money
will flow to the economy. Cost will drop. The banks will make more,
not less. Debt can rise to $2,000T/2,500T, to 50% of 5,500T.
The regional banks will be a great investment !!
If credit cards are a measure of spending, not borrowing, and the delinquency rates are down to nothing..
And consumer spending is 70% of our economy..
then the chart showing skyrocketing credit card balances means the economy is going to the moon!
No?
Not to the moon exactly, but that’s the direction.
GDP not adjusted for inflation rose by 5.6% year-over-year. Credit card balances, a measure of spending, also not adjusted for inflation, rose by 5.7% year-over-year (but federal government spending dropped due to shutdown).
Take the win here – Jeez
Banks make money two ways with credit cards: Interest from people who carry balances and Fees from businesses every time you swipe – That’s it.
Now — the economy.
Is everything perfect? No.
Has it EVER been perfect? Also no.
Find me one time in history with:
Low inflation.
Rising wages.
Cheap housing.
Calm markets.
Shrinking debt.
No wars.
No political fighting.
Exactly.
Meanwhile — people are shopping – Restaurants are full – Airports are packed – Road trips booked.
We use credit cards and cell phones to pay for stuff. Not cash. Not checks. Not debit cards. And we are paying the bills on time.
Unused credit? High.
Defaults? Not exploding.
Jobs? Still there.
Some prices higher than years ago? Yes.
Do prices usually fall back to old levels? Never!
Reality: People are working – Earning – Spending – Living.
That’s not DOOM. That’s MOMENTUM.
Somebody tell the Democrats.
Use a credit card.
Get the points.
Get the cash back.
Pay it off monthly.
Simple – Solid – Smart