The ugly debt monster grew faster than current-dollar GDP.
By Wolf Richter for WOLF STREET.
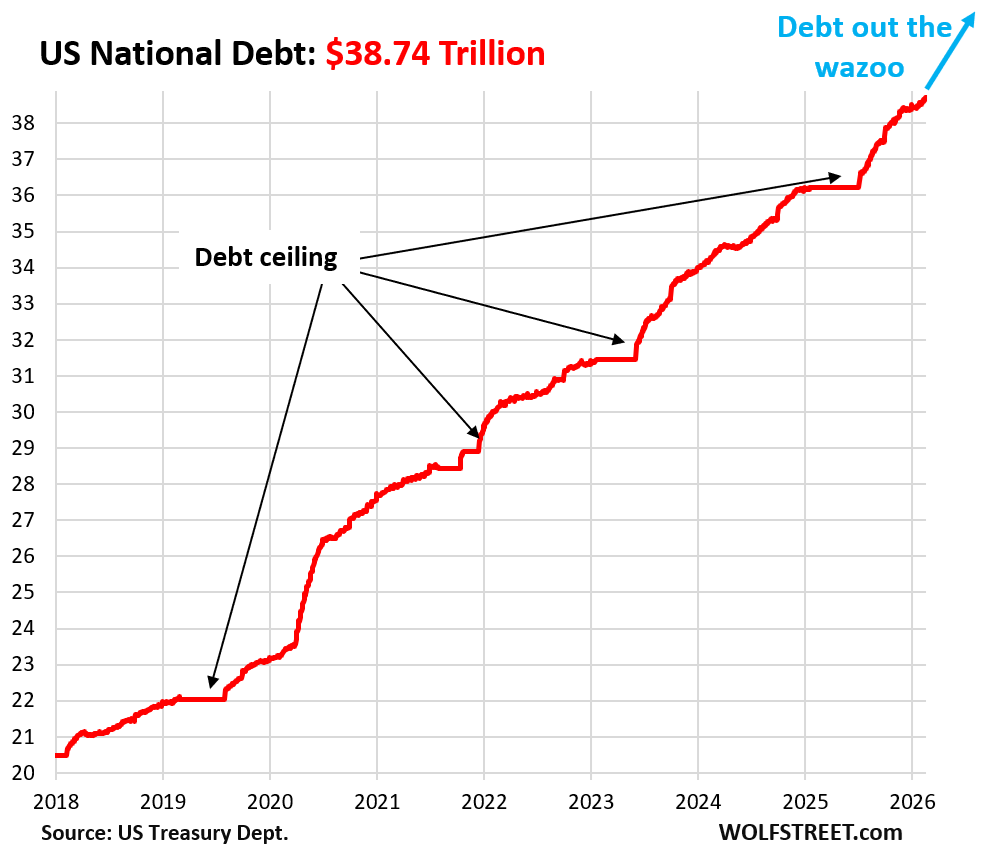
The US government-debt monster needs to be looked at in context, not by itself in a vacuum, though I’ll post the debt-in-a-vacuum chart at the bottom of the article for your amusement.
At the end of Q4, the US national debt reached $38.51 trillion, having soared by yet another $2.30 trillion over the 12 months in the calendar year 2025, or by 6.3%.
This includes the first half of the year, when the debt ceiling blocked the government from adding to its mountain of Treasury securities, and the level of debt got stuck for six months.
And then in July, after the debt ceiling was resolved, the debt began to explode. All of that $2.3 trillion were added in the second half amid a tsunami of debt issuance. Debt was flying by so fast it was hard to see.
In Q4 alone, so quarter over quarter, the debt rose by $877 billion, or by 2.3% from Q3.
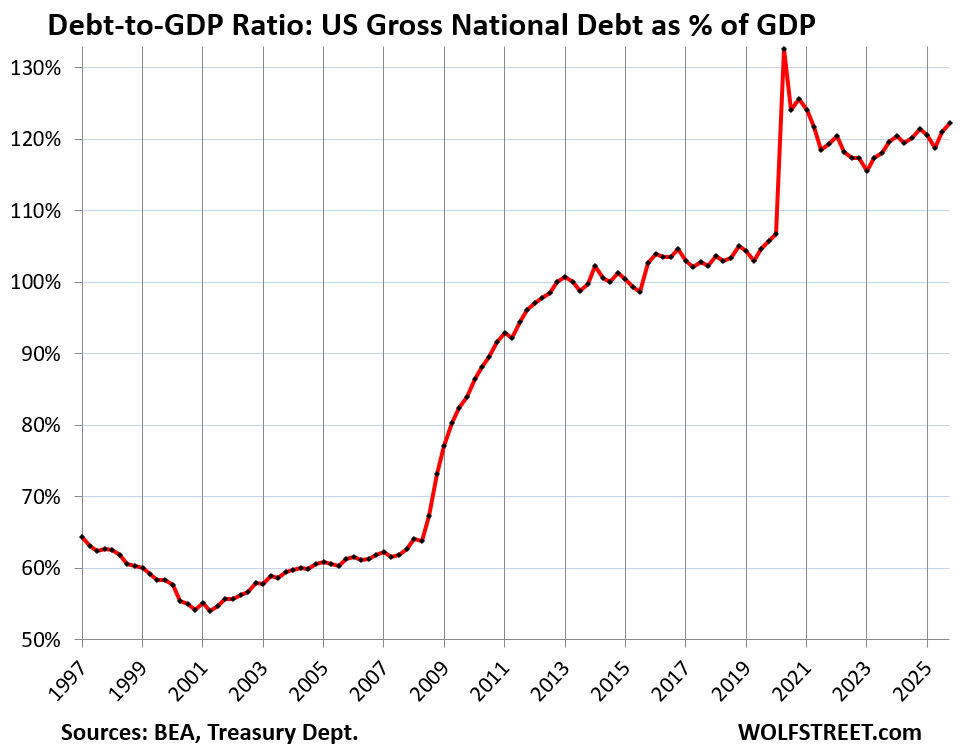
With Q4 GDP having been released on Friday — GDP got hit by a massive plunge in government spending due to the shutdown — the US debt-to-GDP ratio rose to 122.3% at the end of Q4, the highest since Q1 2021, as the covid spike was winding down.
This debt is the actual amount in Treasury securities that the US government owes and cannot walk away from. They are either traded in the markets ($28.84 trillion) or are held by government pension funds, the Social Security Trust Fund, etc. that owe their beneficiaries those funds ($7.38 trillion).
The debt-to-GDP ratio is the total Treasury debt at the end of the quarter in dollars, not adjusted for inflation, divided by annual rate of “current dollar” GDP in dollars for that quarter, also not adjusted for inflation. Neither is adjusted for inflation for an apples-to-apples comparison. Since the inflation factor is the same in the numerator and denominator, it cancels out and is not impacting the ratio.
The debt-to-GDP ratio rose because the debt increased by 2.3% in Q4 from Q3, while current-dollar GDP increased by only 1.3%.
$38.51 trillion in debt meets $31.49 trillion annual rate in current-dollar GDP.
For the whole year, the debt increased by 6.3%, and current dollar GDP increased by 5.6%.
If the debt increases faster than current-dollar GDP, the ratio continues to rise.
The debt-to-GDP ratio is important because an economy generates tax revenues that grow roughly with the economy, and tax revenues are needed to service this debt.
If the economy grows faster than the debt year after year, then the burden of that debt on the economy begins to lessen. But that’s not happening at this point.
For now, this growing debt-to-GDP ratio means a more leveraged government, and a higher burden on the economy.
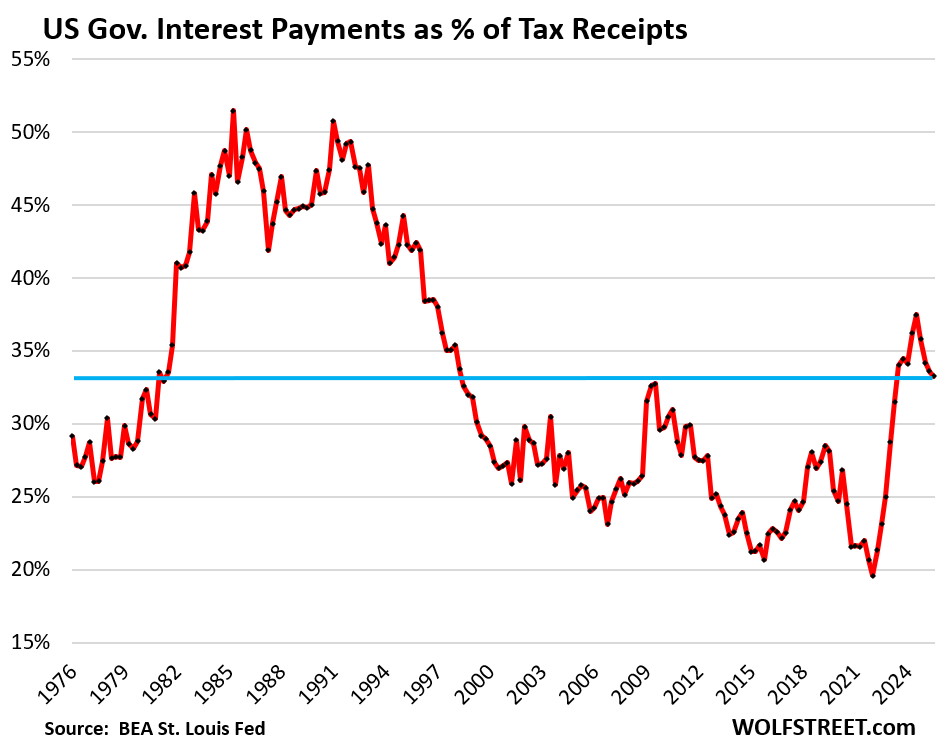
Another way to look at the debt in context is in terms of interest payments and tax receipts, which I did for Q3 last year, with new figures coming next month: US Government Interest Payments to Tax Receipts, Average Interest Rate on the Debt, and Debt-to-GDP Ratio in Q3 2025
And here for your morbid amusement, the US Treasury debt in a vacuum. It spiked by 88% in seven years, to $38.74 trillion as of Friday.
Enjoy reading WOLF STREET and want to support it? You can donate. I appreciate it immensely. Click on the mug to find out how:

![]()
Debt doesn’t matter…until it does!
lol. That is true.
The government needs to figure out how to raise 2 trillion in revenue just to keep debt from expanding.
Two options.
1) Reduce spending ( that won’t happen)
2) Raise taxes and create new taxes ( better chances here). I mean big time increases in taxes. 10% at every income level. Not just the rich.
Honestly. Are there any other options?
‘10% at every income level. Not just the rich.’
Bizarre. Next a doctor calling for a 10 % weight loss, even for the thin.
The first priority should be a crackdown on tax evasion and avoidance.
Evasion being potentially criminal, avoidance not. It is established that every dollar spent going after evasion returns about 6 dollars in revenue. Evasion has to be large and blatant to receive other than financial penalties. It does not help the case if the evader has publicly said: ‘only the little people pay taxes’
Avoidance is likely more common, given that the downside is merely having it disallowed. Here a prime target should be the ‘write off’ wherein income is reduced by a loss. An example is the private jet aircraft. These are usually owned by a company set up by the owner’s accountant. But lo! this company loses money. The owner and associates pay fares, but these do not cover the costs of hanger, pilot, and maintenance. So, a write off.
I saw a version of this decades ago when my father operated a marina that did some yacht brokerage. Sometimes a larger yacht would end up in a newly- created charter company, It would actually get a few summer charters from the owner’s friends, enough to meet the tax code ( who knows whether the guests were given their money back) but this would not cover even the mooring which is very expensive. So … a write off.
Much more common than either of the above is likely the write- offs for ‘entertaining’ of clients, certainly expensive food and wine, but ‘entertaining’ is a broad category, which includes a multitude of expenses.
Nick Kelly, on a smaller scale, a friend since passed had a business that acquired more than a few vehicles for landscaping. Business fuel credit cards were issued, but so much personal use was used. Same with a business leasing a vehicle, used for a lot of personal travel.
Kick the lobbyists out of Washington, D.C.
I could have got fired over taking super bowl tickets at my job.
The hogs go to the trough because there is food. The lobbyists go to Washington because there is money. The lobbyists are the symptom not the cause.
With the layoffs and voluntary departures at the IRS in the past year, the tax evasion problem is likely to get worse not better.
You know many people who have evaded taxes?
The debt bomb has been a slow-moving train wreck for 50 years. Congress refuses to fix it. Our Democracy has failed. Trump’s election to the Presidency twice, proves that. We’ll have $40 trillion of debt by the end of the summer of this year. One day soon that debt bomb will blow up in our face, and then it will be 1932 again. 50 years ago the federal debt was about $300 billion. Now it’s over 100 times more. In year 2000 the federal debt was $5 trillion. Now it’s almost $40 trillion.
You forgot the first option. The option. The one that they are using.
Lower interest rates and inflate the debt away.
And the growth option – the one being fought tooth and nail by all the Congress critters (and their billionaire/corporate backers as well as foreign gov’ts) who have a very different agenda in mind.
This debt is the actual amount in Treasury securities that the US government owes and cannot walk away from. They are either traded in the markets ($28.84 trillion) or are held by government pension funds, the Social Security Trust Fund, etc. that owe their beneficiaries those funds ($7.38 trillion).
That is the arithmetic of how the debt of the empire devalues the currency
Government borrows money to build a reservoir/bridge /dam etc. that will last +100 years and be used mostly by future generations. The theory is that they should thus mostly pay for it, by repaying the long-term debt. Would you like to immediately pay trllions of dollars for another Hoover dam so that
your great great grandchildren get free water? It would be impossible build such structures from annual tax revenue.
Our Federal government debt is mostly related to entitlement and defense spending, not infrastructure.
The biggest “entitlement,” Social Security including disability, is self-funded and has had a surplus for several decades that’s now over $2 trillion. That’s the opposite of debt funded. Part of Medicare is the same way.
But Medicaid and the other part of Medicare, along with some other programs are in the budget, contribute to the deficit, and the debt.
If ONLY the Feds were building or replacing critical infrastructure!
I can’t say I have a good idea where the money goes.
I CAN say: I suspect it is not the most efficient of allocations.
All it takes is some other entity to displace the US Fed Gov as safe harbor for surplus US currency which has reached end of money velocity.
I recommend going back in history before the Fed Gov rolled its debt in perpetuity and when we didn’t have a national currency. Where did all the surplus currency get parked back then? You know, who offered the yield of safest resort? They should be able to displace the US Fed Gov this time around too
Now that is different…
MW: The Supreme Court’s tariff ruling has economists even more stressed about worsening US debt
J Powell will just print the money to pay off all the companies the money they paid for the tariffs, $230 billion and then some. This will be his parting gift on his way out. Look for massive fraud in the payoffs.
🤣
1. By the time companies get refunds, if ever (this will be litigated for a long time, 1,000 lawsuits have already been filed), Powell will long have vacated the chair of the Federal Reserve (his term expires on May 15, 2026), and will probably be gone as governor too.
2. His replacement, Warsh, is on record as opposing balance sheet expansion and wants a smaller balance sheet. Bessent wants the same.
3. There is huge demand for Treasuries, which is why yields are so low, so if and when they have to add $170 billion in refunds to the by then $40 Trillion of existing debt, no one will even notice.
I thought Bessent said all of the tariff money was there and present in the US Treasury accounts now.
but we want to watch the world burn!
Wanting & doing / following through are two different things. I’d love to see Warsh start to slowly sell MBS, in order to reduce the balance sheet a little quicker. The question is how well do they hold out when there’s a downturn in the economy? Do the Fed, Treasury, Congress & the President let things play out more like 2008 vs 2020? Time will tell, and I for one hope it’s the former.
There are several other Fed governors and presidents that have come out in favor of a “more efficient” smaller balance sheet, including Waller, Logan, and Williams. Waller is on record as a dissenter when the FOMC decided to slow the runoff last May. Powell is the architect of the “ample reserves regime” and he is going to cling to it for as long as he can.
Lawyers are salivating over the new business (1,000 lawsuits) heading their way thanks to the Supreme Court. This will not do anything to address the country’s fiscal problems.
Do we need to worry about the national debt when the US GDP increased by a similar percentage in the same time frame (about 6% less is my understanding for 2025)?
As long as that ratio stays the same, not overly much.
You don’t need to worry about a Sword of Damocles, either, as long as the string doesn’t break.
The problem comes if there is a recession when GDP falls but spending grows to stimulate the economy. Then the ratio increases quicky.
Given that the ratio is already high, such an event could push it into a potentially dangerous range.
Good example right on the chart – 2008 to 2013. Ratio skyrocketed by 40%
ok, so who is manipulating bond yields. they should be going sky high.
There is still way too much demand for this paper. No one is taking anything seriously.
I would argue that demand is not so great over 5 – 10 year terms. As for general demand, China will keep selling. Japan’s “carry trade” is in serious trouble and they are divesting/ not reinvesting. I totally agree that US debt is not being taken seriously and that’s scary. Btw – Good article!
No doubt that US debt-to-GDP will keep going up.
I wonder – when will buyers of that debt get worried enough about the U.S. being able to sell all of the debt at the interest rate of recent history to other investors, that the interest rate on the debt gets to the point where the U.S. economy is substantially harmed, or crippled ?
If the Strauss-Howe theory is correct, along with other theories on social cycles, that time is coming in the next 10 years.
I think some people here have said that buyers of U.S. treasuries will never be worried about that, and those buyers will never require U.S. Treasuries to sell at junk-bond prices.
I fully expect something like a J’ish Jubilee Year in the next 10 years.
The federal reserve will always step in and buy treasuries with printed money if needed. Crippling interest rates, if they happen, will be a political choice.
They do that, and watch rates really blow out. They don’t have the cover of COVID anymore and they can’t claim they didn’t know inflation would skyrocket, like they did last time with the “transitory” nonsense.
Great question- WHEN? The lifestyle Americans cherish is built on a mountain of debt – both personally and by their government. It’s a dangerous entitlement to be sure. You mention “junk bonds”. It’s ironic that the US President has used junk bonds in his failed businesses.
Debt is like snow…it adds up and up…if it isn’t minded you can be killed in an avalanche.
Don’t worry, inflation will melt off some of that snow….
Tax cuts for Billionaires will fix everything., :->
Should be starting up again in 2 or 3 years.,….
that’s only true for inclines. there hasn’t been an avalanche in Nebraska for atleast decades…
True…but which simile applies to federal debt?
“The debt-to-GDP ratio rose because the debt increased by 2.3% in Q4 from Q3, while current-dollar GDP increased by only 1.3%.”
If we assume all of that increase in Federal debt was spent on goods and services, the fact that GDP increased by only 1.3% means that other GDP components have been negative. From a quick look at St. Louis Fred statistics, it looks like the main culprit is next exports, dragging GDP down by 2.5% (the other components held roughly steady).
Therefore, our high government deficits are fueling a big trade deficit. The U.S. government is now spending more and more and getting less and less in GDP growth.
The dysfunction shows in higher interest rates on 10-year U.S. government bonds coincident with the broad dollar index going down. Mr. Market looks like he’s losing confidence in the dollar.
What happens if this craziness continues? One scenario is that the dollar keeps dropping and inflation rising. This in turn will cause interest rates and the fiscal deficit to keep going up in a doom loop. Or rather, an accelerating doom loop.
Central banks seem to be hedging this by buying gold and other safer assets. Should I do likewise? Why should I hold dollars if the smart money is leaving the sinking ship?
That’s always how it goes. Government spending to stimulate the economy becomes a diminishing returns situation.
Regarding the craziness, people are blaming Trump’s erratic behavior for it, but my belief is that the vast majority of deteriorating confidence (even if we are still the cleanest dirty shit) is from our refusal to cut spending.
When 90% of our spending is non-discretionary where to cut?
I doubt the military will ever get a haircut and the US social safety net (what little there is) heavily favors seniors (who vote).
I think DOGE tried to tackle that 10% discretionary and found little meat on that bone that would meaningfully change the data we see.
Clearly the only thing to cut and actually make a dent is the non-discretionary spending, which is part of the problem.
The lobbies inflate every cost. Per capita healthcare is 2/3 less in Canada. The social security fund could invest in real assets. Deregulation could still unleash the economy. New technologies could lower most costs. It’s a solvable problem.
I forgot to add that a flat tax without exemptions would eliminate 95% of the tax bureaucracy, including the lawyers and accountants. Think about filing your taxes in 5 minutes every year. Next we dismantle the insurance industry…. Basically the same process.
The definition of “non-discretionary”… is, itself, discretionary.
I have worked for government and efficiency is not part of the vocabulary.
I have witnessed a private company take over things previously provided by a local government and deliver a much better product at a lower price.
The things we subsidize often only serve to distort and nullify any “free” market.
The entire medical system is controlled by (very profitable) insurance and pharmaceutical companies. The heavily subsidized USPS spends more time driving around (literal) garbage “mail” than anything else.
I am sure I could go on about the “necessary functions” that the government bloats up and ruins, before delivery.
“The entire medical system is controlled by (very profitable) insurance and pharmaceutical companies”
Interesting example since those are the very same private companies you deem are a panacea.
Yes Medicare is very efficient and has a very high approval among its users (and is big government)
I think a big issue isn’t so much government but government in the wrong hands (much like a chainsaw).
“ those are the very same private companies you deem are a panacea.”
Sorry, I should have been more clear. The example I was thinking of, regarding a privatization, was a small transit system/ ride company.
The medical system is a huge one, and by making it a competitive, for-profit model it only serves the profiteers, and not the patient.
A single payor system (such as Medicare attempts to approximate) could provide a more efficient and effective treatment system, but the healthcare question is too big to address in a comment.
I would have to disagree about the “efficiency” of Big Government at this time, since it’s biggest product is debt and deficit.
Government is in the business of price- distortion. Subsidies, favoritism and even legislation all serve the capitalist, and are owned by the capitalist (lobby et al) and tell the “voter” and citizenry whatever it takes for the grift to continue.
When things are priced correctly (including basic things like money, water and energy), it puts real pressures on people and influences their behaviors. When things are all manipulated, it leans towards enabling bad behavior (and incentivizes the few who enjoy the bad behavior, and the gain).
It never fails to amaze me how NO ONE ever thinks the massively bloated Dept of Defense should see a cut – running at $1 trillion a year for over priced everything – troops stationed in Germany, etc, etc and so lets just get rid of Dept of Educ and whatever else. Just amazing. There is no budget because the DOD spends all the left over money.
The gold price is the inverse of confidence in the sum of all alternatives to gold. We’re a long way from peak gold.
JP Morgan Chase is predicting 6000 USD gold in 26
JP Morgan Chase is predicting… 🤣❤️
Digital: Keep stacking electrons Hell no!
Physical Gold, Silver and Lead are the real monies of the Hunger Game Era
I now understand the origin of your prior comments: Your brain thinks you’re actually in a fictional movie world (Hunger Games). Really scary when your brain can no longer exit a fictional movie made to entertain.
The same JP Morgan that had three employees (if memory serves) convicted for gold market manipulation a few years back?
Take heed!
The Eurozone has a cap of 3% deficit, and if you exceed it, sanctions will follow. We have double that. Definitely not sustainable…
France should be another good test of EDP. I think one of the most difficult countries to try to cut spending and given not much of an industrial base hard on the other end too. Not the only country who struggles but given EDP has been used more than 120 times not uncommon either.
I believe the US govt operates on a “base line” accounting game in which there are AUTOMATIC increases for departments in the budget.
This is absurd.
Spending freeze needed combined with bureaucratic attrition.
Eliminate the lobbies.
Correct. Though that is a consequence…not a root cause.
Attrition in an aggregate sense matters as you point out.
That said, having been in the belly of the defense/intel beast for several decades as military, civil service and contractor: the entire process and culture is captured by political and corporate interests. The overall mission statement is important…very important. There are solid tools (e.g., program management, budget reviews, requirements definition, T&E, etc.). There are knowledgeable, dedicated engineers, department heads, war fighters, etc., etc. The department executes IAW its charge.
Nevertheless, it has been my experience that the work force (regardless of political affiliation) is highly geared toward personal advancement over mission statement, political operatives (Congress critters) suffuse their parochial interests at every level of decision-making, the mega-large corporations provide critical war fighting tools but suck the taxpayer dry through all sorts of contracting machinations and lobbyist influences, complexity itself has become a cost multiplier.
Culturally, there are now generations of families (again, all political spectra) who view gov’t employment as assured longevity with ample benefits at the retirement end, power couples who populate interfacing branches of the organizational tree, certification collectors (Fort Meade was an eye opener!) prepping their leap into the corporate side at very healthy salary increases, routine/mandatory hand holding meetings to address the latest feel-good cause (or political indoctrination).
One of my pet peeves is how politicized HR departments have become. Gov’t policies ostensibly purposed to protect civil service employees against political recrimination, discrimination, etc., can (and routinely are) exploited to buttress non-performers from accountability.
My guess is that these factors hold across the entire gov’t org chart. Undoing this monster would be a Herculean task.
LOL, there’s no deficit cap in the U.S.
The debt ceiling is an utter joke with congress and the executive unable to see anything like reality. Without these stupid tax cuts of the last decade we would not be facing this fiscal cliff.
But hey, deficits don’t matter if you are Dick Cheney and you are dead. For the rest of us, it will matter, and someday much sooner than we had seen years ago.
How does this play out? Well, we have a bunch of big tax increases on medicare, social security, capital gains, and income taxes, and corporate taxes, plus killing every single scam loophole for all these taxes. That balances the budget, and we all live happily ever after. But first, to get to this bitter reality, we must have our fantasy of tariffs doing all that heavy lifting.
Morons. OUR politicians, and OUR voters.
There, problems solved, if only America was brave enough, and smart enough to realize the free lunch is over, the boomers ate it, and we have to clean it up.
Not enough people willing to make sacrifices from their imaginary wealth, because this threatens the dollar and our ability to keep on top of the world economy.
But hey, it’s going to be somebody else’s problem, riiiight?
Nope, unless you go quick (like going in hospice), you are in the boat with the rest of us.
The first huge spike in the graph was due to the financial crisis and under Obama who also cut some taxes but gotta get that Dick cheney jab in
The charts and the raw numbers do not discriminate between political parties; the debt has surged under both Republican and Democratic administrations regardless of the specific catalysts involved. While it is true that we issue our own currency and therefore cannot go bankrupt in the traditional sense, we are certainly approaching the limits of our fiscal maneuverability. The primary issue is the lack of honest, hard discussion regarding the long-term sustainability of our current spending trajectory.
That’s my point.
We have actually decreased this ratio before and the world didn’t end. We did it in the 60s to 80s and again in the mid 90s.
It takes the parties actually working together. And honestly it isn’t even that hard. Lower rates of spending growth. Let the economy grow more. Maybe raise taxes a touch but the government will just spend whatever taxes they raise. I’d rather them start with spending increase slowdowns
1982-1993 (Reagan/Bush), 2008-2012 (Bush2/Obama), late 2019-early 2020 (Trump).
Guess how we did it from 1945-1980?
By raising taxes and letting inflation make it disappear. There was no decrease in federal spending as a percent of GDP during that time period. In fact it actually increased.
Guess how we did it in the late-90s?
Pretty much exactly half by raising revenue, which increased from 17 to 19.5% of GDP, and half by cutting spending, which decreased from 20 to 17.5%.
Bushwa. The first big spike came before 9/11 when Dick made his deficits don’t matter, reward the base.
Blame starts there. And spare me the bipartisan schtick. They both are somewhat to blame, but the blatant GOP concern switch when they are in opposition is such a long term blatant hypocritical part of the record that it deserves special blame and mention. If you don’t like it, don’t sit there and play Proxmire, because he is dead as well.
BS. The tariffs are the first tax increases in a while, and the left (along with the free trade absolutists on the right) are the ones fighting it hardest.
Look at the line from beginning of 2009 to end of 2016 doofus ; then look 2016 pre=covid to 2020 ; yes, let’s add more taxation because the gov’t doesn’t have enough yet to spend; we don’t have a taxation problem – we have a spending problem – that’s always been the issue ( both, parties );
lol!
So, tracing all the way back to the 1960s when a specific war and social legislation/policies that have run into mega-trillions of gov’t debt have had no influence on aggregate federal debt?
Eric86:
Nope, Bush. Obama took office on 1/20/2009, halfway up that spike you are referring to.
I remember in GWBs last year in office he signed a Democrat Congressional budget with $1 Trillion deficit. That took the national debt to around $9 Trillion.
240 years to get to $9 Trillion…….and 15 more years to get to 38 Trillion………
The “new” Federal Reserve has been the great enabler of debt expansion. Is this debt “transitory” too?
I think a big issue is right now there is no crisis and Debt to GDP is 122%. If something bad happens…..ouch!
Both parties have been relying on the bond market to fuel spending since the early 1980s. So far the bond market isn’t spooked at this current scenario (amazingly).
Another Cheney quote (I may be paraphrasing) “Reagan proved deficits don’t matter”. And the bond market has largely agreed.
The Great Recession began in Q4 2007 under the Bush administration and was a significant reason that Obama won the 2008 election. Obama didn’t take over until January 2009, a bit over a year into the Recession.
The Fed and the Obama Administration own the QE that was done to try to resolve the recession, but did not create the circumstances that led to those choices. Bush and Cheney both deserve their fair share of the blame.
Federal receipts as a % of gdp have pretty much always been under federal outlays as a % of gdp. Under every president
Guess you missed Clinton, which was the last time we were in a great long term fiscal position. But whatever.
Cutting expenses enough would entail parking those aircraft carriers, and playing really small global ball. Ready for it? Right now, today, 20% of our farmers are surplus, and if you stop paying them to turn corn into ethanol to put into engines? Pffft.
Like so many, you greatly underestimate how interest is starting to run away, and that will be that.
Math doesn’t care about you or me, it just is, and it will dictate how this starts to go south.
And you purposely hearken back to when we had adults in the room. Welp, those were WW2 folks who remembered the 1930s. They knew if they screwed up that era was going to come back.
Here it is. Like a little fascism, bad economic experimentation, etc?
Good night, good luck, try not to die.
And hope adults will sell or force the crap sandwich again, or the dollar will die and we will have to deal with a world turned upside down.
And make no mistake, we are talking about the death of the dollar, and all that means, including the death of exorbitant privilege.
So stuff protecting a bunch of partisan morons, and realize the stakes are fast exceeding what anyone seems to think is possible.
Want a discussion about how to recover from this?
How about a Rentenmark? LoL.
It sure ain’t going to be crap beanie baby coins.
There is only one choir in congress that even attempts to sing a debt reduction song and they don’t starts with D’s. The media is as much to blame because anytime a reduction in spending for anything is broached, people will die, children will go hungry, the marginal will suffer, and the sky will surely fall.
I’m so tired of hearing this BS about how Clinton was the only one to balance the budget or whatever you’re claiming.
First, he supported a budget that was proposed by the GOP Congress. It was a bipartisan effort.
Second, we were in a great fiscal position in the 90s because the tech boom was in its early stages, there was a lot of growth around that, Boomers were hitting peak earning years (but the oldest Boomer in 1999 was only 53, so no outlays yet for Medicare care of whatever).
It was basically an accident of history that our demographics were as good as they were ever going to be. That’s not likely to be repeated again, nor does Clinton get special credit for that.
There are about 3 Republicans that actually believe in deficit reduction (Rand Paul, Thomas Massie, and maybe one or two others). Everyone else just loves talking about it while taking actions to make it worse. The idea that Republicans are meaningfully better on this than Republicans is just a total lie. If you help spread that lie, you’re either a fool or a liar.
Bonus points for mentioning Beanie Babies (take that, generation X ),
President Bill Clinton (Democrat) balanced the federal budget through a combination of increased tax revenue—specifically targeting the wealthiest Americans and reversing 1980s policies—spending restraint (including a reduced military budget following the Cold War), and a booming technology-driven economy, the first federal budget surplus in 1998 since 1969.
Guess you missed the other side of the dynamic: Contract with America, House leadership pressure, etc. Triangulation had its imperatives.
Clinton was always adept at survival. Perhaps his pal Epstein counseled him.
This is true. Thanks to a growing economy and a little inflation, deficits of approximately 2-3% do not increase debt to GDP.
This is also how most businesses operate. As long as business is growing, a little debt is a good thing and allows the business (or country’s economy) to grow faster.
The only difference is that businesses produce new things and ideas that people need. We want businesses to grow. We don’t want or need government to get bigger, we need it to be more efficient with the revenue it already has. The ideal situation is growing private sector and GDP with shrinking, highly efficient government.
Greatest democracy ever. I’m sure your vote counts for more than the money politicians get bought with.
Representative Republic.
It’s a Democratic Republic- and the process of voting (as people in a democracy in various states) is the whole foundation of it. If democracy in action through voting doesn’t happen the republic itself won’t exist.
This is always the dumbest comeback. Sounds smart but it’s not. So it’s ok if our system does things that the majority of people don’t want just because we call it a different thing than a democracy?
The entitlement of US citizens to a relatively unsustainable lifestyle is now inbred in society. To change it means hard changes must happen which cowardly politicians will not take on. There are only 2 ways to balance the books – increase revenues or decrease spending. On the spending side, what is “discretionary” may have to be enlarged. On the revenue/taxation side, I have always advocated for a flat tax for all – even billionaires. Although, there is as much a chance of that happening as landing a man on Mars this year under this administration.
Hate much? Your biased politics are showing!
Key 2024 Federal Tax Revenue Highlights:
Individual Income Taxes: $2,426.1 billion, an 11.5% increase over FY 2023.
Corporate Income Taxes: $529.9 billion, a 26.3% increase over FY 2023.
Payroll Taxes: $1,708.9 billion (Social Insurance and Retirement).
Total Gross Collections: The IRS processed over 161 million individual returns and collected a total of $5.1 trillion in gross revenue. (That’s a Hell of a Piggyback Ride off the GDI’s in this country)
Refunds: The IRS issued over $461.2 billion in individual refunds.
Once the AI and its robot workers take over in the next 20 years, everything will be provided for free and there won’t be any need for money. So debt won’t matter. All the assets everyone owns will be of no value or use. There will not be any billionaires. Everyone will be equal.
Don’t worry, be happy,
Party on Garth!
Robot hands you coffee, cigarette lit, your fav newspaper, slippers and tells you how much your grass grew last night.
Perfection.
The ratio was close to this after WWII, so it is possible to reverse the situation with responsible leadership, but not gonna happen if nobody is willing to entertain any tax increases. All they do every election cycle is promise more tax cuts, and nobody seems aware that both personal income tax rates and corporate rates are well below the post WWII averages. I guess the tariffs are an exception to this however.
Tax increases?!?! What about SPENDING CUTS? Please, with 1.5 TRILLION being promised to the military industrial complex, it’s pretty clue that your corporate owners are preparing the peasants for WWIII.
The point I try to make people consider is that it will take both tax increases and spending cuts to fix this. But just as you reacted, nobody is willing to acknowledge the tax increase side even though rates are historically low, and they just keep cutting. Look at marginal income tax rates from the post WW2 decades of the 20th century, and you will see one reason why all the wealth is becoming concentrated at the top while the debt piles on.
Marginal income tax rates are only half of the story. There were absolutely massive loopholes and tax shelters prior to the tax reforms of Kennedy and Reagan. Federal tax receipts as a percentage of GDP are only slightly lower now than in the 1950s, because literally no one paid that 90% bracket because of all the loopholes (17% vs 19%).
The best thing for everyone is lower rates across the board with fewer exemptions. This is what both Kennedy and Reagan did. It would be better for all of us if there were no exemptions and lower brackets as there would be less wasted effort and money looking for loopholes, people could make economic decisions without regard to the tax consequences.
Tax increases FOR WHO exactly? Seems like corporations and corporate owners appear to have “no income” in the eyes of the IRS. See the problem yet?
You also didnt live back then. Don’t cherry pick. I grew up in the 50’s. I remember my grandparents and their stories of life. I some how don’t think they would 100% agree with your vision.
For context. What is the ratio of debt to wealth of the private sector?
Can’t you see that on any company’s stock profile?
A good stock app that’s free is GuruFocus
you can analyze companies balance sheet pretty fast. It’s a lot of you need the full version but the free has a lot of nice info.
State of the union: attack the attackers. By July 4th: a victory parade: Debt/GDP will deflate.
It would be interesting to see Public, Household, Municipal and Private Debt (PE) related to GDP over time
Debt to GDP will really explode if we get a long overdue recession. Some hand wringing going to happen then.
That’s our good cop bad cop political system now.
Repubs make the mess
Dems are so handcuffed to fixing it, they become unpopular.
Repub elected on change, then breaks everything
Rinse and repeat
I’m imagining you posting this with a straight face! Not possible.
The same people who backed MMT, created the context for baseline budgeting and continuing resolutions, who created the structure for corporate exportation of jobs overseas – they are the masked heros?
Dems care about power and money. Repubs care about money.
Thermostatic Politics in the US is like watching never ending bad sequels.
“We have to spend to keep from going broke!” Why said that LOL
The only solution is to cut social security and Medicare. The amount of money spent on old people compared to children is disgraceful.
Ignorant BS. Social Security and part of Medicare are SELF-FUNDED and are not part of the budget and do NOT contribute to the deficit.
You’re confusing that with Medicaid, which is part of the budget and deficit, and the portion of Medicare that is also part of the budget.
Why would you cut what you put into it?
Social security is just an annuity you pay yourself.
Medicare kind of as well. You are paying it in the hopes you will grow old and pre buy the best group medical coverage there is.
Cutting social security, Medicare and Medicaid are just lines the rich use because they want access to that huge honey pot of money to invest it (bet it) and make themselves richer. Rich people begrudge poor people having anything.
Harvard Medical did a cost study and announced that every medical procedure or device in the US was the most expensive in the world.
Maybe.
I think a better start would be actual oversight and enforcement to recapture the billions, likely trillions, in fraud.
Apologies to Wolf if he alluded to this above and I missed it, but as he has also stated recently:
“All fiscal and monetary sins eventually lead to inflation and demolish the currency. ”
I know 2% by PCE year-over-year is the Fed’s target, but if the govt can keep the lid on at 3% over time (it’s currently 2.9%) we’ll be getting off easy.
The older I get, the more I agree with this sentiment. Inflation since Nixon abandoned the gold standard on average is well above 3% annually, and is purposely under measured by the government because of hedonic adjustment and substitution bullshit. The 10 cent candy bar of my youth is 2$ and smaller sized. The 25K home is 600K.
The last vestige of legal reserve and reserve ratio requirements against the Federal Reserve Note, demand deposit, and inter-bank demand deposit liabilities of the Reserve banks was eliminated in 1968
Yep. And now all those tariffs need to be paid back. Ha-ha.
The devaluation trade is definitely still in play.
taxpayer on the hook again for poor choices, by voters and by the elected.
Is GDP the correct way of normalizing the debt, if the bond market is not responding to debt-to-GDP (per Wolf’s comment above “There is still way too much demand for this paper. No one is taking anything seriously.”)? Is there some other ratio of debt-to-X which would be more meaningful? Basically, it seems that the folks lending the U.S. money are not looking for GDP growth exclusively, but something else more complicated. So what would be a better overall figure-of-merit X (which could include GDP as one of many factors)?
Interest payments as percent of tax receipts is also good. It shows how much of the tax receipts have to be used for interest payments, and what’s left over for the rest. But this is influenced also by interest rates. The next batch of data that I use for that will come out in March. This is through Q3:
Yes. 20%-37% or whatever of interest expenses is roundtripped back to revenue. Is there a place to find the average of what tax brackets the people who get these interest are in, to get an exact number?
Almost all my treasuries are in tax-deferred accounts. My stockholdings and related gains are in taxable accounts, but the gains are not recognized, and so non-taxed. The only tax I pay is through consumer inflation, but I minimize it by limiting discretionary purchases.
Some would say sarcastically – I’m a really fun guy.
Value added tax, anybody? I thought tariffs might work to reduce our deficit, but I guess we are not even going to be able to find out ,
When Quadros left Brazil 100 dollars US bought a two foot stack of 10000 qrusaro(sp) notes. That is a two foot stack of 10000 denominated Brazilian bank notes.
Where’s Newt Gingrich when we need him? All the talk above about Administrations ignores the fact that it’s the Congress that sets the budget and the Executive signs it. Back in the 90s Newt laid out the plan and Clinton just went along.
Freezing the Federal budget in dollar terms for a few years is step one. That will feel like 3-5% annual cuts to agencies that will need to become more efficient. Raising taxes is step two – eliminate SALT, increase the top capital gains tax rate, INCREASE the standard deduction but raise the higher income tax rates for a net tax gain. Step three is to eliminate federal programs that should be funded at the state level.
at a trillion a year, debt servicing flows into business and private usage. you can add munis and corporate servicing. Interest payments don’t just slide into nothingness.
Interest payments don’t existing in a vacuum either. You have to look at them in a context of tax receipts, which is what pays for interest payments. And tax receipts have been soaring thanks to capital gains taxes, tariffs, and income taxes. This is through Q3:
The economy has been run in reverse for decades. An increase in bank CDs shrinks GDP.
Economist John O’Donnell said of the U.S. Golden Era in Economics:
“increased money velocity financed about two-thirds of a growing GNP, while the increase in the actual quantity of money has finance only one-third.”
In other words, the ratio of the money supply to GNP has increased. Money is less potent than savings. The modeling today is where every dollar of R-gDp is now financed by new money.
During the U.S. Golden Era in Capitalism (not optimized with 3 recessions), the annual compounded rate of increase in our means-of-payment money supply was about 2 percent
It’s funny you don’t hear from the MMT people anymore since inflation undeniably came back.
When we have a recession, debt to GDP will go vertical!
The velocity of m1 is 1.653. By that measure it takes a lot of new money to finance GDP. Savings does not equal investment.
All monetary savings, bank-held savings, originate within the payment’s system. There is just a shifting of bank deposits from demand to time (interest-bearing) deposits. Since time deposits originate within the banking system (and there is a one-to-one relationship between time and demand deposits — an increase in TDs depletes DDs by an equivalent amount), there cannot be an “inflow” of time/savings deposits and the growth of time/savings deposits cannot, per se, increase the size of the banking system.
The drive by the commercial bankers, as perpetrated by the ABA, to expand their savings accounts (derivative deposits), has a totally irrational motivation, since it has meant, from a system’s perspective, competing for the opportunity to pay higher and higher interest rates on pre-existing core deposits in the payment’s system.
But it does profit a particular bank, to pioneer the introduction of a new financial instrument, such as the negotiable CD – until their competitors catch up; and then all are losers.
The question is not whether net earnings on assets are greater than the cost of the funding [sic] to the bank; the question is the effect on the total profitability of the payment’s system. This is not a zero-sum game. One bank’s gains is less than the losses sustained by other banks. The whole (the forest), is not the sum of its parts (the trees), in the money creating process.
Link: “Changes in Wealth and the Velocity of Money”.
Changes in Wealth and the Velocity of Money (stlouisfed.org)
The past two months of increases in currency and demand deposits is best explained by a combination of macroeconomic uncertainty, falling interest rates, seasonal patterns, and a renewed preference for liquidity. This will tend to reduce the supply of funds and their velocity.
With Trump wanting to increase defense spending by $500 billion, I suspect it may have something to do with juicing GDP to bring down this Debt to GDP number.
Awfully hard to vote against military spending.
Just a thought
It isn’t hard to vote against deficit spending, which often leads to inflation. Libertarian has been on the ballot for a long time, and it will be there in the next elections.
Being “Libertarian” was cute when I was 19.
Well, some people don’t mind inflation but a fair amount seem surprised by it, or don’t like it. Do they not realize they are voting for inflation, or maybe they do but they would rather complain about it than vote for a balanced budget because that is cute or something.
1234
We will agree on the need for a balanced budget. It’s interesting that states need to have a balanced budget but not the federal government.
Just a service announcement
TurboTax 2025 is pretty buggy on the desktop this year.
A good trick is to restart it if it messes up on you.
I think some moron vibe coded it.
I noticed if you leave it open, it shows that you owe or are owed $0. There’s no way to fix it besides restarting.
I guess I’m gonna wait till TurboTax updates the software with a fix.
Their package for corporate taxes worked OK. I just finished those.
freetaxusa has worked pretty well for me in recent years. Haven’t started this year yet. Glad I no longer mess around with MLPs which issue K1s.
Yes someone “vibe coded” an antiquated tax accounting software from scratch instead of just ya know, pushing the same code with updated rule sets.
Y’all on here learn a term associated with negativity then start spewing it everywhere without thinking if it makes sense..
If inflation stays low, then the federal debt/GDP may not matter much. Look at Japan. And Japan is not the center of World capitalism like we are. What bothers me I guess is how polarized congress has become. US voters need to quit electing noisy one sided pinhead ideologues who do not know the meaning of compromise. If something does not change we could end up with some sort of partial dictatorship. When Augustus took over the Roman empire, the Roman senate still lived on, but without much clout. Trump is a shuffle in that direction.
But rates are no longer that low in Japan. The 10-year is at 2.12% and the 30-year is at 3.32%. Short-term rates are still low though, 0.75% with the next rate hike possibly in March or April taking it to 1.0%.
Am I saying something wrong in my posts?
Many seem to never appear?????
Yeah it’s called heavy censorship
Gore’s wife must be at it again! Lol
A Guy
1. You have posted 3 comments with this login. None of them were deleted.
2. When you reply to a comment from someone else, and that comment from someone else gets deleted, every reply to that comment, including yours, vanishes from public view though they’re not deleted. This happened to your prior comment in reply to someone else earlier today. I cannot check this normally, except with very recent comments that are still in my comment feed. I cannot tell you how many more times this has happened to you.
3. You have changed your login many times. Each time you change your login, your comment goes automatically into moderation for me to review. But all of them were released.
4. I checked by IP address, and none of your comments with other logins but the same IP address were deleted, none ever.
5. Bitching about moderation is one of the 7 deadly sins of commenting.
Probably you are saying something different.
In a room where everyone thinks the same, no-one is thinking.
Here is just a typical MAGA echo chamber.
They always are awaiting moderation. That’s the way it’s set up to prevent trolls from spamming.
Ranked in order of ferociousness:
(Least to most)
1) The Cookie Monster
2) Shrek
3) The Abominable Snowman
4) The Ugly Debt Monster
5 Wolfman, when you don’t RTGDFA
🤣❤️
Particularly Wolf if equipped with a Taser at Powell’s press conferences 😀
Downloaded the data from the US Treasury for the maximum allowed (April 1993). The curve looks like an exponential. Excel fits it as an exponential with an R-squared of 0.993.
Yep. But remember our society as a whole is impacted by the laws of averages. As George Carlin once said; “The average American is a land whale that doesn’t understand math and simply wants to go to the mall to buy sneakers with lights on them.”
Who needs education right?
To Mr. Wolf:
An open, full-throated apology to you from me – I am sorry.
“2. When you reply to a comment from someone else, and that comment from someone else gets deleted, every reply to that comment, including yours, vanishes from public view though they’re not deleted. This happened to your prior comment in reply to someone else earlier today. I cannot check this normally, except with very recent comments that are still in my comment feed. I cannot tell you how many more times this has happened to you”.
I didn’t realize this.
Increase taxes by 3% on people making between 75K and 85K, 5% between 86K to 90K and keep increasing by 1% in every 10,000 slab. That is the only way. Americans are not paying enough tax. For people making below 75K compulsorily tax them 5%.
Ram, please give more thought before proposing tax changes. By increasing 1% per every $10k interval, before reaching $10M income, one’s proposed tax rate (presumably income tax) would be 100%. That’s silly, goofy, dumb, etc.
I mean these people often speak approvingly of the 91% top marginal rates we had in the 1950s, so they may not be dumb, just ignorant.
Move to Virginia!
Blue chips lead stock-market retreat as Trump pushes tariffs higher in wake of Supreme Court loss
SPX -0.99% DJIA -1.42% COMP -1.11%
Stock market retreat is about AI fears, gov’t shutdown, impending events in the ME.
Portfolio reallocations underway IMO.
Without intending to sound foolish, we all know most everyone has done well in the market since Apr 2025. Readjustments are now playing out. I have been long in commodities for a while and have been doing nicely.
Part of the unintended upside to gov’t debt excess – stronger bets can be made vis some of the winners and losers.
The whole global geopolitical and financial system is resetting. Where it lands nobody knows – yet.
I’ve been tracking insider sales by some companies I’m interested in. Large insider sales, anecdotally, have been increasing lately in specific companies. A useful harbinger in context with other analysis.
Say what one might, I think Bessent knows what he is doing. At least he appears to be one of the few adults in the room.
Interesting times.
The entitlement of US citizens to a relatively unsustainable lifestyle is now inbred in society. To change it means hard changes must happen which cowardly politicians will not take on. There are only 2 ways to balance the books – increase revenues or decrease spending. On the spending side, what is “discretionary” may have to be enlarged. On the revenue/taxation side, I have always advocated for a flat tax for all – even billionaires. Although, there is as much a chance of that happening as landing a man on Mars this year under this administration.
“debt out the wazoo”–I like that
A flight to liquidity / safety. MMMFs to the rescue. Guess they ran out of rmp’s.
Wolf,
I went to the US Treasury site and downloaded the available Total Public Debt Outstanding data (from 1997). A plot of the data in Excel can be fit with an exponential curve [=4951000000*EXP(0.000194*B2)] with an R-squared of 0.993. Overall, this means it doesn’t matter which party is in power. Nonetheless, I wanted to check the magnitude of the deviation from exponential (positive-worse or negative-better). I looked at whether the deviation was larger or smaller from the beginning of their term to the end. Of course, this is too simplistic because it leaves out economic factors.
Magnitude of deviation from exponential:
Clinton (1997-2001): strong negative
Bush (2001-2009): flat
Obama (2009-2017): positive
Trump (2017-2021): strong positive
Biden (2021-2025): weak negative
Trump (2025-TBD): tbd
This is mostly just ‘fun with numbers.’ I don’t attach much, if any significance. Just something for a retired person to do.
Trump is copying George McGovern in handing out $1,000 checks to every newborn and even copying George W’s misguided policy of investing the printed money in the stock market. These policies ore moronic. They didn’t work for McGovern and they didn’t work for George W, and they won’t work for Trump.
Even though it’s long outdated and not easy to read, I’ve been reading Keynes’ Theory of Employment (since it’s free).
And it strikes me how much of what he says is exactly what the US is doing, even if the actual captains of the economy are using modern economics. I’m not even halfway through but the concerns that Keynes as, and his proto-solutions, seem similar.
Constantly increasing the debt (investment) to ensure consumption can increase to sustain full employment. Granted, K says that this is unlikely to be efficient at high levels of investment (and if debt is over 100% of the GDP, surely we’re at high levels of investment), but given how well America has maintained its economy compared to Europe, which K would call, sneeringly, “financially prudent”, it seems to have worked.
And being constantly frightened of reducing the debt (investment), since the debt is responsible for _so much_ employment, reducing the debt by any large proportion will reduce employment by a ton across the economy — or so K gives as an example. I recall that Wolf has said that this isn’t actually true for the US economy by the Fed’s estimates, but it strikes me nonetheless.
And setting up a stock market system where people are constantly encouraged to invest in companies via things like 401Ks, to ensure that companies will always have enough funds to maintain current employment and production. And an ad-based system dedicated to encouraging more consumption yearly.
I used to think the US debt was a problem, but these are just the principles that Keynes laid out years ago for ensuring full employment. So long as particular bets don’t go bad (2008, or AI), the debt ends up being essential, rather than a danger. It’s bizarre.
The political class looting our future tax dollars to line their pockets. In 2000 our debt was 5.6T over the first 211 years. The last 25 years they have embezzled $33T…