Gasoline & used-vehicle prices plunge, food inflation backs off for a moment, natural gas bills jump.
By Wolf Richter for WOLF STREET.
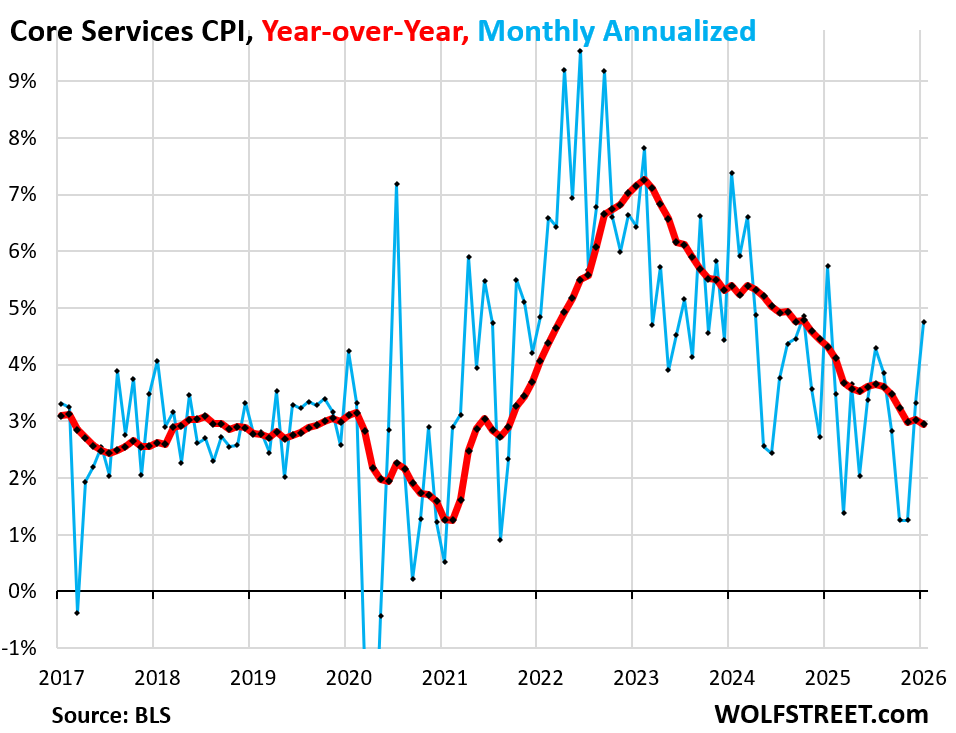
The Consumer Price index for core services jumped in January by the most in a year, seasonally adjusted. Core services dominate the Consumer Price Index and include many of the essentials that consumers cannot do without, such as housing, healthcare, and insurance.
But gasoline prices plunged, used vehicle prices plunged, new vehicle prices barely inched up, and food prices, after the surge in the prior month, ticked up modestly.
So the all-items CPI rose month-to-month by a benign looking 0.17% (+2.1% annualized) in January. But the core CPI (CPI without food and energy) rose by 0.30% (+3.6% annualized) and the core services CPI was hot.
Core services CPI jumped by 0.39% (+4.8% annualized) in January from December, the worst reading in a year (blue line in the chart). It accounts for two-thirds of the CPI basket of goods and services, and that’s where inflation ran hot.
Year-over-year, the services CPI rose by 3.0% (red). It continues to be pushed down by the CPI for Owners’ Equivalent of Rent (OER), which had been doctored for the September-November period. OER is the biggest component of the CPI basket, weighing 26.2% in overall CPI and over 40% in the core services CPI, and it moves the needle. I discussed these scandalously doctored months here.
In August, the service CPI rose by 3.6% year-over-year, roughly the same pace as in the prior three months. Then came the doctored months. By November, the year-over-year reading had reset at an increase of 3.0%, and that’s where it has stayed through January. Those doctored months produced a year-over-year downshift that will stick around through October.
The services CPI includes housing costs, medical care services, health insurance (don’t get me started), auto insurance, tenant’s insurance, subscriptions; telephone, internet, and wireless services; lodging, rental cars, airline fares, education, movies, sports events, club memberships, water, sewer, trash collection, motor vehicle maintenance and repair, etc.
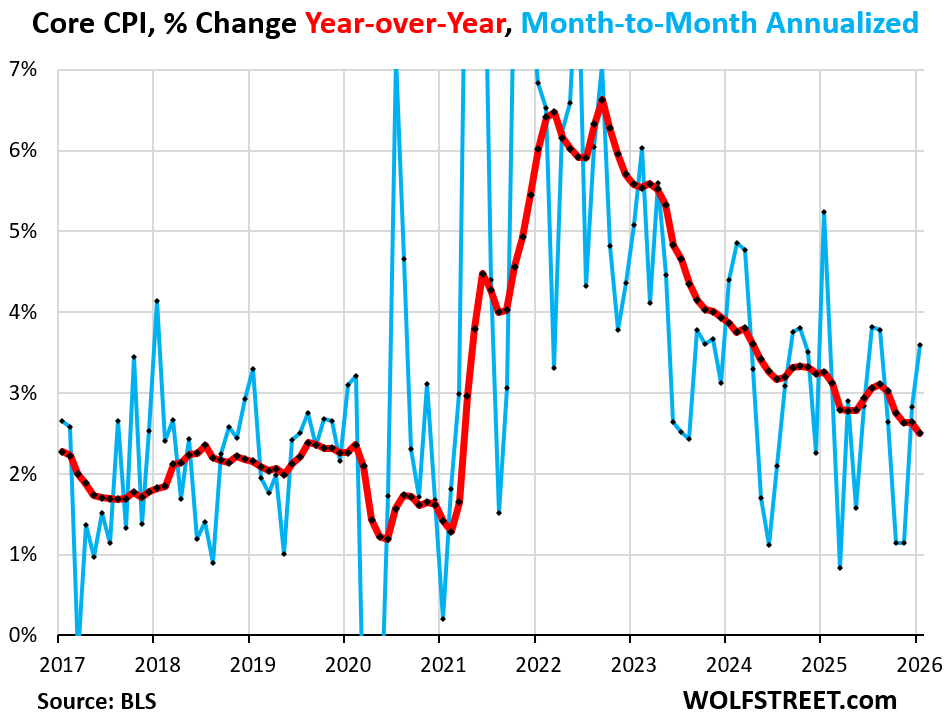
“Core” CPI, which excludes food and energy components to track underlying inflation, accelerated to 0.30% (+3.60% annualized) in January, the worst reading since August (blue in the chart below).
Year-over-year, “core” CPI decelerated to +2.5%, also pushed down by the months of doctored OER (red):
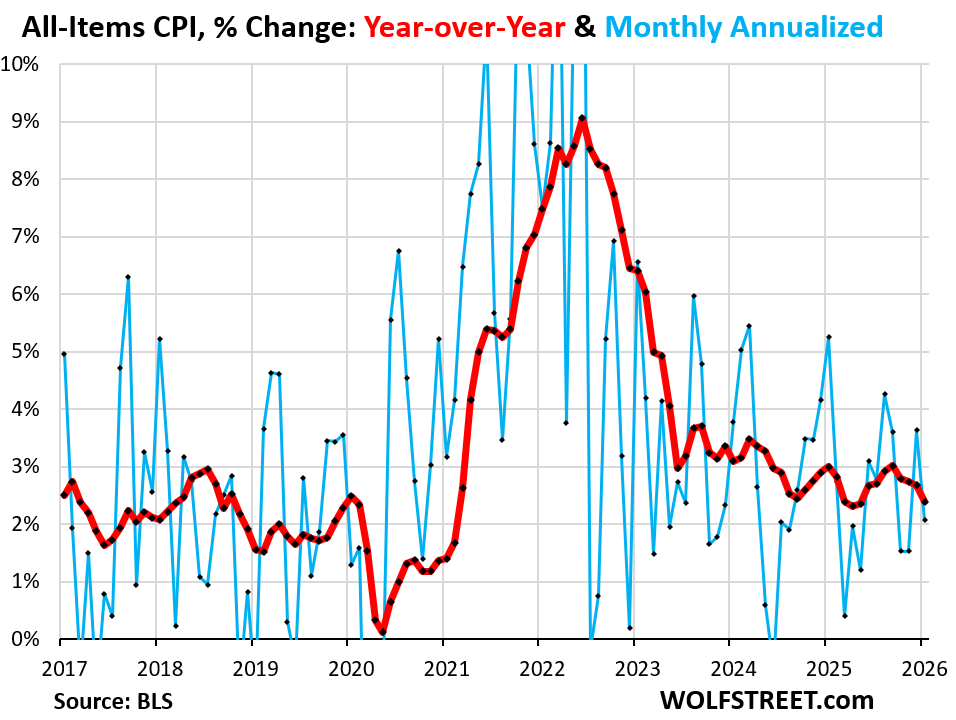
The all-items CPI, which includes food and energy, rose by 0.17% (+2.1% annualized) in January from December (blue in the chart below), as food prices barely ticked up in January after the surge in December, and gasoline prices plunged.
Year-over-year, overall CPI rose by 2.4% (red)
Some major components of CPI.
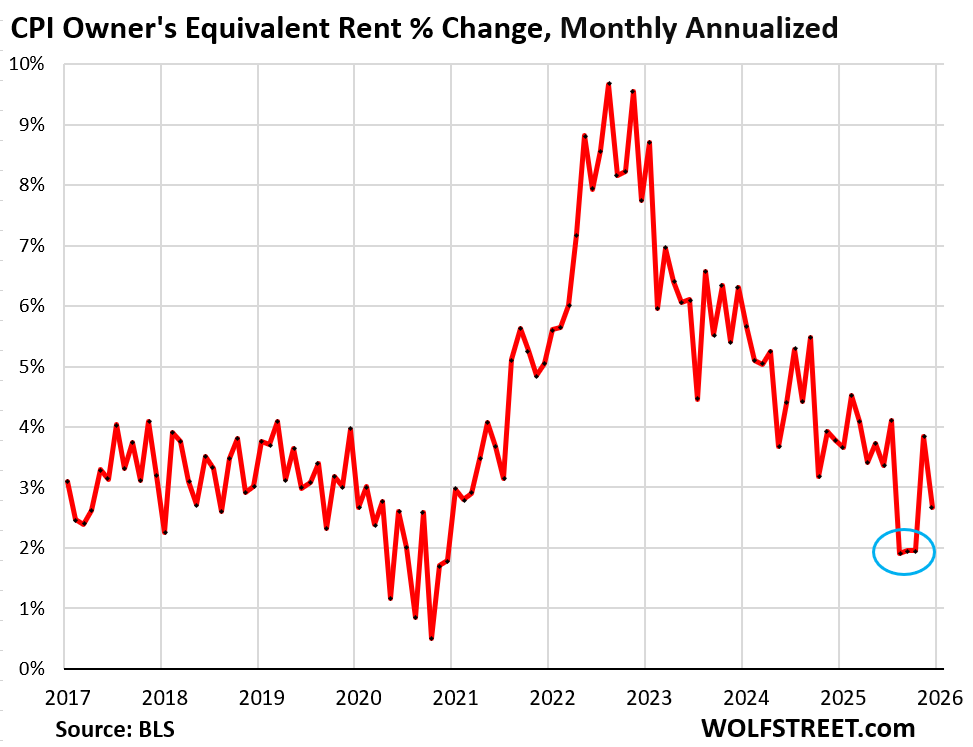
Owners’ Equivalent of Rent CPI rose by 0.22% (+2.7% annualized) in January from December. Year-over-year, the index rose by 3.3%.
OER is based on what a large group of homeowners estimates their home would rent for, with the assumption that a homeowner would try to recoup their cost increases by raising the rent. It’s not supposed to reflect rent, but the cost of homeownership as a service.
Homeowners experience a lot more inflation, but it is not reflected in CPI. The expenses of homeownership – homeowners’ insurance, HOA fees, property taxes, and maintenance – are not included in CPI, and OER takes their place. Those expenses have soared for many homeowners, and inflation is rampant in them, but obviously not reflected by OER.
OER accounts for 26.2% of overall CPI. The doctored months are circled in blue. It needs to be replaced with the indices that track the actual costs and inflation of homeownership.
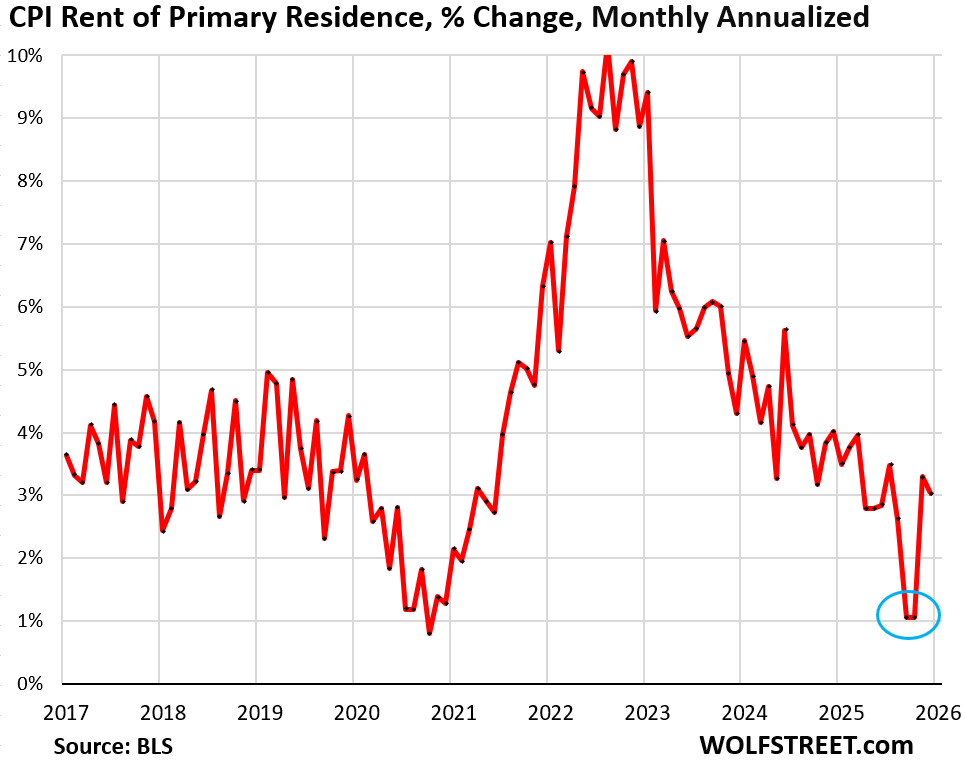
Rent of Primary Residence CPI rose by 0.25% (+3.0% annualized) in January from December. Year-over-year, the index rose by 2.6%.
It too got hit by freak figures for September that then got carried forward in the year-over-year readings.
Rent CPI accounts for 7.5% of overall CPI. It is based on rents that tenants actually paid, not on asking rents of advertised vacant units for rent. The survey follows the same large group of rental houses and apartments over time and tracks the rents that the current tenants, who come and go, pay in rent for these units.
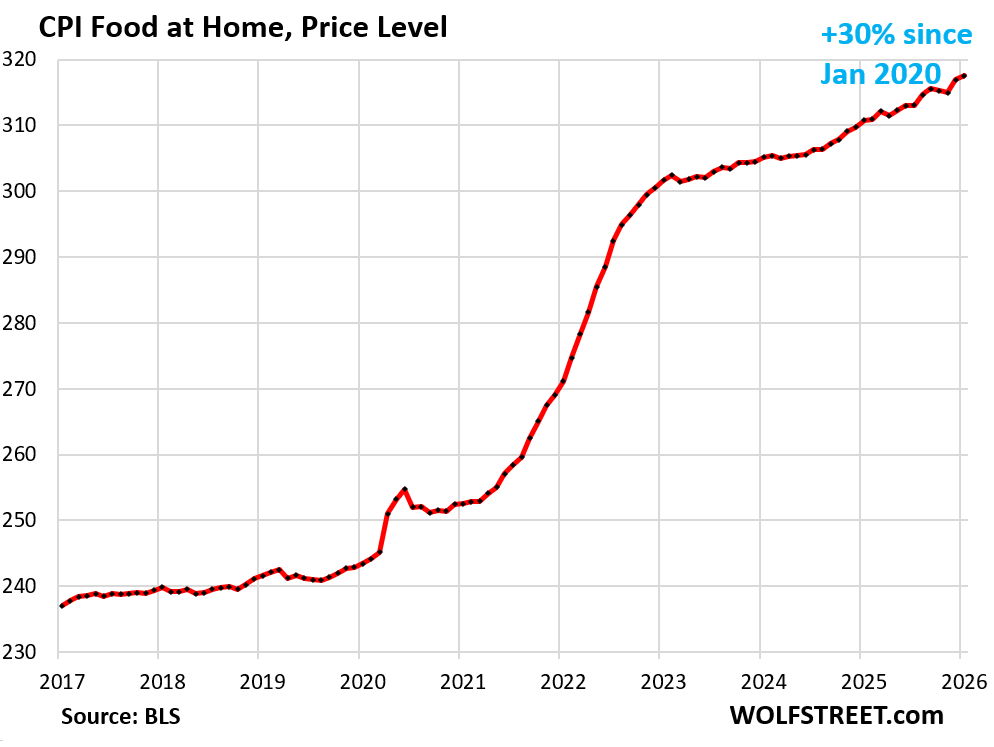
The CPI for “Food at home” rose by 0.2% in January from December, after the 0.6% jump in the prior month.
Year-over-year, prices rose 2.2%. Since January 2020, food prices have surged by 30%.
The chart shows the CPI for food at home as price level, not a percentage change:
Energy prices are a mixed bag, with gasoline prices plunging, natural gas piped to the home soaring, and electricity prices slowing their spike.
| CPI for Energy, by Category | MoM | YoY |
| Overall Energy CPI | -1.5% | -0.1% |
| Gasoline | -3.2% | -7.5% |
| Electricity service | 0.2% | 7.2% |
| Utility natural gas to home | 1.0% | 9.8% |
| Heating oil, propane, kerosene, firewood | -4.7% | -6.0% |
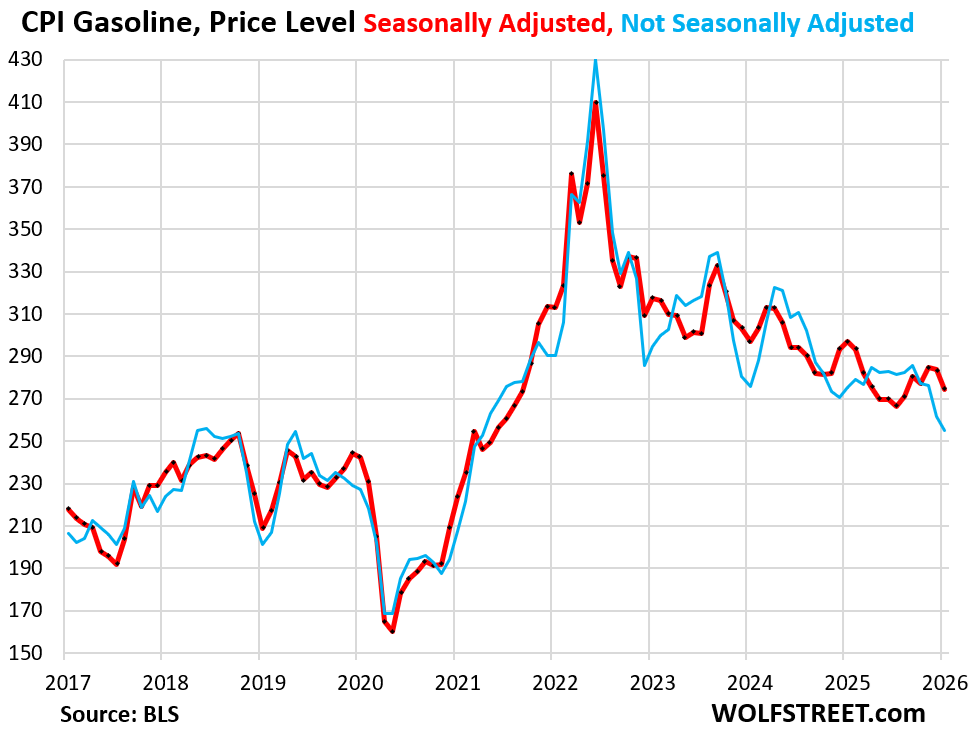
The CPI for gasoline plunged by 3.2% month to month, seasonally adjusted (red), and by 7.5% year-over-year, on lower oil prices that have been zigzagging down from their spike-top in mid-2022. Gasoline makes up about half of the overall energy CPI.
Chart shows the price level. Not seasonally adjusted prices in blue.
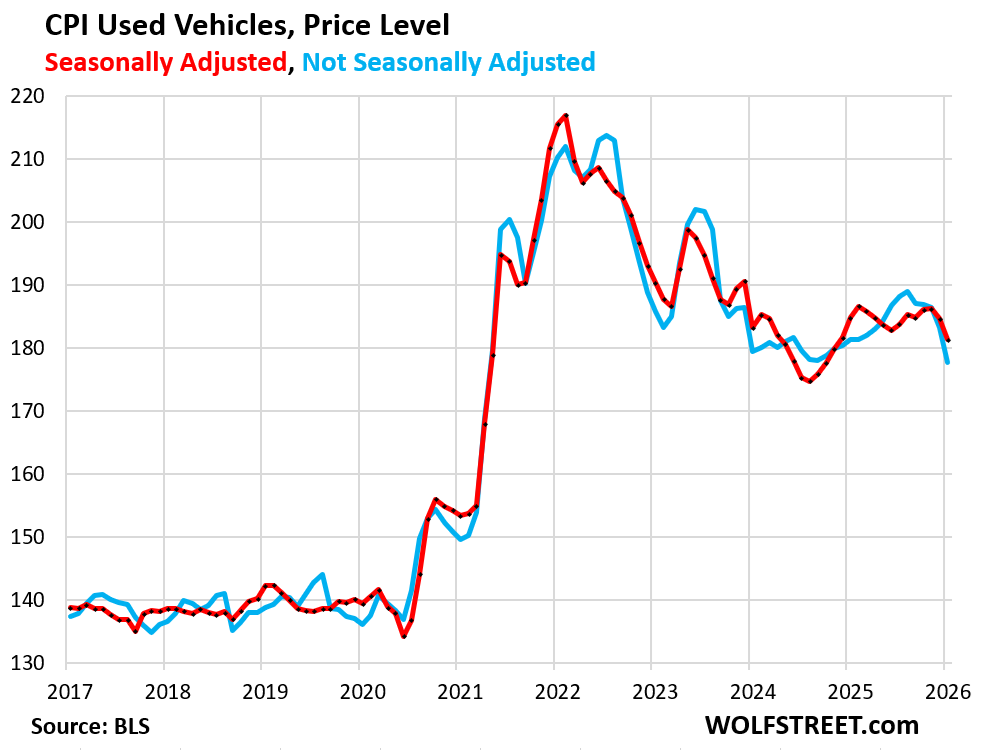
Used vehicle prices plunged by 1.8% in January from December seasonally adjusted, and were down by 2.0% year-over-year.
But the price declines may not run much further, as prices at auctions, where dealers replenish their inventory, have already started to surge again in anticipation of a huge tax refund season. Tax refunds make great down payments and big profits, and dealers are stocking up for it.
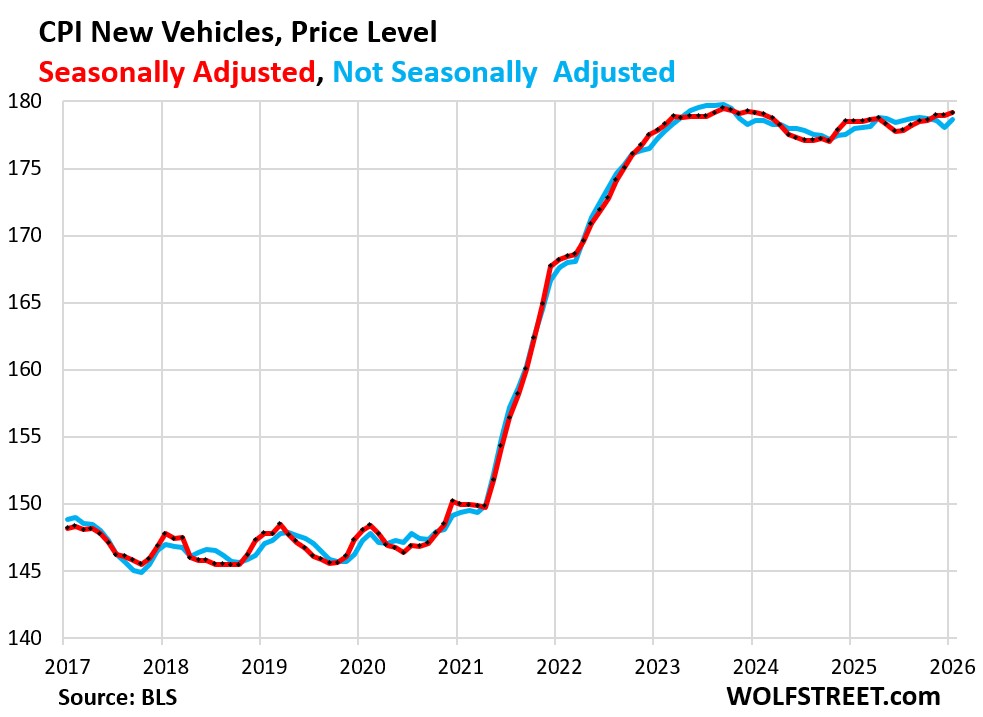
New vehicle prices ticked up by 0.15% in January and were nearly flat year-over-year. Prices exploded during the pandemic and then hit a ceiling as consumers refuse to pay even higher prices. In this environment, it’s nearly impossible to pass on any costs of the tariffs, and automakers have admitted to that when they announced their tariffs-related charges.
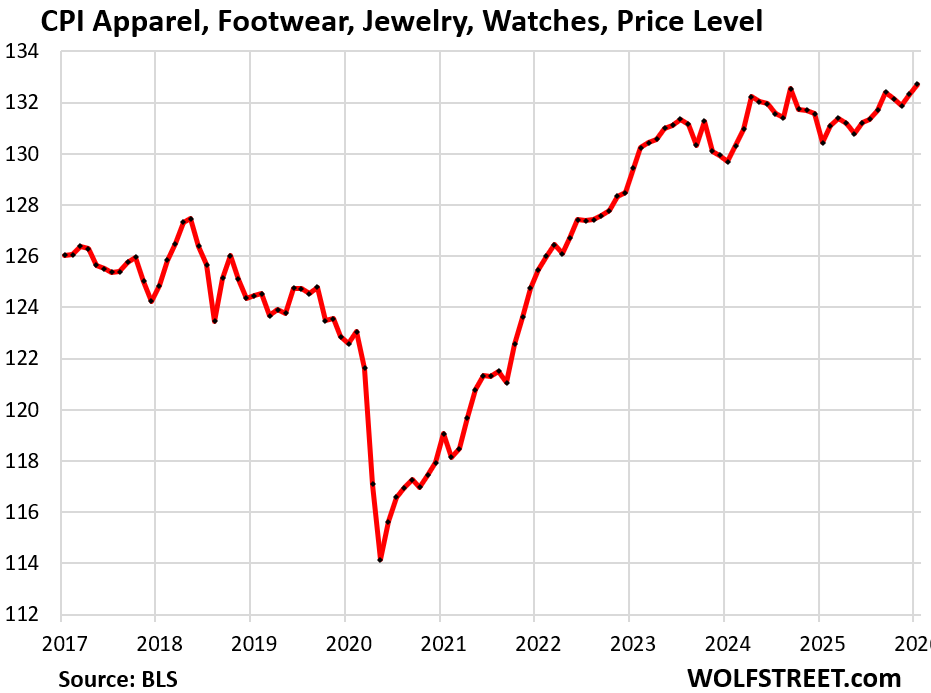
The CPI for Apparel, footwear, watches, and jewelry rose by 0.31% for the month and by 1.8% year-over-year. They are largely imported and tariffed, but the impact, if any, is minuscule.
The chart shows the price level (not the percentage change):
Enjoy reading WOLF STREET and want to support it? You can donate. I appreciate it immensely. Click on the mug to find out how:

![]()
Wolf,
I’ve reread this and your other article, but am still struggling to understand the impact of the doctored months of OER data. If a few months were artificially deflated with when there was no data, shouldn’t the first accurate month (December?) have a huge spike that accounts for all the inflation that was not included in previous months? I can see how this might cause some issues when these weird months eventually drop out, but don’t quite understand how we don’t have an accurate comparison to OER prices from on year ago.
No, because inflation is tracked by index values (price level), and then the percentage changes are calculated. And they doctored the price levels, and those carry forward for all times as new prices build on the old prices.
The index values (price levels) of OER are in the tables below in the column next to the dates. Then the rate of change (inflation) is calculated as percentage changes (month-over-month and year-over-year) from those price levels. And those price levels would have been higher if they hadn’t been doctored in Sep-Nov, and so the year-over-year percentage change off those higher price levels would have been higher. See the red figures.
The first table is as reported today.
The second table illustrates the principle. If OER price levels would have risen for Sep-Nov at the average of the prior 12 months (+0.33% each month) and then continued to rise at the reported amount in Dec and Jan, YOY OER would be +3.8% in January instead of 3.3%.
Wolf,
I get the math you are presenting, but aren’t rental price levels measured in absolute dollar terms (and any index would reflect this)? They can pretend prices didn’t go up for 3 months but when they calculate the price increases in December it should show a massive increase from the artificially low price assumed from the previous month? To what previous price level are they comparing the December equivalent rents to come up with the 0.32% increase?
The base effect is going to nail them next year, and I’m sure the excuses will be awesome.
Inflation is going to go thru the roof.
Some say Tips might be smart.
I buy the 5 year, they kinda are not great but at least the bond is short term. 2-4 auctions a year.
Barely any point in 5 year TIPS, unless we get a surprise pop in reported CPI.
I like 15-20 remaining years until maturity on them, but you have to be prepared for ugly MTM along the way since it’s a long bond.
Let’s see the points
1. Inflation protection on your Cashola.
2. Out of the market because might swan dive and I need some Cashola.
3. Some interest depending on how lucky you get on the auction.
4. No basis point fees by a fund
5. It’s a treasury so you can sell it until the union ends, and if the Union ends, well we’re all fahhh….kentuckyied! Ha
6. Not leveraged junk and not crypto junk.
7. Guranteed to get what you put into them back. Minus negative inflation if that happened.
So yeah there are some points to buy them. Low low risk. Versus what every junkey is hopped up on these days, leveraging spy and hoping for losses. Morons
To justify buying TIPS right now you have to be assured that the very same government that is paying you the inflation protection is accurately reporting inflation.
Unfortunately, there are concrete examples that the government will take advantage of chaos in order to fudge the inflation number.
TIPS do not offer up much inflation protection if the government is willing to manipulate inflation data.
Hi Wolf, can confirm cars that are 3-4 years old are hard to come by at good prices. Probably due to the lack of lease returns making it to the auctions. Pricing has been steady. However, cars that a year old, such as demo model 2025’s with some miles are killer deals. Big discounts on those. I don’t think a car is counted as “used” in the CPI unless its at least 2 years old?
A car is counted as “used” in CPI when it sold as “used,” no matter what the age. The BLS buys the used-vehicle data from JD Power.
if you sell a previously titled car as “new,” you go to jail.
Wolf, a question about the carry forward imputation. I’ve been keeping an eye on BLS’ published CPI imputation rates recently as you’ve brought this more to my attention. It is interesting to see October 2025 is wholly missing from their charts for both commodities and services (C&S) as well as housing. This makes sense, of course, if one reads their footnotes: “The Oct 2025 data values are not available due to the 2025 lapse in appropriations.”
But of particular note, on the imputation histograms and tables, BLS shows that no data is carried forward in C&S and the housing survey data doesn’t even have that option. Housing data is either “vacant” (unit is vacant so the data is imputed from non-vacant unit rents in the area) or “non-interview” (no one responded so the data is imputed from units in the area of similar class). So BLS is carrying September forward to October and just not reporting the carry forward? Or am I misreading their imputation histograms and tables?
Look at the tables I just posted above. You can see in the bold month-to-month changes what BLS did. September was an outlier low. It carried this Sep increase forward to October and November (though it left the Oct value blank but it shows up in November so we know what it did).
Wolf, appreciate the response and the hard data. I tried to find the data on the BLS website, but could only find the FRED graphs that reference the BLS website. If you have a chance, would you let me know where you found the primary data on the BLS website? I’ll keep digging so I’ll sure I’ll find it eventually. Thanks!
Download OER data here:
http://data.bls.gov/dataViewer/view/timeseries/CUUR0000SEHC
You can search the entire BLS data base here:
https://data.bls.gov/dataQuery/search
“Core services CPI jumped by 0.39% (+4.8% annualized) in January from December, the worst reading in a year”
This is what I’ve been observing. Notice the mainstream media has downplayed this increase for some reason. Wolf Street is the only site where this is being reported.
The Fed would be irresponsible if it cut interest rates with the economy hot and inflation increasing.
I’m pretty sure the doomers and gloomers will report this.
could also be called realistic, but their predictions don’t bring down the market until times get real bad. We’re due, but who knows.
I will admit a bit confused,we had a article a week ago saying used car prices going up and now one saying going down?
I this a regional thing like homes for sale,some areas up/some down?
On the upside my latest purchase last spring of a Olds Intrigue with a hair under 50,000 miles so far a winner,am really keeping up on maintenance and will send to a body shop(know owner)has very slight rust at rockers(no rot) and want cleaned up and painted,this car is a keeper and got for 5000.
I explained it in the article today about RETAIL prices when I said:
“But the price declines may not run much further, as prices at auctions, where dealers replenish their inventory, have already started to surge again in anticipation of a huge tax refund season. Tax refunds make great down payments and big profits, and dealers are stocking up for it.”
And I explained in the article last week about AUCTION prices when I said:
“Since the used vehicle CPI reacts with a lag to wholesale prices, the impact of the jump in wholesale prices in January, and going forward through tax refund season, will start showing up in the CPI in a month or two.“
James you gotta start the sentence with
“I got out my largest magnifying glass 🔍…”
Haha
Well,I think by the time the refunds kick in from taxes times will be trying enough that used car prices will fall,not sure what I would rather have but feel costs across the board getting too high and thus cars will actually in general be lower priced if one buys from a actual owner selling….,time will tell.
What is interesting is the Food at Home.
If you look at charts of grains and softs, most have fallen back to pre-2021 prices and the entire covid inflation effect is gone. Most of the charts look just like Wolf’s CPI rent chart.
Corn is down -45%
Oats -60%
Rice -40%
Wheat -60%
Canola -45%
Cocoa -70%
Orange Juice -50%
Sugar -55%
So why has Food at Home not dropped…at least a little?
1. You’re listing commodity prices. The commodity cost of wheat in a loaf of bread is minuscule. If you make a loaf of bread that contains 1 pound of wheat, just ballparking: 1 bushel of wheat = $5.50. There are 60 pounds to a bushel = $0.09 per loaf of bread. But you pay $5 retail for that bread. So if wheat plunges by 60%, it reduces the cost of wheat in the bread by a few cents.
The rest of the cost of a loaf of bread at the store: the costs of bringing all the stuff to the bakery, making it, packing it, transporting everything everywhere, until it gets to the shelf, lots of labor all combined, covering those costs and paying profits to everyone along the way.
2. the price of wheat has not changed much over the past two years. You’re talking about the 60% plunge from the mid-2022 spike. But that plunge was over by 2023. So in terms of month-to-month and year-over-year rate of change (inflation), that plunge is no longer in the timeframe.
Wolf, you state, ” Those doctored months produced a year-over-year downshift that will stick around through October. ”
So your saying through October 2026 , the CPI Inflation Data will be lower than what it should be , because of the of the doctored months of CPI OER , correct ?
How is the September – November 2025 CPI OER data, causing future CPI Monthly 2026 Data to be lower ? the reason i state this is because when they report Year over Year Inflation for January 2026, its comparing it to January 2025. The September – November 2025 Data would be out of the picture .
I just explained it in my comment above with the tables.
If I understand correctly, the missing data or doctored data will permanently lower the index because the index works as Wolf explained. One month indexes relative to the previous month. I guess actually they do this daily.
The remark about it will effect the data thru October is that reported year on year inflation will be wrong because of missing doctored data until October 2026. After that if there is no more doctoring the reported Year on Year inflation rates will be accurate, but the index number itself is still lowered for times more than a year previously by that doctored data.
So let us say we are looking back for year on year inflation in May of 2027. That will be accurate because none of the previous 12 months are doctored. However, if we were looking at inflation going back 2 years, the inflation for that two years is somewhat lower than reality because it would still include the doctored months from the fall of 2025.
Not suggesting any single person or group of persons have complete control, but how the economy is doing is completely secondary to having a strong stock market. That line of thinking dominates most political decision making in my opinion. Frightening to think of the short term bad decisions to prop up the short term but then again, that is the model here. Inflation is not desired but mostly baked into consumer thinking. A hit to investments such as 401 accounts and other investments, even those who own houses is not, especially with upcoming midterms.
Reading all the news headlines this morning, one might be led to believe that inflation is almost back to the target 2%, no worries, bring on the rate cuts. Having now read Wolf’s articles for about 3-4 months now (thanks so much Wolf for your analysis), I was sure the picture was not so rosy. Indeed.
But all those misleading headlines and articles! Surely others must be aware of this suspicious anomaly. Please tell me that the Fed board members are aware of this, because few others seem to be clued in. I think I have only seen one other article mentioning the suspicious OER.
Not that surprising when you look at who owns all that media and how much they spend. The media investments are minimal compared to controlling the narrative.
Just received my homeowner insurance bill for 2026 (Carlsbad, CA in north San Diego County). The insurance cost is up a whopping 31% from last year. The square foot replacement cost went from $324 per square foot (2025), to $434 per square foot. I assume this represents the greatly increased costs for both labor and materials.
Many homeowners in my area are having their insurance cancelled, so I may not be able to save much by shopping around.
I assume these types of price increases will be included in future OER figures.
“I assume these types of price increases will be included in future OER figures.”
No, and that’s part of the problem.
Thank you big good wolf
Can someone convert firewood to electricity to cancel out the electricity price increases? That’d be great thanksssss
Yep,look up Stirling Engine,that said,requires labor on your part.
Wood alcohol gennies might also be worth a look,depends on location/time to work it/desire.
Since Aug 2023 All Item CPI y/y are slanting down in a narrow band, under a supply line, in re-accumulation, reaching/ breaching the previous box between Feb 2017 and Jan 2020. When the breakout happen inflation can jump above 9.1%. TradingView: inflation [USIRYY].
The US is the world largest oil producer. If the Gulf states cannibalized each other oil can rise to $120/ $150, or higher. Foreign countries will have to buy oil from us, using dollars. Inflation will rise along with DXY. Inflation will deflate the US gov $40T debt along with RE.
Manipulated numbers…
All so that maybe when someone stated that he achieved the lowest in inflation in 150 years……. It might cause some cheers !
The rent is Too Damn High !!
Nice charts – they make it clear why rents and insurance still hit hard and everything ain’t perfect.
But this is a massive economy and CPI’s always had its challenges—like democrats closing the government.
CPI measures prices, not:
Economic output – UP
Employment levels – UP – Just added 130k jobs in January
Wage growth – UP
Productivity – UP
Corporate earnings – UP
Business investment – UP
Inflation – DOWN
If we rank economic indicators by long-term structural importance:
Productivity & GDP growth – determine national wealth.
Employment & income growth – determine household wellbeing.
Inflation (CPI/PCE) – determines purchasing power stability.
Financial conditions & credit markets – determine expansion sustainability.
Point is: the economy’s better today than before, trending right despite what one side pushes —Joe Public reacts to spin, not raw numbers.
And the tax relief from that OBBB? —more money staying home.
Good dive, but bottom line—what’s the takeaway beyond flaws or just playing in the weeds and reports have been flawed before – so what?
This doctored CPI will affect the midterms because it will not be flushed out of the data until after the elections. Regardless of political affiliation, this is BS and bad for everyone who expects reliable reports. Why can’t our elected officials do the right thing for us especially with fiscal constraint?
Data that impacts cola adjustments and payments on tips might be manipulated but at least….
Dow is over 50000 dollars 😂🥳🤦
I completely agree.
I assume it could also mean smaller COLAs for Social Security recipients next year as well
Yes, and it already did that for the 2026 COLA because the Sep CPI was one of the three months that determined the COLA.
Many gas utilities’ prices are regulated and it seems to take the public utility regulators several months to approve a rate change. In the four Midwest states that I had lived in, the gas utilities all offered balanced billing with payments being the same every month. The monthly payment only changed after the winter season ended. I guess fixed monthly billing doesn’t happen in other parts of the country.