My frustration is boiling over. This is very serious. A lot depends on halfway accurate CPI inflation readings.
By Wolf Richter for WOLF STREET.
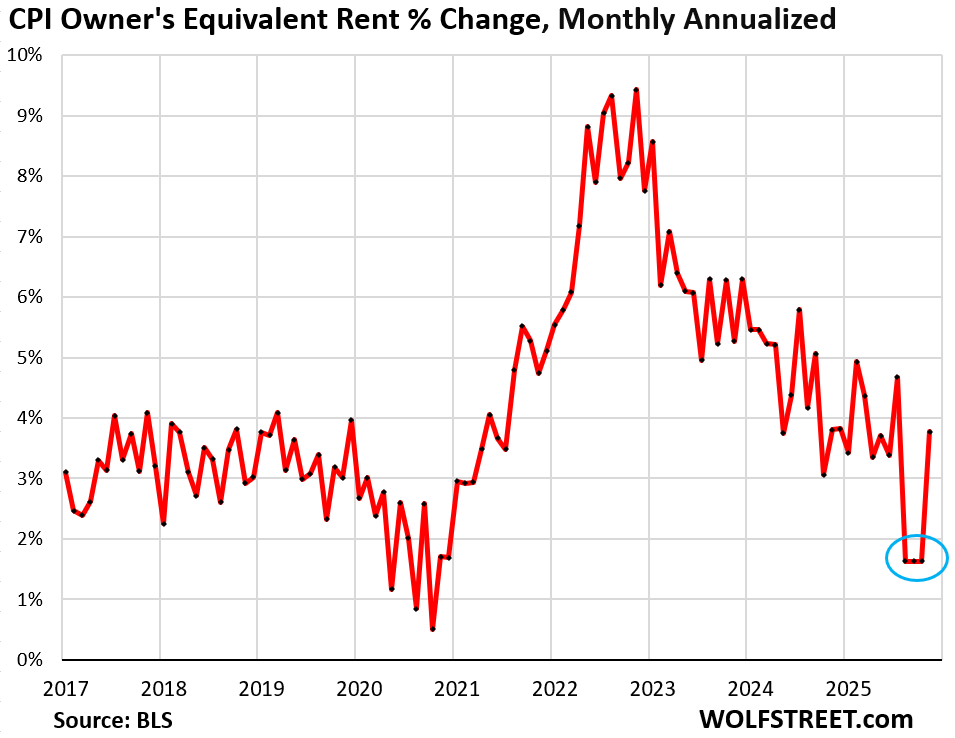
Today’s CPI report for December by the Bureau of Labor Statistics still didn’t fix the massive issues with the CPI for Owners Equivalent of Rent (OER), the biggest component of CPI, weighing 26.4% of the all-items CPI, 33% of core CPI, and 44% of core services CPI. And due to the unfixed issues in September through November, it continued to substantially push down year-over-year readings in December for the services CPI, core CPI, and all-items CPI.
The issue first cropped up for September, when the month-to-month increase of OER did a suspicious outlier-plunge. Then with no data for October due to the government shutdown and apparently no data for November either, the September outlier was carried forward through November, which substantially pushed down overall CPI.
The December index value for OER then jumped by 0.31% (+3.8% annualized) from November’s basement outlier level. BLS has apparently no intention of fixing the issues with the September through November OER (circled blue in the chart), and the year-over-year inflation readings will remain downwardly manipulated by this issue through August 2026.
A lot depends on halfway accurate CPI inflation readings, such as Treasury Inflation Protected Securities (TIPS), long-term commercial lease contracts with CPI riders, Social Security benefit levels for current and future beneficiaries…
Not to speak of the Fed’s monetary policy decisions, for which the Fed looks at the PCE Price index which uses the data from the CPI plus some data from the PPI, but with different weights and methods.
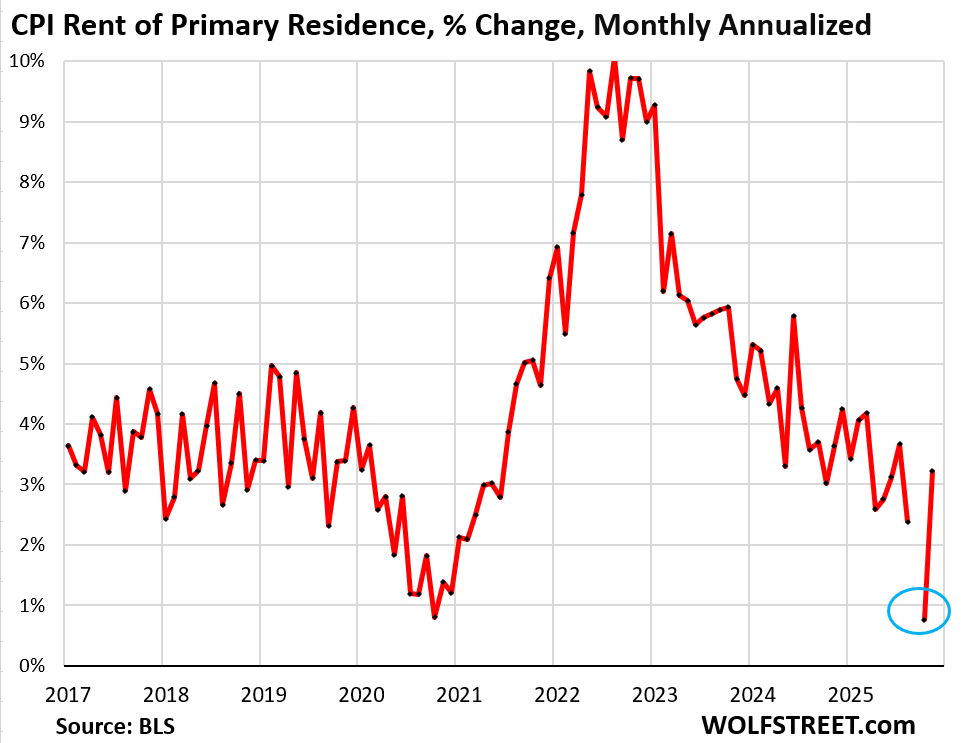
The CPI for rent of primary residence, which weighs 7.5% of the all-items CPI has a similar issue as OER, but not quite as bad since the outlier values didn’t start in September, but in October-November – for two months, instead of three months.
In December, the month-to-month increase was back in the normal range (+3.2% annualized). But the prior two months were below 1%, and unless fixed, they will continue to repress the year-over-year inflation readings for services CPI, core CPI, and all-items CPI through September.
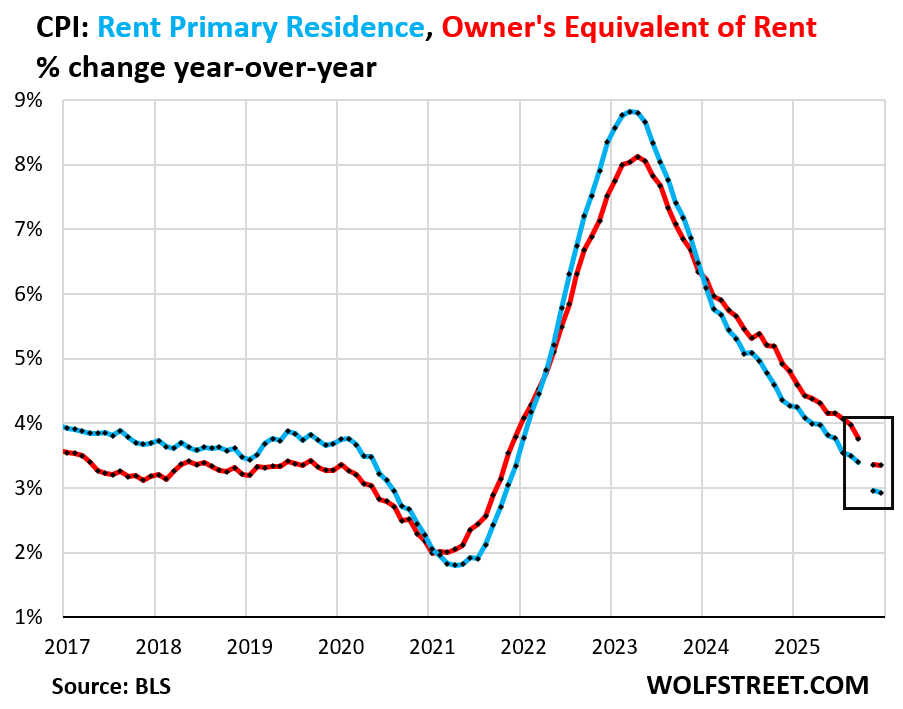
CPI for OER and CPI for rent of primary residence account for one-third of overall CPI, and will falsify the year-over-year inflation readings by a substantial amount through August 2026.
You can see the effect of the manipulation of the data for September through November on the year-over-year change for OER and Rent of primary residence – they adjusted downward by a sudden and large amount: OER adjusted downward from the August year-over-year change of +4.0% to the November year-over-year change of +3.4%.
The CPI for OER is based on what a large group of homeowners estimates their home would rent for, with the assumption that a homeowner would try to recoup their cost increases by raising the rent. It should indirectly reflect the expenses of homeownership as a service: homeowners’ insurance, HOA fees, property taxes, and repair & maintenance – which are not included in CPI otherwise.
The CPI for Rent of primary residence is based on rents that tenants actually paid, not on asking rents of advertised vacant units for rent. The survey follows the same large group of single-family rental homes and apartments over time and tracks the rents that the current tenants, who come and go, pay in rent for these units.
The chickenshit health insurance CPI.
The health insurance CPI manipulation has been repressing CPI ever since it blew up under the Biden administration. I called it chickenshit back in 2023 for those reasons. And it has gotten worse.
So now, the health insurance CPI:
- Month to month: -1.1% (-13.8% annualized)
- Over the 3 months since September: -3.9% in (-14.8% annualized).
- Year-over-year: -0.5%
- Since September 2022: -32%
- 0% health insurance inflation since February 2019
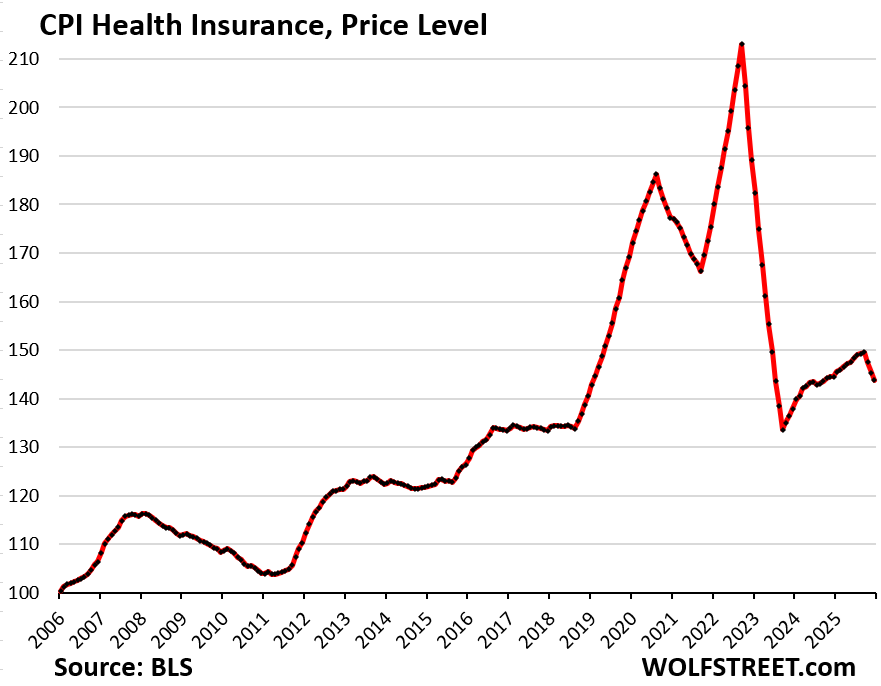
The chart below shows the price level of the health insurance CPI. It had spiked starting in 2018 to a peak in September 2022, which had been up by 28% year-over-year. At that point, the BLS declared the index had gone awry and tweaked it.
With the current manipulations, the index value is now back where it had been in February 2019, pretending that health insurance costs hadn’t risen at all – 0% health insurance inflation – since February 2019.
It is outrageous to present to the American people this kind of chickenshit index of a big and ballooning expense that plays such a huge role in Americans’ daily lives:
The problem with the health insurance CPI is that it doesn’t actually track any aspect of health insurance that consumers pay. It is based on the “retained earnings method” that tracks health insurers’ financial metrics.
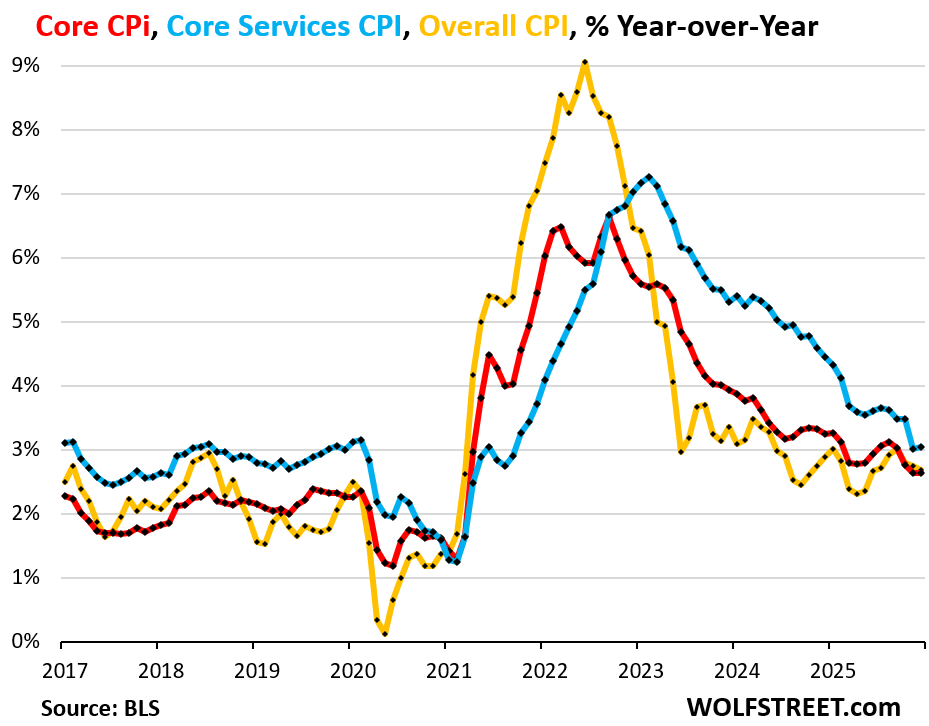
Core services CPI, core CPI, all-items CPI, year-over-year.
Core services CPI (blue in the chart below) accelerated a hair to +3.0% year-over-year in December after the massive deceleration through November, from August (when it was +3.6%). The manipulated-down housing indices account for nearly half of core services CPI. In turn, core services accounts for about 60% of the all-items CPI.
Core CPI accelerated a hair to +2.64% (red). It comprises core services plus core goods (not food and energy). It’s lower than core services CPI due to lower inflation in core goods prices.
The all-items CPI decelerated a hair to 2.68%, on dropping gasoline prices and accelerating food price inflation (yellow).
But the year-over-year CPIs are useless since they’re heavily skewed by the manipulated housing CPIs in September through November, and dogged by the health insurance CPI.
To fix this mess…
Abolish OER, increase the weight of the rent CPI to something like 15% of total CPI, and replace the remaining weight of OER (19%) with separate indices for HOA fees, homeowners’ insurance, property taxes, and repair & maintenance expenses. Canada’s statistics agency, Statcan, uses a system like that. It would still reflect the cost of housing as a service, and not as an asset price.
Scuttle the health insurance CPI method – the “retained earnings method” that tracks health insurers’ financial metrics. Instead, track actual changes of health insurance premiums, deductibles, co-pays, maximums out of pocket, drug formularies, benefits, etc. I know health insurance is complicated. But work with major health insurers, with a panel of companies that offer health insurance plans to their employees, and with a panel of consumers, and nail down the actual increases that Americans face – and they’re steep every year. Don’t tell Americans that their health insurance expenses have not risen at all since February 2019 – that’s just a ridiculous absurdity.
After the health insurance CPI is fixed and reflects the actual price increases consumers struggle with, its weight in the overall CPI needs to be increased to levels that represent the portion of consumer spending that goes into health insurance. Currently the weight of the health insurance CPI in overall CPI is less than 1%, which is another ridiculous absurdity.
Enjoy reading WOLF STREET and want to support it? You can donate. I appreciate it immensely. Click on the mug to find out how:

![]()
“And due to the unfixed issues in September through November, it continued to substantially push down year-over-year readings in December for the services CPI, core CPI, and all-items CPI.”
Hmm…intentionally unfixed perhaps….I mean how else are you going to continue the pressure the FED to lower rates again and again..
or just like KellyAnn Conway used to say….alternative facts baby….
Health costs are like auto repairs etc. ..crooked8
Wolf said The health insurance CPI manipulation has been repressing CPI ever since it blew up under the Biden administration. I called it chickenshit back in 2023 for those reasons. And it has gotten worse.
I agree. The unaccountable suddenly becomes de rigueur
I was waiting on pins and needles for this one! I saw they had “fixed” OER, but was sure the mathematical order-of-ops for getting to annualized data (just point-to-point Dec 25 vs Dec 26 for all contributions, then weighted into annualized. Or what it appears they do, some cumulative math around the prior 12 months M-o-M inflation.)
Thanks for clearing up.
The health care is insulting to the American people. Both premiums, deductibles, and out-of-pocket maxes are clearly significantly up since 2019.
The graphic I saw that broke down inflation since 2000 shows “hospital services” looking parabolic in recent years. (From the visual capitalist).
It also topped the chart, followed by higher education, child care and then “medical care.” The medical care line has a strange “plateau” at the very end: GREAT, again?
And who funds all those industries? Not private payers……..
The health insurance metric is absurd. Isn’t the purpose of the CPI to look at things from a consumer perspective?
Probably more effort goes into tracking the price of eggs, which might be one-tenth of a percent of the average household’s spending.
If you are distracted from what matters, the strategy is working!
Yes of coarse that is an accurate question posed by a naive general public struggling to make ends meet
Daniel L. Thornton, May 12, 2022:
“However, on March 26, 2020, the Board of Governors reduced the reserve requirement on checkable deposits to zero. This action ended the Fed’s ability to control M1. In February 2021 the Board redefined M1 so that M1 and M2 are very nearly identical. Consequently, it makes little sense to distinguish between them. In any event, the checkable deposit portion of M2 cannot be controlled now because there are no longer reserve requirements on these deposits. Here is the reason the Fed cannot control these deposits.”
Some Thoughts About Inflation and the Feds Ability to Control It.pdf (dlthornton.com)
Can you estimate the true yoy cpi if the modifications you suggest are made?
Anyone can estimate it. Results may vary. People come up with all kinds of crazy stuff all the time. But coming up with a system to replace OER and with a health insurance CPI that actually tracks health insurance expenses for most Americans halfway accurately is a very tough undertaking, requiring lots of really smart people, and the cooperation of many companies (corporate data). But that’s what a government agency is for. This is not the job for a guy sitting at a desk. Health insurance is immensely complicated because each insurance company offers different plans in different states to different employers and people, and they’re so many aspects to health insurance.
Isn
t that reason enough for national one payer healthcare coverage?
Clearly yes Lydia, and about time, or waaayyy past time…
But, ya can’t take away the rice bowl from SO many folx, eh?
Turned out that enlisting in US Navy was one of my best ”life decisions.”
A public option would be a great start
@VintageVNvet,
(Turned out that enlisting in US Navy was one of my best ”life decisions.”)
Can you explain?
Perhaps a stupid question, but;
Couldn’t they just get the numbers directly from the companies providing the insurance who are already pricing it?
Not a stupid question. BLS is already buying lots of corporate data, including cash register data and all the new and used vehicle data. And it is trying to buy more corporate data. This works very well. But with some industries, this is immensely complex to set up for a long list of reasons, such as getting companies to cooperate (each company has to be signed up and vetted) and give up that info, privacy issues, and massive data issues since each company uses its own data system, and BLS has to integrate all this into its own database, and in terms of health insurance, a vast array of insurance products that vary by state. So BLS will have to combine all those different data systems into its own data base. These are mindbogglingly huge issues.
To paraphrase the immortal words of Jean-Claude Juncker (sp?), “when it gets serious, you have to lie”
I think the problem with health insurance in this metric is that it is typically a YOY increase and generally the enrollment period is November-January so price changes throughout the year are negligible. That being said, they could easily produce accurate data in the same fashion they produce employment numbers. Payroll processors have access to the bulk of costs and the changes when they occur. The privately insured could be extrapolated from survey.
There are many services that renew annually, including rents. BLS generally knows how to deal with annual renewals.
“they’re so many aspects to health insurance.”
Absolutely true…but also a moment to reflect upon the foundation-level craziness of a “health care” system (perhaps 20%-22% of creaking GDP at this point) that has long had everybody heavily focused on the insurance component more so than the actual underlying medical cost component.
And despite some significant efforts (I won’t say “results” yet), medical cost transparency is still a nightmare that transcends even the med insurance nightmare (in fact, it heavily contributes to the med insurance nightmare -> lower base costs, less insurance pricing pressure/excuses/justification).
I say this as a long term self-pay patient who has witnessed first hand the calculated madness, mendacity, and manipulation of the “health care” system. Things have slowwwly improved over the last 25 years (quarter of a century…post internet).
The absurdity/obscenity of the system is that we have had a truly massive national level med system admin infrastructure (medicare/medicaid) for over 60 years.
And yet, for the majority of that time, the primary emphasis of that enormous infrastructure was to pump more and more hundreds of billions into the healthcare industrial complex – versus measuring/tracking treatment effectiveness…and therefore aiding cost control.
The insurance companies may very well be bastards…but they aren’t the primary ones.
Talk about chickenshit! COME ON WOLF GIVE IT A TRY!
Obviously better numbers would paint a better picture and could lead to better policy decisions but in the end the majority of people will continue to believe what they feel or perceive to feel with finances. I’m sure the low approval and trust ratings of politicians translates down to almost anything the government publishes. I’m sure most Americans believe the government will do what it sees is in its best interests of it and its donors at the expense of tax payers. Not like there isn’t a dozen solid examples just in last few decades.
I work in state government where when software projects don’t just completely fail, they simply redefine the definition of success and pat themselves on the back. I don’t see any aspect of government any differently.
Data accuracy is obviously important. The definitional, technical and collection/”curing” issues all need to be squared away. Whether better policy emerges, on the face of things, is debatable. Everything in our society has become politicized to the sixth sigma end of the spectrum.
Causal analysis is a different thing altogether – both for healthcare and insurance. Extremely complicated. More so when trying to model human behavior.
I think the sentiment has to do with the bifurcation in consumer spending. Delta airlines is talking about huge growth in premium seats and contraction in coach. So it’s not exactly surprising that inflation numbers are tepid. 8 guys can’t afford a vacation and the 2 guys who can travel fly first class with no limitations on price. In many ways we lived through this stage of capitalism in the early 1900s and we are living through it again. It took union strength and monopoly busting to dig the country out of it.
What Delta is saying is that more people have more money and fly business class when they used to fly economy.
Wolf, I’m attempting to be more informed economically and have enjoyed reading your perspective. I was hoping you could comment on the CPI’s increased different cell imputation rate, which I just learned about recently this past semester. I couldn’t find mention of this on your website. Apologies if I missed it. The data is here: “https://www.bls.gov/cpi/tables/imputation.htm”
What’s your perspective on the different cell imputation rate increasing over the past year or so while the home cell imputation rate has decreased in turn? Is this part of a concerning trend, e.g., cherry picking from a different cell? Or much ado about nothing, e.g., BLS doesn’t have the manpower it used to and is just doing its best? Thanks!
I talked about it at length in this article: It’s what they did with OER’s missing data for October and November: They extended the outlier month-to-month increase in September to October and November. Same with the rent CPI.
Interesting post – yours. BLS explains their approach at
slash cpi slash tables slash imputation dot htm
Not trying to evade controls wolf. I left out the obvious part.
Excellent reporting. Classic case of cooking the books by those at the top.
Insurance is the biggest component of my budget. My auto, home, and health insurance have steadily increased and is noticeable. The cost to home and auto repair keeps going up and up. Healthcare costs aren’t dropping. Consumers know and will vote with their pocketbook even if the data is manipulated to look better. Couple this with threat to Fed independence, Republicans need to worry about the midterms.
No they don’t.
There’s a long chain of causal analysis behind all of this that didn’t just materialize since Jan 20.
Wolf is challenging the technical practice employed and questioning the value of the product – and proposing an alternative approach. This a core problem in statistics that everyone in the field wrestles with.
My insurance costs, HOA fees all have also ratcheted up – a lot. That longer term trend started in 2020 – around the time Covid graced all of us.
The argument over FED Reserve existence could really stand a principled debate.
They need to be more aggresive about adjusting the weights, with periodic (annual? Biennial?) revisions.
Weights are adjusted EVERY month based on how much spending goes toward that good or service.
Don’t you understand that Powell, Yellen and yes, Biden all used the COVID “crisis”/shutdown to intentionally engineer this inflation impulse?
Of course they lied/denied.
This inflationary impulse was needed to reduce the nominal value of US debt. Prior attempts with QE didn’t put the money in the spending public’s hands and thus only inflated assets; not real prices. This inflationary inpulse (30% loss of purchasing power +/-) has been very painful; especially for the lower K in the economy: Their ability to get sufficient wage increase to match cost increases is notable weaker than the top K economy who have better paying and in some cases, have-to-have jobs.
Powell wants to limit the ongoing inflation because he is a decent human being and knows how much this impacted the lower K.
The scary part is that Trump and Bessant want to run the economy hot, even at the expense of inflation running higher. That shows you how serious they consider the situation with US debt. And they will lie and cheat with statistics as Wolf has so clearly pointed out.
As you can tell, I don’t think these CPI “errors” or “weaknesses” are necessarily an oversight.
Not to mention 5 years of no student loan payments. Good cop, Bad cop
That is silly. Every single 1st world economy has a central bank. You would have to make a very strong argument to even open up debate about the FED which you will not be able to make.
Why should the U.S. eliminate the FED when there is such an extremely strong correlation between having a central bank and being a prosperous nation?
Do you think it would be better to go back to horses and buggy whips instead of cars?
Especially when the central bank in question is the US Federal Reserve Bank who’s principal responsibility is too insure that the dollar is the worlds reserve currency.
“Health insurance” is less than 1% of the CPI. It includes the cost of “insurance” but not the cost of actual medical services. BLS says that the total weight for “medical services and commodities” (including insurance) is 8.273%
And yet mysteriously it accounts for 18% of GDP.
Good one Kent, far damn shore!
Some of us in the biz of analyzing and predicting ”costs” of construction and other similar long range projects have seen Very Clearly for many years that all, or almost all GUVMINT ”statistics” have been lies or damn lies…
NOT new, as WE, in this case those entrusted by owners of companies to predict the possible profits of projects up to the multiple $BB level have burned the midnight oil to do our best for those owners who respected the challenges and were at least somewhat well informed…
IM now VHO, the next few years are going to be at least as challenging as those times when ”quotes” for steel, rebar, fuel, etc., etc., to be used at bid time were certified to be good for 24 hours ONLY…
Try to conceptualize that, against a required guarantee that the bid would be good for at least 30 days…
Kent,
Nonsense. Health insurance doesn’t account for 18% of GDP. Overall “healthcare” accounts for 18% of GDP. Google this stuff up before posting.
Overall healthcare includes insurance plus all medical care and medical care products, paid for by consumers, companies, and governments. The amount that companies and governments spend is not included in CPI, and that’s a huge amount that includes Medicare and corporate healthcare spending.
“BLS has apparently no intention of fixing the issues with the September through November OER (circled blue in the chart), and the year-over-year inflation readings will remain downwardly manipulated by this issue through August 2026.“
How convenient.
With the White House claiming they will be purchasing $200B in MBS, could the Fed simply sell $200B in MBS in an attempt to neutralize the White House’s efforts?
The purchases by Fannie Mae and Freddie Mac of $200 billion in MBS does not involve money creation. They’ll be buying more MBS instead of more Treasuries. That started months ago. It might reduce the spread between MBS and Treasuries, but it might also raise Treasury yields, which would reduce the effects of the narrower spread. This may not have any real impact long-term.
But this is exactly what Fannie and Freddie did before the Financial Crisis, which caused them to implode when mortgages turned sour.
Yep. Talk about being set up to fail.
This is why Fannie and Freddy may never be privatized, despite Trump’s promises. They offer the president a direct way to control bond yields – at the risk of blowing everything up. Bond yields influence economic growth in the short term, and inflation in the longer term. So bond yields can be suppressed right before a midterm election year, especially by a 79 year old lame duck with nothing to lose. The economy will overheat and inflation will start showing up 3-12 months later. But by then the next election is over and Americans already cast their ballots based on how the stock market was doing.
And BTW, here we are starting Trump presidency year 6 of that promise to privatize the GSEs not being delivered. Your article on the subject some months ago was spot on. They couldn’t survive on their own without a guarantee even if the govt privatized them. I think anyone in FNMA or FMCC should cash in their chips and let the true believers have the shares.
That’s okay. The President declared the “Trump economic boom” and told us that prices are down. I saw it on Fox News and I’m edumacated so it must be true!
the GSE’s have a legal limit of $450 billion in mbs, and this $200 billion will get them to that limit, so not sure it can be a tool of unlimited efficacy.
“the GSE’s have a legal limit of $450 billion in mbs”
I think it is pretty clear that what is legal no longer matters.
It seems that the same lax regulation that led to the collapse of monthly payments as the proximate cause that instigated the greatest swindle in human history
Fannie Mae has just introduced a new URAR form that RE appraisers will have to use to appraise simple single family properties. This will double the time that appraisers have to put in for the same fees charged. We are now under a form of wage controls that rivals the Nixon/Burns/Connaly wage price controls of 1971. RE appraisers are quitting in droves. They are are working for sub-minimum wages. Along with continued uncontrolled regulation at the State and Federal level, this is another example of how no matter who is in the White House nothing has changed.
The White House wants to push 50 year Mortgages to make housing more affordable. Also they want to freeze credit card interest rates at 10%. Buying more MBS is another mistake. They should be doing the opposite. Who is the moron that is advising the President on these bonehead measures. They will all fail. Next, look for wage price controls and easier money at the Fed. Arthur Burns has risen like Jesus from the dead.
Pulte already backpedaled and said the 50-year mortgages won’t happen.
Aside from the fact it’s an outlier, why do they duplicate a single data point to fill in missing data? Is that standard practice in someone’s line of work? I’d interpolate.
My concern is that the dollar will lose it’s singular advantage as the wotlds reserve currency
Amusing (not). Earlier today I was looking at Medigap rate increases recently filed with Arizona Department of Insurance. The filing I was looking at used a 12% per year annual premium increase assumption going forward. It did not seem unrealistic considering that the company increased ACTUAL premiums by an average of 11.5% per year for the last seven years. This was not an outlier, other filings I saw showed similar histories and projections.
Which is proposterous
Based on what Wolf says in this article, would someone like to venture what the correct YoY CPI-U for December would be (should be)?
Sorry, at the time I wrote this the previous question and reply by Wolf hadn’t been posted yet.
Likely in range of 3.25%…maybe as high as 3.5%
Is it any wonder that our social fabric is fraying (and not at the edges but in the center), when the Federal government gaslights the public at every opportunity? I believe the proper term, as coined by Emile Durkheim, is anomie.
Another proper term, as discussed by a couple guys with impressive beards, would be “class war.”
Only the feds?
Those who expect too much from government deserve to be disappointed.
“So if you want the truth, go to God, go to your gurus, go to yourselves, cuz that’s the only place you’re ever gonna find any real truth.”
-Howard Beale, Network(1976)
And scripture is practically free, too. You can buy the books for a dollar or two at the thrift store or read at the touch of a button on many websites. Most read books of human history. Nothing else comes close.
This was always going to be the path when they made the choice on bailing themselves out in 2008. The people who run the country are clever, but they aren’t wise. Then again maybe they want all this. They’ve certainly been trying their best to get people at each others throats. When you aren’t evil, its hard to perceive how evil people think. Though we’ve had a master class since the early 2000’s.
“In the physical world, there are constants that serve as dependable benchmarks against which to observe natural phenomena. Examples are the velocity of a falling object, the freezing point of water and the time taken for one rotation of the earth on its axis. In the economic and financial world, this degree of precision is lacking. Instead, we content ourselves with approximations, indices and averages. We pride ourselves in knowing the difference between an inflation rate of 2% per annum and 2.5% per annum. Small deviations of outcomes from expectations can trigger dramatic trading in financial instruments and result in the transfers of billions of dollars between investments. Yet, in the financial realm, can we really be sure of the value of anything?” — From Peter Warburton: The debasement of world currency: It’s inflation but not as we know it
Are you sure?
I thought only the speed of light is constant. Everything else is relative to where the reference grid is planted.
Economics is a “soft science.” Modeling the behavioral decisions of humans doesn’t appear to be susceptible to immutable mathematical laws – especially over the long term.
Economics is not a science at all. There are no immutable laws. “Supply and demand” comes close, but it can be perverted. Demography has an immutable law: in a given area, population growth = births – deaths + net in-migration. But that is more like biology, which is a science.
Oh contraire kimosabe, economics is not a science in the sense of that Chemical Engineering equilibrium has to be measured
Its not as if demography has an immutable law
That was my point.
Yes but each one of those physical metrics should be viewed as temporary rather than absolute
One has too consider that in order for aliens to arrive on earth they obviously can travel much faster than the currently accepted as the physical limit. the speed of light, 186000 miles per second
Right, but: What’s a few hundred basis points between “friends”?
Retired since 2018. My 2019 Medicare Part B premium was 135.50/mo, my deductible was 185/yr. My Part G supplement health insurance was 110.45/mo. My 2026 Medicare Part B premium is 202.90/mo, my deductible is 283/yr, my Part G supplement health insurance is 165.27/mo.
That makes Part B premium up 49.7% since 2019, deductible up 53%, my Part G supplemental is up 49.6%. Bald face lies by BLS on these health costs, let alone any eye or dentist or drug cost increases. This is getting old fast.
Charlie – Agree…was updating my 2026 monthly financial spreadsheet today… Part G supplemental up, IRMMA up same as you – 202.90 mo, went backwards this year.. Plan to challenge IRMMA when the 2025 tax return is filed…
50% is a good guesstimate for the inflation in healthcare.
50% over 5-6 years would make sense.
10% increase in my policy cost from 2024 to 2025. 20% increase in my policy from 2025 to 2026. Same policy. High deductible brand name insurer. So for me, over a 30% increase in two years. Total premium cost for 2 people – $2400 per month, over one-third of my budget.
All models are wrong, but some are useful. This sounds less useful.
You have great suggestions on how to improve the CPI. They are understandable and each would take lots of time of well trained BLS staff.
I ams sure you are aware that since January 20th much of that staff has been “retired” or fired. Many of the most experienced staff is gone.
Medicare B went up 10% in 2026. Medicare has a committee that decides premiums. Yet as it pointed out, the Medical CPI is quite different. Part B Medicare premiums should be forced to use the Medical CPI. Then Medical CPI will be fixed or Medicare goes broke.
I nominate Wolf Richter for head of BLS. I nominate myself for second in command. We could fix this statistical mess, but I am pretty sure if we were honest about it, we would be arkancided.
No thanks! You take the top job. I don’t want to get indicted if CPI comes out hot.
But you would be able to give press conferences and when reporters ask stupid questions you’d be able to zap them like you recommended Jpow to do.
@thurd2,
The job is likely not as fun as it sounds. Let’s just say that the book, “How to Lie with Statistics”, is for amateurs.
I nominate Depth Charge as the new chair of the Federal reserve. His 1st task on day 1 will be to fire all 400 PHd (Piled high & deep) economists on the Federal reserve staff.
His first task on day one would be to stay alive.
“Currently the weight of the health insurance CPI in overall CPI is less than 1%”. At least this means the misrepresentation of the cost of insurance isn’t having a material impact on the inflation data that the market is fixated on.
Our CPI has turned into something you’d see in North Korea. Why not just get rid of CPI altogether? This is why gold and silver are shooting the moon. Naranja Jesus wants to turn the US dollar into toilet paper by faking CPI and hammering rates back to zero. Viva platano republica! The US is finished.
Gold and silver are experiencing a severe manic speculation episode which will not end well at all and which is decimating the jewelry industry.
Let’s decimate the data center/AI/crypto bubble instead. This sham can’t end soon enough. It is the biggest waste of natural resources in the history of mankind.
I agree with the sentiment. Though I think the biggest waste is probably the logging of whole countries for wooden (war) ships that are now rotten and forgotten.
Whole countries lost their topsoil and haven’t recovered in centurys or even millenia. (Whole adriatic coast is eroded beyond recovery)
The most direct damage of the AI/ crypto mania is in mining which is devastating locally but more or less concentrated. The longer term damages via climate change will be unknown for quite some time and depend a lot on how much energy they are able to waste until they implode.
Philosophical question:
Is purposeful destruction really the same thing as waste? Maybe this is why economics is called the dismal science. The answer to any question always ends up being something worse than you would ever want to imagine.
Depth Charge Gold and Silver shooting to the moon
More money is flowing into equities than both precious metals and bonds combined.
US Finished?
Economy is booming, jobs strong, people spending, companies making money, inflation is stable, interest rates heading righ direction
Are you a troll or just that ignorant?
You know the videos where a puppy or a small child will put their heads under a blanket and think that they cannot be seen by others?
The reason those videos are funny is because the subjects are unable to comprehend the obvious.
To me, people who intentionally choose to ignore the obvious are even more funny. They should be capable of comprehending the obvious, but they choose not to. They don’t care if they look foolish by ignoring the obvious.
You are a funny person.
Typical Voter: “But the price of gasoline is only $2.25/gallon. They have my vote.”
The CPI only sees spending, oblivious of the increase in debt required to sustain the spending extravaganza
Many components of CPI are very good. Even rent CPI is very good (except for those two no-data months), and nothing in the private sector comes even close. The new and used vehicle CPIs are excellent (they buy that data from JD Power). But OER is bad conceptually; and the health insurance CPI is bad structurally — those two are my long-term pet peeves.
They just need to fix that stuff that isn’t working; and they need to not mess up like they did over those three months.
AI is becoming a complete joke. Call centers are going to AI and firing all the human call center employees. I have tried getting answers to simple questions using these new AI call centers and in every case I have gotten poor service, no service, or the wrong answers. When this scam gets to be revealed for what it is, look for these AI shills and their stock market bubble stocks to crash.
CPI reports reality better than the spin around it.
CPI has never been a perfect measure of real-life inflation — it’s a benchmark, not a truth machine, and consistency over time matters more than precision.
CPI works because it is flawed — but consistently so.
When you replace that with “improved” methods, you get MORE uncertainty masked as precision that adds more politics, and talking points just to blab about on cable news.
Health insurance is a perfect example of an impossible tweak — tens of thousands of moving parts – individual, group, catastrophic, and HDHP plans, paid through employers, individuals, HSAs, or trust funds – And good luck getting full cooperation from the insurers themselves, from massive carriers to tiny brokers — no one could manage it all and who would pay them for their “help”.
ACA — UGH -massive problem: since inception, billions in federal subsidies have distorted the ENTIRE health insurance market, creating incentives for higher premiums and care costs across the board. Since inception the system hasn’t been a free market, and CPI can’t capture the noise it creates.
That Trojan horse needs to be put out to pasture with Barack and Sleepy Joe – Now that would shape up CPI.
Breaking News: Democrat Government Shutdown 2.0 coming soon — say goodbye to reliable data, AGAIN.
Your party is completely in power and you still whine.
Lol
“CPI works because it is flawed — but consistently so.”
If it was consistently flawed AND flawed in the same way every time, it might be useful in time series analysis. But BLS changes definitions, messes up some of its components, tries to correct them. So it does not work as a time series.
Dude you need to watch less Newsmax and OANN.
@ Skervix – Dude you need to watch less Newsmax and OANN
Come on – I tune into the same place everyone goes for THEIR TRUTHS – You know the only place to get the REAL FACTS – MSNBC oops MS-NOW.
With CPI now at 2.7% and increasing it is time for the Federal Reserve FOMC to start seriously considering increasing their interest rates.
This is gross malpractice by design. The CPI number must be on a downward trajectory to serve the king’s interest in getting interest rates as close to 0% as possible. If you fire all of the serious people, this is the result.
As an aside, here in Mexico, where private health insurance premiums haven’t yet reached the absurd levels of U.S. policies, they account for about 7% of my household’s annual spending. I think a reasonable case could be made for it being 2x that level in the total CPI calculation.
Wolf makes two solid and very specific points.
But overall, did anyone else notice that up until the September report, the inflation trend was going straight up. The BLS commissioner was fired in August for the crime of reporting data contrary to the political narrative and presumably replaced by more optimistic leadership. Lo and behold, the November and December inflation numbers are heading down! The timing is suspicious.
Here are just a few reasons to think the economy is overheating and inflation is a lot higher than we think it is, even after adjusting for errors in OER and insurance:
-Very low Initial and Continuing Claims
-Very low National Financial Conditions Index
-Hourly Wages increasing at a 3.8% annual rate (although also BLS numbers)
-All Transactions House Price Index up 3.8% annualized in Q3.
-Historically high Durable Goods Orders.
-M2 growth at +4.2%, M2 Velocity rose sharply in Q3.
-GDPNow is crunching these numbers and outputting a +5.1% GDP growth rate, which would be a historical anomaly.
-The Federal Deficit hit $602B in the first 3 months of FY2026. Utter money printing.
-Finally, did foreign export companies really absorb almost all of the additional cost of the tariffs, contrary to the expectations of virtually all economists? Were their margins so fat that absorbing a 25% to 30% tariff didn’t even persuade them to raise prices? And margins that high didn’t attract competition in all these years?
Basically, every other metric or gauge is saying the economy is overheating, and we’re expected to believe core CPI is rising at +0.2% per month? Buy commodities, especially OILK.
90+ silver.
I am not sure whether as a stacker to celebrate or get ready to bunker down,guess both a good option.
The super economists at Wells Fargo loved it, they just glanced at the numbers and said bullish! You seem to be the only one looking between the lines.
I wanna buy this health insurance, who is the company?????????
Month to month: -1.1% (-13.8% annualized)
Over the 3 months since September: -3.9% in (-14.8% annualized).
Year-over-year: -0.5%
Since September 2022: -32%
0% health insurance inflation since February 2019
And I thought ( and still do) Hedonics suppressed the Inflation data.
This takes the cake.
Why do I not read this in the WSJ or other business journals???
Thanks for your insight Wolf.
Watching broader events unfold over the past year, in tandem with the new “top down” approach to all this, I was afraid shenanigans like this might be forthcoming. My key question is, where is the new generation of bond vigilantes? Considering current treasury yields, will the bond market really be willing to tolerate this nonsense?
The ten year is pinned at a rate that is unlikely to be a bond that one would look to purchase because based on the decent into the morass of QE, LTD lost nearly half of it’s value for those unfortunate souls who thought that buying the 30 year at 1 pct
“When it becomes serious, you have to lie”
Wolf,
Same liars, different uniforms.
Hmm…no health insurance inflation for nearly six years? Then how come Medicare premiums rose by 9.7% for 2026? Medicare premiums are now up 93% in the past ten years. No retained earnings to measure here.
The current swindle involves the need for AI to require a database of protected information while recording each and every one of us.
An AI model requires time to learn a path not supported by the central limit theorem but with the same rationale of minimizing the sum of the squared error between the model prediction and a target variable
The difference for a number of reasons is important in seeing the evil application of big tech adapting military enemy identification technology on the civilian population.
And in response to my outrage as an average American suffering the consequences of manipulated data by a self-enriching government, I’m going to re-elect all my congressman and senators as if they’re doing a great job so that nothing changes.
I would look foolish if I disagreed
On the other hand I would look foolish not pointing out Thomas Paine’s opinion as expressed in his tome ” the Pamphlet
Words that clearly demonstrate in the long run, America has always been a Social Democracy, the secret too our success
Simple CPI: The CPI is simpler than the Bureau of Labor Statistics (BLS) scratching their heads on how much cat food to substitute for hamburger when using an old expired box of hamburger helper. Using official US Government data on costs Labor, vehicles, whatever for a huge operation; i.e., the US Postal Service. Found a stash of USPS flag self stick stamps, thought they were forever stamps, but they were 39 cents, so ok 2 on each letter for 78 cents and I lost half my money. The stamps didn’t look old, so how long ago, looking them up 2006 or 20 years ago. That works out to 3.5% annual compounded. So the real CPI is 3.5% a year no matter what some central banker says.
Solid analysis. I hear the BLS is looking for the “right kind of analyst” if you want a job, wink, wink.
It’s getting hot in here! This would have been a great opportunity for MSM to call out the administration’s touting of lower than expected inflation. But they mostly didn’t. They are probably too embarrassed to admit their interests for lower interest rates align. That kind of thing can get you cancelled nowadays.
I was just watching Trump’s speech talking about Powell and interest rates and he said “I want the market to go up.” This guy’s fascination with destroying the country for the stock market is disturbing.
“This guy’s fascination with destroying the country for the stock market is disturbing.”
Not really, debt is where their power comes from. Why would you ever liquidate your own power base? They’ve all been doing Dem or Repub for my entire adult life time. It is why recessions are essentially outlawed now. Wait until the next crisis, when they treat people talking about economics like they treated people talking about it which shall not be named.
This “both sidesism” is absurd.
Seriously, are you not able to tell the difference?
They defaulted on pensions in the 70’s and 80’s, then made the stock market the new retirement account. Why would you be surprised if they defaulted on that?
Nothing to see, move along don’t question the official data,, believe what they tell us.
Maybe as high as 3.6% if they use real data? Right or wrong? It’s accumulative correction maybe as high 3.7% annualized.
$vix just needs to close above 18.52. Than boom. It’s like the sodium potassium pump moving muscles. Short yen Short $vix spoof the algo into buying risk. Once the $vix breaks out tail risk will be everywhere. SCOTUS decision tomorrow, I think so.
I’m not understanding something.
Why is the OER inflation for December 2025 impacted by readings in Sept-Nov for purposes of YOY inflation computations. I expect they would just compare Dec 2024 values to Dec 2025 to determine YOY inflation, and that would effectively true up any mistakes in prior months.
“… and that would effectively true up any mistakes in prior months.”
I think I understand what you’re thinking: that if you measure the distance between two endpoints of a 2×4, for example, you get the correct result even if you mis-measured some of the 12 increments that you measured in between.
But the CPI index is not a fixed 2×4. It is built month by month. One segment is added every month. If you add three segments that are too short, the whole 2×4 is going to be too short, and your measurement between the two endpoints (year-over-year) is going to show that and will be too short.
Below are the OER index values. The value for October is the mean of Sep and Nov for illustration purposes. In each month, one segment was added. If three segments (Sep, Oct, Nov) were too low, the year-over-year distance will be too low by that amount:
12/1/2024: 419.7
1/1/2025: 421.0
2/1/2025: 422.2
3/1/2025: 423.9
4/1/2025: 425.4
5/1/2025: 426.6
6/1/2025: 427.9
7/1/2025: 429.1
8/1/2025: 430.7
9/1/2025: 431.3
10/1/2025: 431.9
11/1/2025: 432.4
12/1/2025: 433.8
Doesn’t this illustrate that if an under-report of inflation for any one month isn’t corrected, that the cumulative total of inflation will be low forever forward from that month? If so, how significant is that fact?
Yes, that’s correct. It carries forward forever. That has been one of the dynamics with the health insurance CPI which is now flat with 2019, which is ridiculous.
But the next month-to-month readings and future year-over-year readings after the 12-month period would show the correct inflation figures — while the cumulative long-term inflation readings remain screwed up.
CPI shows about 30% inflation since 2020. This includes all cumulative errors in both directions. The hope is that these errors are small and balance each other out, as random errors would do. But if the error is systematic, such as with the health insurance CPI, it lowers the cumulative inflation readings.
Thankfully, the health insurance CPI weighs less than 1% in the overall CPI.
The CPI numbers are rigged, mostly because of the weightings for each category, but there are other serious problems that have caused an undercount of inflation for average Americans. When ai really kicks in, and millions of jobs are eliminated, it’ll make 1932 look like our senior prom. We’ve got a debt bubble, a crypto bubble, a housing bubble, a stock bubble, a gold bubble…and dishonest people in charge of this runaway train. By next June we’ll have $40 trillion in federal debt. It’s not going to end well. What happens to the tax base when truck drivers, teachers, accountants, writers, and lawyers lose their jobs?
I’m waiting to see if we will get an honest Construction Spending number, including Manufacturing Construction, at the start of February. The last one published was from August. It’s a survey, I think, so I’m guessing there is room to fill in some imaginary numbers.
Census is supposed to release Sep and Oct data next week (Jan 21), per its release schedule
Nov and Dec data releases are sill “TBD”
This impact of the shutdown on data collection has turned into utter chaos.
While the shutdown definitely caused problems, don’t forget that there also was a DOGE induced headcount reduction that helped create the chaos.
Case-Shiller should publish a CPI for housing. They have the absolute price level going back a long way, and could easily create a bullet proof analysis, and present it to the BLS requesting comments.
“Currently the weight of the health insurance CPI in overall CPI is less than 1%, which is another ridiculous absurdity.”
Especially considering that the actual monthly health insurance premium paid to insurace companies (vs. the subsidized out of pocket amount) is higher than rent in many/most counties in the USA in 2026.
“Case-Shiller should publish a CPI for housing.”
Nonsense. CPI does NOT track asset prices, it tracks “consumer prices” (goods and services that consumers “consume”). So CPI does not track stock prices, home prices, gold prices, etc. Just consumer prices.
In terms of Case-Shiller:
1. Case-Shiller only tracks 20 metros. It doesn’t track Houston, Philadelphia, etc. So it has a “20 Cities index.” That small coverage of the US housing market is one of the reasons I abandoned Case-Shiller.
It also produces a “national index” that’s a combination of its 20-cities index and FHFA House Price Index, which is based on sales that involved government-backed mortgages, but has no data on cash deals or on sales that involved mortgages that weren’t backed by the GSEs (such as jumbo mortgages). And they exclude distressed sales. So this GSE-mortgage-based home price data is heavily skewed, and the Case-Shiller national index is useless. I have never reported on it for these reasons.
Case-Shiller is an outdated measure that no one has invested any money into for two decades and that has been sold and re-sold and is currently owned by S&P. There are far better indices out there now that a modern and cover the entire US.
3. Any long-term home price index IS a home price inflation index. Look at my articles on home prices. They all give you the percentage of home price inflation. But that does NOT belong into CPI because homes are assets and not consumable goods and services.
“homes are assets and not consumable goods and services”
While new and used vehicles are not an asset like a home, isn’t their use and replacement timeframe closer to housing than other items and commodities? Is this index, based on JD Power, reflective of the cost of someone walking into the showroom today to buy a new car that they will keep for several years typically. Thus, wouldn’t a new home price index be reflective of the cost of someone buying a new home today rather than guessing what I may be able to rent a house I bought 7 years ago for? The home live in is also quite different than the home I bought 7 years ago.
Whether its the case-schiller, or NAR median, or some other measure of current home prices, wouldn’t a transaction based measure reflect that reality. Someone at the BLS is also smart enough to include some calculation based on x years of past sales (may 7 for the typical time to resale) plus a home insurance index, real estate tax index, etc. into a total index rather than a survey based index.
Then again, I think like an engineer rather than an economist.
The end value of a vehicle is salvage value. The end value of real estate is land value. Land values tend to appreciate.
If you have a company, you put your company vehicles as an asset on the balance sheet. But you depreciate them to zero and sell it at some point at a small fraction of the purchase price. So they’re consumables (durable goods). Real estate is not a consumable item. Nor are stocks.
If I were a cynic I might speculate that Bad Actors are faking the CPI downwards so that when it is corrected – before the next elections – the new numbers will be unusually high. That should dish the Republicans.
Whether the “next elections” will be the midterms or the next Presidential election we’ll have to wait and see.
Now on to the PCE that allows for substitutions for items that have become “too expensive”. Chain weighted. Talk about downward biased metrics.
If you think this is bad, wait unitl the Fed Chair is a stooge.
I am fearful that you are prescient……..of a future “Trumpian” stooge. We are moving into dangerous waters.
Wolf: Really wish you could get this out to the larger American public. Perhaps it is “a pox” on both political parties……but, this blatant manipulation of the CPI data, in order to “lower” the perceived rate of inflation…….seems totally Trumpian, and self-serving of his administration. The info your present, is certainly “in the weeds”, but I am sure could be explained in a way that “regular” folks could understand, especially as it applies to COLA raises to social security, pensions, etc. A future of governmental self-dealing at the expense of it’s citizens seems obvious.
NAH WRL:
Same stuff different day…
SO clear, at least to this now certifiably elderly guy who has been watching SM since ”uncle” took me to the local stock broker office to watch the ticker tape before it was available on his TV, at least 70 years ago.
Uncle was an engineering graduate into the middle of the Great Depression, and had gone to work parking cars and eventually owned 5 parking lots and did his due diligence on every day’s reports, etc.
He made it very clear to me that this exact kind of manipulation of data has been going on for ever,,, literally since at least a couple thousand years.
Consider the extent of the degradation of the money of the Roman Empire, now clearly known, as they just substituted base metals into their coins to know that…
If someone tells you that everyone cheats, all you can infer is that they are a cheat.
Healthcare is extremely complicated in terms of its economics.
However, being a simple guy, even I understand that supply and demand are components in the rising costs of healthcare delivery.
Physician shortages are projected to reach 187,130 by 2037, according to Stratanker.org. Nursing sees similar shortages.
One reason that becoming a healthcare provider is so challenging is a poor educational foundation.
The government schools’ performance in teaching STEM is hurting the country’s ability to produce doctors and nurses.
Someone should look at this.
LOL! Yeah, because investing ten years of your life, going into massive debt, only to open a practice (if you are lucky) that is forced to become a money machine for useless paper-pushing idiots in the insurance industry is so enticing.
Wake the hell up.
Nothing of value in this life is obtained easily, but the least we should be doing as a country is not making it harder. In fact, I’d say this observation can be found in just about every business that isn’t working. Lot’s of “administrative” costs (money going to useless paper-pushing douchebags and none getting to the people actually delivering the service)
Exactly, the shortage is way underreported but worsening daily. Instead we get a war on education and attack on the very student loan programs I and many relied on and paid off to become a physician. It makes one wonder what sort of world are they trying to create filled with uneducated citizens? Our leaders are truly drinking the AI futurist koolaid.
The data is in and healthcare admins are finally waking up to the fact that trying to plug the system with NPs and PAs is only yielding higher to net neutral overall costs due to excessive diagnostic test ordering and followups.
Weve shut down immigration so thats out as an option for now at least politically.
AI? Looks like even google finally realized what Ive seen all along, its AI results for anything in my field or healthcare in general are often so wrong that even they had to intervene. But dont worry, just a few more trillion in data centers and it will get there.
DFB below: an even scarier quote came to mind “Im from your private health care insurance and here with a bill”
dated from Sept:
Quote from BC Health Minister…similar %stats from all provinces
Osborne says more than 140 health-care workers from the U.S. — including 80 nurses and 38 doctors — have accepted positions with B.C. health authorities since the launch of its campaign in March 2025.
Osborne, who was speaking at the Union of British Columbia Municipalities’ annual convention in Victoria, says the figure “bodes well” for the campaign, which has produced some 1,400 job applications from U.S. health workers.
“140 health-care workers,” OMG, WOW!
Do you know how many employees there are in healthcare & social assistance in the US? 23.65 million (that would amount to over half of the entire population of Canada)
Maybe those were 140 people who married across the border and moved to be with their honey? Happens in both directions.
I retired out of medicine at 54 in 2024. I HATED IT! They literally couldn’t pay enough to keep me. That is the reason for the shortage. No one in their right mind would ever trade the time required for today’s pay and headaches. AI is eventually going to plow down the entire field anyway. Word has spread. If I ever needed money again, I would turn to anything but ever dealing with another entitled minority with free care or the drama of psychotic female staff…
This is nonsense. The problem is not on the STEM end. As a healthcare provider let me tell you:
1. There’s a residency bottleneck. In 1997 Congress capped federally funded residency spots. So despite class sizes for MD’s and DO’s expanding, there are not enough residency programs to match them all. This is why there has been an influx in non-US MD’s to meet the need because the U.S. can’t meet the demand itself.
2. For nurse’s, educators get paid crap. You have to WANT to be an educator at a university because the pay is just not worth it. And many universities require PhD’s in nursing which still does not pay very well vs. hospital jobs.
3. Burnout/retention is a real issue. Hospital CEO’s treat healthcare providers like crap. Nurses probably have the best work/life balance but the stress/injury/patient abuse risk is real. MD’s have terrible work life balance in many cases…..which leads…..to, when there was so much better/easier opportunity for a work life balance getting some sort of tech degree with way better opportunities not to mention the debt…..which brings me to….
4. The debt issue is real. For MD’s as well as RN’s pursuing advanced degrees. As an RN getting an advanced degree doesn’t always equate to better work life balance (usually worse with flat pay vs. a standard 3×12 RN). I can tell you at this point in my life, the ROI is better in stocks than it is going back to pursue my MSN so I can become a NP.
5. Litigation risk. People I work with are constantly getting called into court for various cases when they find a lawyer willing to take on a case to sue the hospital.
6. There’s so many healthcare providers that hate what they do (MD’s and RN’s because the way the system is organized and work). They are constantly abused, hospital CEO’s turn a blind eye to the work load and risks that these providers take on while trying to help people. I’m not even getting into some of the silly CMS requirements that we’re constantly bombarded by meeting specific metrics for.
The system is jacked up and needs a lot of fixing.
Thanks for elaborating. The poster’s general lack of critical thinking also underscores another problem. Americans, in general, have become quite the entitled bunch of fat, lazy and stupid people.
As we all know, things of value (like your health) require real work. How many medications does the average American take? Now all these people are taking glucacon-like proteins to block fatty acid biosynthesis and glycogen synthesis and promote the catabolism of each DESPITE the actual metabolic state of the cell? glucagon is a key and centrally important hormone (opposite signal of insulin) and antagonizing that receptor for prolonged periods seems like it might lead to dire long term affects. Guess we will find out, but Americans (in general) want an easy fix.
Healthcare Defined from these posts-
Bad pay low incentive to run the race
Burnout poor retention
Overloaded system with too much paperwork
PAs and NPs need more expensive diagostics to bridged the knowledge gaps so no fiscal gains
Poor pipeline of providers due to poor eductation system
I’m from the Government- I am here to help! – Medicare for all.
Run Run Run…
Why am I not surprised that is what you got out of that discussion? Geezus, it is amazing how people are susceptible to soundbites rather than using their brain.
They doctors and nurses should stop voting for the same thing then with the uniparty if theyre not liking it. The only party on the ballot for balanced budget is Libertarian. The overall reason for a messed up situation across many areas in this country is deranged debt and deficit spending.
Good points, many of which I was previously unaware of, thank you.
However, it would be difficult to become a physician or medical scientist given this data:
– U.S. students’ performance on international assessments like PISA (Program for International Student Assessment) shows weaknesses, especially in math. The U.S. average score for 15-year-olds in math was below the OECD average, and math rankings place the U.S. well below top performers.
– U.S. students’ performance on international assessments like PISA (Program for International Student Assessment) shows weaknesses, especially in math. The U.S. average score for 15-year-olds in math was below the OECD average, and math rankings place the U.S. well below top performers.
– Only about 1 in 5 U.S. college-bound high schoolers was adequately prepared for college-level STEM coursework, according to the National Education Technology Council. Even among those who start STEM majors in college, a substantial share drops or switches majors, often due to gaps in early preparation.
–
All is true but at this time the unemployment level in STEM grads is extremely high and hit tech employment scene is abysmal.
This is not due to shortage of STEM workers in USA.
Shortage of STEM workers in USA is a lie perpetuated by Big corps to bring in cheaper work force from outside.
I work in STEM BTW.
Same for Doctors. We have artificial scarcity of docs due to policies not we don’t have qualified people to become doctors. I have family members here studying med and hence I am intricately aware of this.
Here is an interesting thought…, how much health care inflation is due to private equity companies inserting themselves into the money flow as needless middle men ?
There’s also a common practice of overbilling. Hospitals have entire teams of people set up to comb through charts and figure out ways to extrapolate more CMS reimbursement. UNH is under investigation for this. It’s happening across the country. I was hopeful that Dr. Oz would do something about this but I am not so sure.
My wife dedicates a considerable amount of energy to this. We have 5 kids and none have any serious health issues, yet almost every single procedure or test or anything beyond a basic visit requires her to sort through an erroneous bill with our insurance and the provider. She has this down to a science by recording calls, multi-tasking, documenting names and codes, hanging up on the 75% of completely useless customer service monkeys and calling back. She saves $1000’s but we literally cannot change insurance because she may have to relearn the system. Who knew that it’s not just procedure codes you have to know but a combination of procedure codes AND diagnosis codes. She’s had calls pulled up that were recorded and gone through the attorney general at least once to get them to bill/code it correctly, or at least the way they agreed to code it prior to the service being rendered. Who in god’s name has time for this? And they know it. My wife is a stay at home mom who tutors three special needs kids. I can’t even think about it for too long without blowing a fuse. I honestly don’t know how she does it.
My prediction is that energy costs and the PPI are going to keep rising, maybe blow out. The insane levels of capital and resource mis-allocation is going to catch up with us bigly.
Howdy Folks. Great article Lone Wolf. I always try and find humor everyday in life . After reading your recent article, a famous quote came to my mind. ” I am from the Govern ment and here to help ” Life is good, as long as you know how to live it Youngins….
Am looking forward to the new website. Wolfstreet Part 2
Questioning the Ministry of Truth is high treason Mr Wolf. I highly recommend you recalculate where your loyalties lie and if its worth it to win little e-wars on your blog at the cost of betraying your leaders and nation.
Love the satire. Looking forward to reading more of it!
Hahahaha, uniparty, which includes maga, threats dont scare me one bit. Try me for treason, I dare ya.
I am still amazed that in this day and age people are completely unable to distinguish between the political parties in the U.S. Unreal.
MSN: ‘That jerk will be gone soon,’ Donald Trump slams Fed Chair Powell, says Fed pick won’t be delayed
Many justifiable comments regarding the current Pres…
You can always vote D
“After a swath of billionaires publicly announced they are leaving the state of California over a proposed wealth tax, Governor Gavin Newsom went into a full blown panic – vowing to stop the proposed tax and “do what I have to do to protect the state.”
Billionaires have the ability to butter both sides of the bread.
The irony being that these same billionaires got that way via the same California system that they are now “revolting” against. Especially all those federal subsidies for green energy projects. LOL, don’t let the door hit you in the ass on the way out!
Maybe we should claw back those funds? Give them a choice. That or a guillotine. That’s where we are headed folks.
I have long said that America’s oligarchs are taking us to the same place the former Soviet Union went in 1990. They really should be careful what they wish for.
One party wants to make sure everyone, including the poor recieve basic healthcare, the other party wants to keep giving billionaires tax cuts. The most amazing thing is that the party wanting to give billionaires more tax cuts has convinced the poor to vote for them.
Basic healthcare doesn’t exist in rural America. Skyrocketing health insurance policies do.
I’m amazed most folks don’t know the diff between a health insurance policy and actual healthcare.
@ JimL – Why am I not surprised that is what you got out of that discussion?
@ JimL – One party wants to make sure everyone, including the poor recieve basic healthcare,
First, Obamacare covers people making $500k+ for years and Medicaid IS healthcare for the poor but not meant for illegals and fraudsters like it has become.
Break this down for us.
What lane have you actually worked in — payer side, provider side, clinical, admin, revenue cycle, contracting?
Or are you’re just whining like you say – to counter anyone who seems to be against your bubbleology.
I’ve got decades in the healthcare business and I’m a combat vet in the VA system, so been on both sides of the fence. You??
So – how do you see the payer system shaping care delivery – What’s your read on the provider squeeze from reimbursement despite premium increases
And how do you think the ACA has actually improved the entire landscape over the last 15 years?
Give us something real, not another quick meaningless nothing burger.
Oh and lastly, Obamacare subsidies go straight to the CEOs bonuses and the BILLIONAIRE big health insurance company bottome lines who are the biggest donors of the Democrat party so they of course want the “poor” people to keep getting their OBAMACARE…
Weak
They have the ability to poison the poor into thinking they’ll reach that level someday with hard work.
Just keep them entertained and don’t look over here.
So you’re just quoting an X post as if it’s sourced news?
This is precisely what the media (modern journalism) does. What’s you point? Do you have something intelligent to add. Newsome wants to be president some day, of course he would veto such a bill. Hardly news if you ask me.
That’s a quote from Gavin. Here’s more:
“This is my fear,” the California governor said. “It’s just what I warned against. It’s happening.”
“This will be defeated,” he said. “There’s no question in my mind. I’ll do what I have to do to protect the state.”
Obviously could have better health care numbers but universal health is the obvious solution. Just wish other countries would have tried something like this as ensuring health care for a society is a novel idea. Until then everyone’s individual health care situation is so different that no one metric or weighted metrics will be accurate, and if used, would likely just under estimate the impacts to most vulnerable.
Imagine you lived in a country where one of the major parties leading the country said that getting multi-ton vehicles into the air was impossible and useless and a waste of time. They weighed too much and could never get off the ground. It was a folly to try.
Yet the rest of the world was flying airplanes all over, moving people from place to place.
That is sort of like single payer healthcare in the U.S.
again, healthcare and health insurance are not the same
like auto care and auto insurance are not the same
Which one of your children came up with that simplistic analogy? Whatever happened to the idea of selling health insurance across state lines?
@ JimL-Yet the rest of the world was flying airplanes all over, moving people from place to place.
We’ve got 330 million people — “free healthcare” isn’t free.
Prepare for a 50% tax load, not just the ultra‑rich – EVERYONE.
One payer becomes one choke point
No market incentives for competitive quality –
When it clogs, no place else to go but the airport.
Wait times stretch from “soon” to “whenever” to “denial” because capacity can’t keep up.
Specialists thin out – burn out – when reimbursement gets squeezed our brightest become lawyers and engineers not doctors.
Politics ends up steering access and are the stump speeches for every election.
Coverage is universal, but getting care – GOOD LUCK
Every politician runs thier election on FIXING OUR SCHOOLS – Why because they are so-called free and run by the government.
Wolf,
Your post points to the reason that the U of Michigan Consumer Sentiment reading is near all time lows, despite a decent labor market: the inflation numbers do not reflect the lived experience of people on the ground.
This is NOT saying that the inflation numbers are being manipulated, as some claim. They’re just not capturing what people actually pay, for the things they have no choice but to pay for, like health “insurance.”
Bitcoin Faces New Regulatory Battle as Senate Piles on 75+ Amendments
Lawmakers are flooding a major crypto market structure bill with amendments touching DeFi, stablecoins, yield products, and government oversight. The outcome could reshape how Bitcoin and digital assets trade in the U.S. and determine which platforms thrive or get squeezed. Volatility risk is rising and so are long-term opportunity signals.
Government Mantra: Run it Hot and Lie.
Wolf, at what point will you consider that CPI is not broken but is the way powers and interests and politics want it to be.
Yesterday the media was full of “cool inflation numbers means the FED can cut”. I kept visiting your page eager, eager, eager to read your take.
Just as an aside. My wife is thinking of retiring – shes only 62 but ready to quit working. We looked into conventional health insurance – nearly $2000/month.
It will be interesting to see how the inflation story plays out over the next 12 months. Regardless, the agenda is to push down interest rates to 2%. Some want to see 1%, but I just dont think that will be possible….but I’m used to being wrong.
Thanks for this article.
CPI has many excellent parts that reflect well what’s going on with prices, including the new and used vehicle CPIs, energy CPIs, and generally the Rent CPI. And it has some shitty parts (OER and health insurance CPI, for example) that need to be fixed. And I’m trying to push them to fix it. And occasionally, things happen that shouldn’t happen, and we’ll have to watch it closely to see how it turns out.
Your wife needs to hold her nose and keep working until she’s 65 and can get on Medicare. When you get older, private health insurance is outrageously expensive (makes sense because healthcare issues start piling up). I hope my wife sticks it out until 65, but she has a decade more to go.
danf51,
You probably checked this out but if you are in a state that has subsidized plan you just have to keep income way down as they don’t look at assets. All where and how you pull money out. I’m in the same space, wanting to target 61. More tricky though as I also have a child under 26 that I need to cover.
My health insurance premiums for Blue Cross/Blu Shield just increase by 7% YoY. Last year was 9%. Inflation is much higher than reported.
Thankfully health insurance isn’t the only thing everyone spends money on.
I may add that one way the CPI is distorted is it doesn’t adequately address the issue of product substitution. One example is food prices. My local chain that I shop regularly has been lowering the quality of everything it sells. This is to keep prices down. They’ve substituted frozen fish for fresh fish. Some comes in from China. They discontinued the salad bar in favor of bulk sales of the same items. The substituted healthy soup bar with prepared fast food from external vendors. The grapefruits are the size of oranges. I could go on, but you get the point. I now have to shop at a high end grocery store to get the same quality of groceries. The prices are 30% higher.
No, that’s not how the CPI works. In the CPI, frozen fish is one category, fresh fish is another category, prepared fish is in another category. And there are many specific items in each category, and they’re all tracked by weight separately. In a little while, I will post an article on food inflation. One of the charts in this article, as an example of how food is tracked, is the CPI for “ground beef, 100% beef, price per pound.” Another chart in this article is “Eggs, grade A, large, $ per dozen.” CPI tracks tens of thousands of individual goods and services like that separately. So if your store no longer carries fresh salmon, and only offers frozen salmon, fresh salmon prices continue to be tracked as fresh salmon, and if buyers switch to frozen salmon, it has no impact on the prices in CPI.
Wolf
Good comeback
The only thing not accounted for is the fact that when a shopper goes to a different store to get the quality they desire for such an essential item as good food, there is the tendency to spend on other items in that same store, resulting in higher spending in the food category. The CPI may not adequately capture this impact.
I understand that there are separate baskets for each specific item in CPI. I was under the assumption, however, that CPI had weighted baskets, so that in this case CPI would correctly track the price increase in fresh fish fully only if Swamp Creature goes and finds fresh fish for the increased price, wherever that is and actually buys it. If, however, he, or anyone shopping at his local store switches to cheaper frozen fish because they don’t have the resources to find and purchase fresh fish, then the weight of the basket for fresh fish is reduced by that amount and the weight of the basket for frozen fish is increased, thereby having the effect of watering down the price increase of the fresh fish because less people can afford it and having the inverse effect on frozen fish, which, when weighted more heavily would drag CPI down, being that frozen fish is in the cheaper basket. The impact may be the intended impact, but is an impact to CPI, no? Unless I don’t understand.
TIPS and I bond investors are supposed to be smart, but they have continued to vote for decades of unsustainable debt and deficits of both the major parties that overspends like a uniparty. Do they expect to just waltz away unharmed from all the damage being done that they voted for? Totally careless and arrogant fiscal unrestraint will negatively affect everything. I have a fair amount invested in those but I’m not surprised considering what has been going on.
It is obvious that is an opinion you will carry beyond what is rational.
Recently I heard a perfect commentary.
Libertarians are like cats. They think they are superior to those around them, yet they eat the food and shit in the litter box that is cleaned for them each day all while thinking they are making it on their own.
I think fraud is a large component of our healthcare industry. In fact i’d argue we live in the age of fraud. And i’d argue .gov is the largest enabler and its not by accident. Fake economy requires fraud. Its like oxygen
It is amazing that someone can be so right and so wrong at the same time.
What is the basis of your “beliefs”? Feelings?
Its amazing how someone can comment like you and state something without making a point ;)
I work in healthcare, i tried to point out years ago how many of the jobs are fake. Wolf wouldn’t let those comments thru. How can you offer something without stating the price? And just make it up as you go?
These constant allegations about “fake jobs” are moronic. People here said that folks like me have “fake jobs” because we don’t actually produce anything tangible, such as a house, or a motor vehicle, or farm products. Other commenters here have said that workers/managers have fake jobs only because these commenters were clueless about what these workers/managers did. Just because you don’t know something doesn’t mean that it’s a fake job.
If there were all these “fake jobs” out there, the economy would be in the deep-freeze. But it’s not, it’s a pretty vibrant economy with good and bad parts, and if you don’t see this, you need to get out a little more often, or actually read the articles here.
So the CPI is lower than it actually is? Donald Trump should like this a lot. It will advance his cause to lower interest rates. But doesnt this put the bureau of statistics between a rock and a hard place when they have to do the upward adjustment?
One can look at 2025 per capita spending per household to get an impression of true CPI. Services consume 69% of household spending. Services inflation is what matters as your articles point out. Services ran hot for 2025.
For 2025
Total Spending (incl. Food and Energy): 3.3% increase per household
Goods 1.7% increase (Food 1.1% increase dampened Goods increase)
Services: 4.0% increase
Services ran hot in 2025, and continues to run hot. Food inflation lower due to global , not US centric items.
And we are cutting interest rates . . . when they should be increased due to being over 2% target. Make it make sense.
“And we are cutting interest rates . . . when they should be increased due to being over 2% target. Make it make sense.”
Interest rates should not be cut. The Fed should leave them where they are or start raising them instead to bring down inflation which is running near double digits as we speak.
Yeah, it’s not a monetary policy, it’s an interest rate policy. Unfortanatly the two are disjointed.
You can cut interest rates while tightening monetary policy. The 1966 Interest Rate Adjustment Act is the paradigm.
See: Déjà Vu at the Federal Reserve by David Beckworth
“Over time, the Fed’s estimate of what constitutes “ample” reserves has moved in only one direction: up”
See: Déjà Vu at the Federal Reserve by David Beckworth
Even when the Fed had scarce reserves, they moved up because the economy grows, inflation inflates the figures, and the banking system grows. If there is 30% inflation over a 5-year period, every monetary value is going to get inflated by 30%.
The Fed’s balance sheet has always grown more or less in line with nominal GDP, from day one, and before QE:
Are mortgage bonds traders just going to write off CPI as useless and stop trading it. Or will they do their own form of extrapolations. Probably a mix of everything in between?
This! :
It is outrageous to present to the American people this kind of chickenshit index of a big and ballooning expense that plays such a huge role in Americans’ daily lives: