Ridiculously-behind Bank of Japan is trying to deal with a huge multi-decade monetary mess without crashing global markets.
By Wolf Richter for WOLF STREET.
The 10-year yield of Japanese Government Bonds (JGBs) jumped 7 basis points today to 2.09%, the highest since February 1999, continuing the surge that had commenced in late 2019, back when the 10-year yield was still negative due to the Bank of Japan’s Yield Curve Control.
Inflation took off in Japan in 2021 and currently lingers at around 3.0% (core at 3.0%, overall at 2.9%), while the yen collapsed against the USD over those years. And step by step, the BOJ eased off Yield Curve Control, and then abolished it, and then hiked its main policy rate out of the negative, and started QT. On Friday, it hiked again by 25 basis points to a still ridiculously low 0.75%, the highest policy rate since 1995 – that’s how long the BOJ’s crazed monetary experiment, that it is now unwinding, has lasted! These painfully slow baby steps are leaving Japan with still deeply negative “real” interest rates across much of the JGB yield curve.
So buyers of 10-year JGBs are still far from getting compensated for inflation even at the highest yield since 1999. When yields rise, prices of existing bonds fall, and investors who’d bought the 10-year JGB back in 2019 at a negative yield bought into a sour deal.
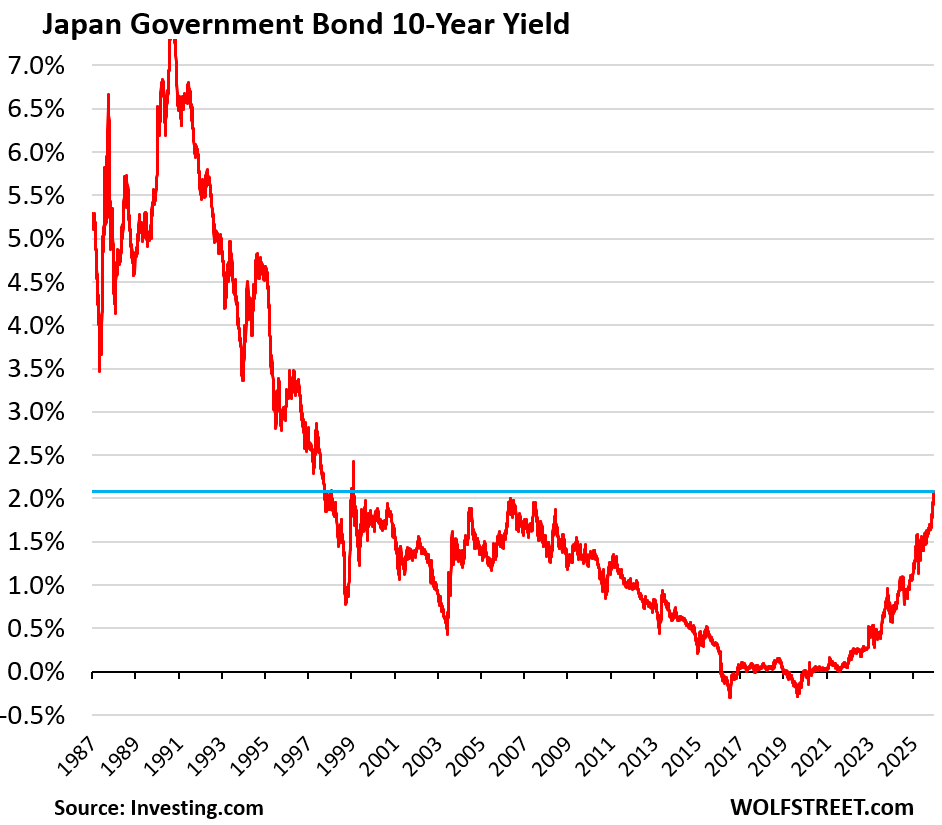
The 10-year JGB yield is still ridiculously low, over 200 basis points below the US 10-year Treasury yield, even though inflation in the US and Japan are running at about the same pace, and Japan’s credit rating – A1 by Moody’s, A+ by S&P – is three notches worse than the USA’s blemished credit ratings of Aa1 per Moody’s and AA+ per S&P (my cheat sheet for bond credit ratings).
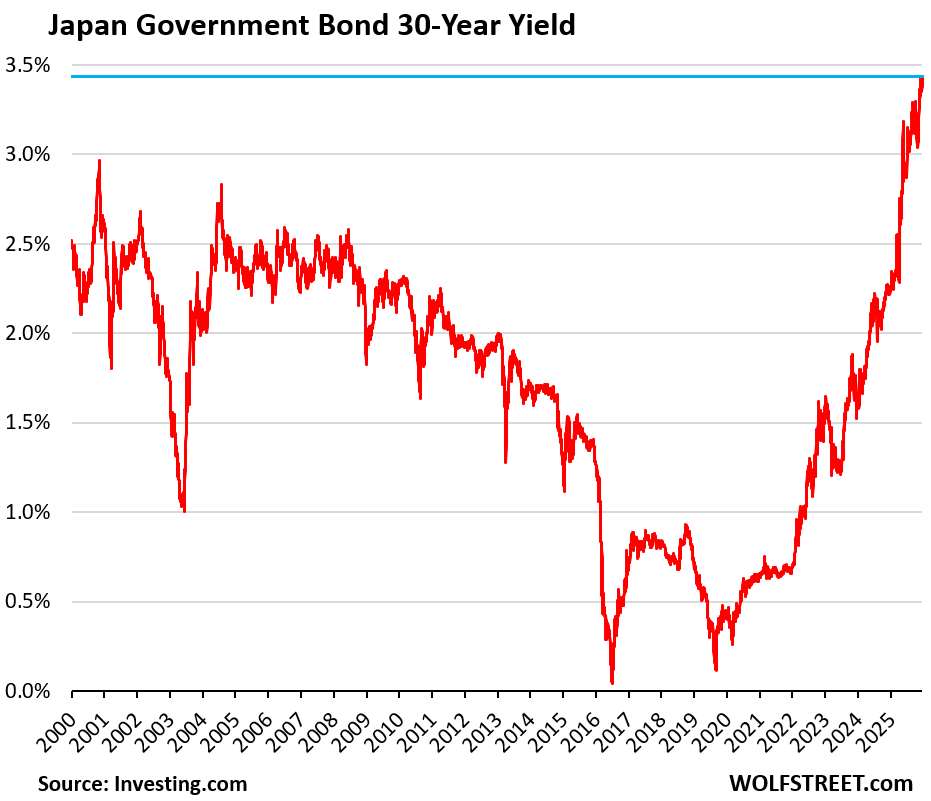
The 30-year JGB yield has risen to 3.43%, continuing the majestic spike that had commenced in August 2019, when the 30-year yield was just a hair away from turning negative.
The JGB yield curve has steepened since the rate hikes began. The BOJ announced its first rake hike on March 19, 2024, to +0.1% (from -0.1%). At the time, YCC had already vanished and QT was being phased in, and long-term yields had already risen, but the 1-month yield was still -0.1% before it began to rise toward the new policy rate.
The blue line in the chart below shows key JGB yields on March 19, 2024 across the yield curve, from 1-month to 40-year yields.
The red line shows these JGB yields today, December 22.
The yield curve has steepened since March 19, 2024: the 1-month yield has risen since then by only 56 basis points, but the 10-year yield has risen by 152 basis points, the 30-year yield by 165 basis points, and the 40-year yield by 181 basis points, as the BOJ has begun unloading its JGBs.
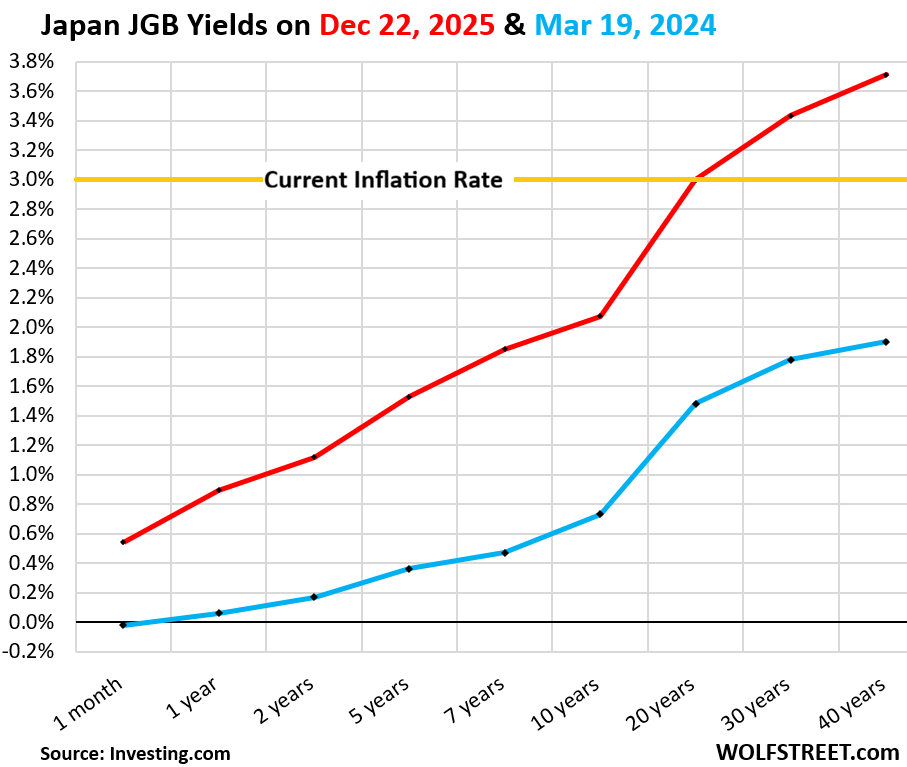
To get a positive “real” yield at current rates of inflation, investors have to buy 25-year or longer maturities (everything above the yellow line in the chart above). These investors are now grappling with the prospect of continued and possibly hotter inflation and with the scary notion that the BOJ, which has been engaging in QT since mid-2024, surrounded by inflation, will not step back into the bond market with its relentless bid that would push bond prices back up and yields back down. That era may be over.
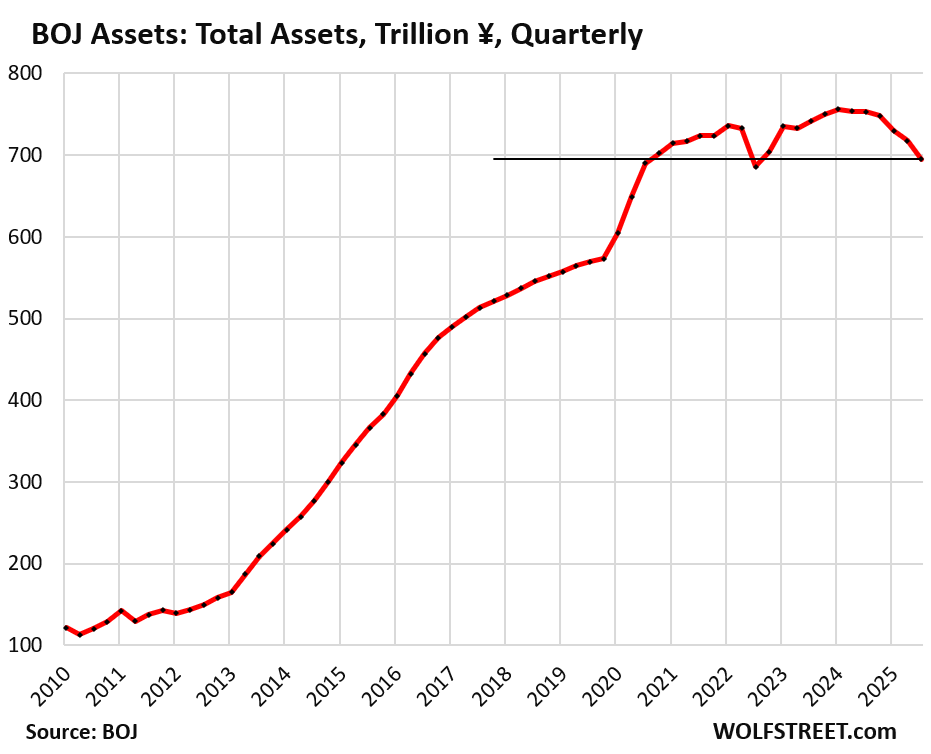
The BOJ has accelerated QT in 2025: Total assets have fallen by ¥61.2 trillion ($407 billion), or by 8.1%, to ¥695 trillion ($4.62 trillion), in its fiscal quarter through September, back to where they’d first been at the end of 2020, all in an effort to deal with the collapsing yen and tamp down on inflation.
But the BOJ still holds about 52% of all JGBs. And government-controlled entities hold another big portion of JGBs. Despite Japan’s huge debt, not all that much is in private hands.
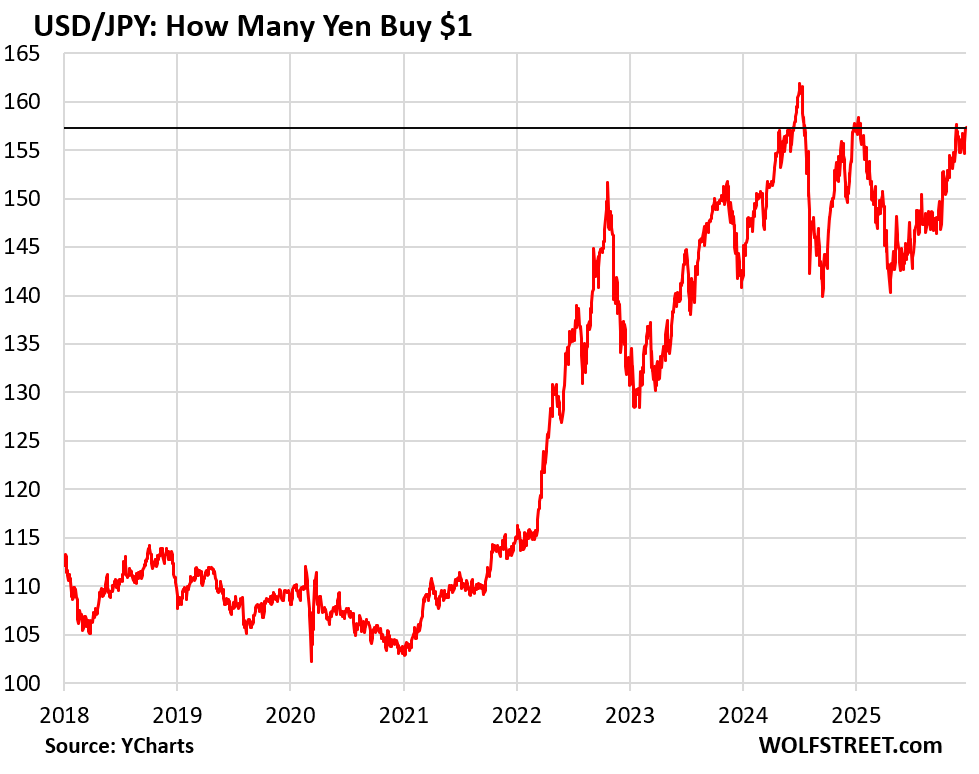
After the yen was skidding toward an exchange rate of 158 yen to the USD on Friday, Finance Minister Satsuki Katayama came out early today to prop it up verbally in an interview with Bloomberg.
“The moves were clearly not in line with fundamentals but rather speculative,” she said. “Against such movements, we have made clear that we will take bold action….”
That term “bold action” made the headlines, and the algos reacted to it and pushed the yen back up to 157 at the moment.
The yen carry trade has long thrived and along the way helped drive up asset prices in the US, and drive down US Treasury yields, as everyone from big Japanese institutions and US hedge funds, down to Japanese households, borrowed cheaply in yen, bought USD with those yen, and then bought US Treasury securities, stocks, cryptos, etc. It’s a leverage bet with multiple layers of risks.
But higher borrowing costs in Japan make the carry trade less profitable and even riskier – it always involves an exchange rate risk (that can be hedged, but at a cost) in addition to the other risks. And the higher yields in Japan are beginning to offer Japanese households and institutions a much less risky alternative to the carry trade.
The carry trade is the hot money. It can change direction at any time. Investors can sell their foreign-currency assets, exchange the USD back into yen, and pay off their yen debt, suddenly reversing capital flows. When the carry trade suddenly unwinds it can have a substantial but short-lived global impact on US yields and asset prices.
But if it unwinds slowly and over time, it means higher long-term Treasury yields and dented asset prices in the US over the longer term.
The slow systematic unwind of the carry trade – because it’s no longer attractive – doesn’t seem to have started yet in a substantial way, and if that’s the case, its impact on the Treasury market and other markets is still to come.
Enjoy reading WOLF STREET and want to support it? You can donate. I appreciate it immensely. Click on the mug to find out how:

![]()
I think this is an extremely significant issue, Wolf!
I wrote about it as well in an article…
‘Japan’s 10-Year Bond Yield Just Hit 2%. Here’s Why U.S. Real Estate And Mortgage Markets Should Care!’ here
This central bank idiocy all began back in 2000 with the BOJ embraces ZIRP…..and Paul Krugman was one of their advisors.
Then other central banks followed suit.
One could suspect that this “plate spinning” by the BOJ would end first, and it seems we are on the cusp of this occurring.
BOJ 44 straight months of being over their inflation “target”. Familiar?
Gonna screw up bitcoin without carry trade. Although may be priced in.
Hope you got electricity there in Frisco Wolf
I’m not sure if there was a blackout in Frisco, which is in Texas. I should ask my friends there. They might know.
But here in SF, 130,000 customers of PG&E lost power due to a fire at a substation. The area was several miles away from where we live, and we were not impacted. I didn’t even know about it until I saw it in the global news when it was already over, LOL. Within 8 hours, 75% of the affected PG&E customers had their power back; 23 hours later 90% had their power back. It’s funny how a small blackout like that makes global headlines because they can stick “San Francisco” into it. The blackout that hit Texas 2021 left 4.5 million homes and businesses without power, and it lasted for days, and lots of people died. Now that was a blackout!
Waymo’s robo-taxis causing gridlock likely explains the world-wide coverage. The fact that it was a substation fire didn’t make the cut.
Reminds me of the “Mean ol’ Frisco Blues” covered by Clapton. 🎶
Yes, non-San-Franciscans (Clapton is a Brit) keep saying it.
Clapton is insane
He once convinced one of the greatest southern U guitarist’s to play on his album.
It was an album to convince a man’s wife to leave the man for Clapton.
The great southern guitarist then shortly died after helping to make it.
The woman whom the album was written to “Woo”, flatly rejected him.
Clapton is nice to listen to but don’t let him woo you. Lol
Timely article, usd yen touched 157.89 in late Nov before bouncing an and creating the equity reversal day, Friday; quad witching day it touched 157.78. Yen strengthen today. Carry trade unwind will be a huge 2026 story. Short yen and recently the short $vix has been obvious. Profit taking in the short Vix trade should be any day. The broadening of the stock market Is the new buzz words since Ai pulled back from the peak. When you look at sp100 stocks above its 200 DMA it’s been at 69% for like few days now. The last 3 market up days it didn’t move. 7 trading days ago it jumped up but it’s been retracing lower on up days, that’s is not bullish!!! not Broadening! The double top in this the total USA stock market wilshire 5000 is still intact at 69 trillion. Santa rally or remake of cult Canadian slasher classic movie from 1974 called Black Christmas to close out the year? Happy family time!!
All I can say is borrowing in Yen and doing almost anything except shorting in the markets has been wildly profitable. Say, $100 million in yen at 2.7% in 2023, then buying GLD, and using options at 3 percent to insure, and it would have been 150%. And that Yen diving on top of the dollar diving is just making more money on the carry trade. That dive from 130 to 157 will pay how much interest alone?
Too soon. First, one needs to see real progress in making the Yen actually appreciate long term. Then the carry trade will unwind. Time will tell. You really want to see currency value destruction, just look at the price of gold in Yen. Jan 23 250k to 696k. Ugh.
Just amazing.
You really want to see currency value destruction, just look at the price of gold in Yen. Jan 23 250k to 696k~ true that!
I just charted it, huge!!!! Parabolic exponential surge (the upward curve of a parabola) started in Jan 23. probably unsustainable momentum almost always followed by a collapse, unless Japan’s 3% sticky inflation turns much lower without future rate hikes. in 2011 usd/yen reached~ 78 the $nikk was trading @ 8800 at that time down from 38.9K in Jan 1990. BOJ made a calculated risk to lower their currency, and it paid off for them, Zombie companies are long gone. Nikkei 225 is up 24% so far in 25 with 3% inflation. Their salary men are not complaining, and their wealthy are in our markets.
Thanks for sharing and participating in the conversation.
‘All I can say is borrowing in Yen and doing almost anything except shorting in the markets has been wildly profitable.’ ~ The cost is in increase systematic risk to the world! yeah, wealth made more wealth, but there is an outstanding payment due. Equilibrium and stasis are natural laws, applied to our physical material world. it’s only a matter of time before the payment will be made.
Super interesting! Is there any data that allows to estimate the size of that carry trade in e.g treasury market? Or maybe other better ways to estimate the potential impact of the reversal in carry trade on treasury yields?
We have a 256 trillion US dollar non-bank financial institution (NBFI) assets. That’s 1.34 times the size of global banking assets of 191 trillion. Japanese govt debt was around 10 trillion when the usd bought 130 yen. Yen currency in circulation 11O T yen or in US dollars is around 7trillion. It seems small compared to total US dollar assets in the world but its the leverage applied. A participant here named Bobber said leverage reduces liquidity, yes but the reverse is not true de leveraging doesn’t increase liquidity. The opposite happens liquidity is scare when de leavening and forced liquidation Even The MIT quants couldn’t answer it’s too dynamic , they have a formula but when tested with rigor the assumption can fail. Or the model fails to track reality. Plus in the shadow $ world people can only guess perimeters
What percentage of government tax revenues goes to the interest on their debt?
Whatever it is, it’s rising.
But as I pointed out, 52% of the debt is held by the BOJ which remits its profits back to the government, so that part of the debt is essentially free.
All fiscal and monetary sins eventually lead to inflation and demolish the currency. And that’s what we’re seeing here. It just took a while. Now the BOJ is trying to slow down the process without crashing global markets.
With respect, the idea that “all fiscal and monetary sins eventually lead to inflation” is not accurate. I supposed it depends on which economic Bible you define your sins by.
Japan had the largest asset bubble, possibly in history, in the 1980s. Real estate in Japan was worth 50% the entire global market.
They then suffered a massive crash, banks went broke, and decades where many companies and people were technically insolvent, with cash flow.
Monetary policy plays a role in setting the rates and the amount that the private sector will extend as credit.
There is a colossal everything bubble in assets, including real estate, as a direct consequence of 30+ years of incompetent and frequently reckless central bank policy, in the U.S. and around the world, where the response to every crash is to lower interest rates, which has flooded the world with vast amounts of low-interest, low-quality credit that has pumped up asset prices to the point that no one can realistically gain a return on them.
This is exactly the failed policy that was run during the 1920s, and the bubble is of a comparable size.
For the most part efforts to contain this crisis are all putting out the fire with gasoline. It consists of continually flooding the market with easy money in the form of private debt, when the major part of a given population already has more debt than they can pay back, but the prime borrowers can use it for M & As to merge and buy existing properties that everyone else is defaulting on.
Japan had the largest asset bubble, possibly in history, in the 1980s. Real estate in Japan was worth 50% the entire global market.
– And something as a simple as a gravity model would have revealed the short and long term flows required to support such a farce.
There is a colossal everything bubble in assets, including real estate, as a direct consequence of 30+ years of incompetent and frequently reckless central bank policy, in the U.S. and around the world, where the response to every crash is to lower interest rates, which has flooded the world with vast amounts of low-interest, low-quality credit that has pumped up asset prices to the point that no one can realistically gain a return on them.
– History has papered over that in 1958 Bretton Woods failed, and by 1968 they gave up on it with the disbandment of the LGF. Nixon closed the window in ’71, and the Jamaica Accord in ’76 legally cut ties.
– In a March 1977 White Paper ‘Jamaica and the Par Value System’ by Halm, it is noted that Keynes understood the fundamental problem of a pegging currency to real value. Keynes stated that National Currencies should not be used for official reserve purposes in excess of normal working balances so as to prevent limitless and unregulated growth of international liquidity.
“Knowable and foreseeable” comes to mind.
“All fiscal and monetary sins eventually lead to inflation and demolish the currency.”
Wolf, you have a skill for occasionally distilling an economic process to it’s essential truth, that other writers and economists just don’t- or won’t!
“52% of the debt is held by the BOJ”
anybody figure out the new paper loses at the BOJ ?
Fiscal and monetary sins ultimately lead to consumer price inflation, but before that happens, we can see asset inflation and wealth concentration for decades. The experiences in Japan and the US are evidence.
Rather than deal with periodic mild recessions, over-confident and short-sighted authorities continually and artificially stimulate through fiscal policy, interest rate repression, and QE, leading to artificially inflated asset prices over time. It can go on for decades because asset inflation is a by-product of their models and not something they worry about. Moral hazard, wealth concentration, and excessive speculation become essential features of the system. When the bubble becomes obvious, they deny it exists or say it’s not their problem to worry about.
This is not intelligent or responsible management. It’s weak, short-sighted policy that over time constitutes dereliction of duty.
Does this article mean that some punks will no longer be able to get money at almost zero percent and deposit that interest-free money into accounts that make 4%? Life isn’t fair (for punks).
Typo at “JGB back in 1019”.
Yes that was a long time ago. Not many people remember what it was like in 1019…
Thanks!
Japan gov debt deflated.
Gravity between US10Y and Japan10Y pulls Japan10Y up. The spread between US30Y and Japan30Y is getting smaller: 1.3%
SPX is up. US30Y is down at 4.8%. The bond market indicates troubles.
So how are we looking for 2026 Wolf? CAPE over 40, unemployment up 120bps and market up over 80% for 23, 24 and 25.
What are your recession indicators telling you?
My recession indicator says that a recession isn’t anywhere near.
But if the AI investment bubble bursts, we’re going to get a run-of-the-mill recession. And the markets will tank, by a lot.
Interesting. I see gold, silver and now platinum exploding at rates not seen probably ever so something is definitely going on that I’m sure will eventually surface.
They also exploded through 2011, and nothing surfaced, and then gold crashed by 50% along with other PMs. It’s just markets acting out. A PM mania is what you’re looking at.
Long-term investors in gold shouldn’t care about any of this stuff.
What Wolf said, +1.
Gold, silver, etc., tell us nothing. They are not sentient sages. Their prices are merely the expression of a bunch of buyers/sellers who know nothing (or little) more than you/we do.
Not accurate Wolf! Gold and silver exploded through a depressed market after the 09 crash which is to be expected. There’s been no time that gold and silver have exploded st these rates while markets are up 80% over 3 years. Something is going on that will become evident soon.
Another take on that question regarding the potential of a recession:
What is fundamentally wrong with the economy that would preclude reasonable sustained growth?
What is fundamentally wrong with the Dollar that would preclude the same?
They can be independent of one another, until they aren’t.
It should and deserves to crash!!
Metals activity is not at all a mania. It is a re-pricing of real assets.
Anyone who compares the current action to 2011 has absolutely no clue what is transpiring.
Gold is being hoarded by Central Banks around the world. Silver has experienced severe deficits for 5 straight years. Vaults in NY Shanghai and London are being drained. Banks and Corporations are locking down future supply directly from the miners. What is happening in both silver and platinum is clearly supply vs demand fundamentals playing out.
2011 was a mania. This is not
Bobby Douglass
1. Your comment is funny. It’s in the “this time it’s different” category. This is precisely the kind of language you’d expect to hear during a mania.
2. “Gold is being hoarded by Central Banks around the world.”
It’s not hoarded by the big central banks. Neither the Fed, nor the ECB, nor the BOJ, nor the BOE, nor the BOC…. have added ANY gold in many years.
3. Every ounce of gold that someone is buying, someone else is SELLING. What do the sellers know that we don’t?
Apparently people in Japan still believe their government. To paraphrase StarWars: “A sad devotion to the Central Bank’s religion.”
Richard Baker, Hudson Bay co, lost Lord and Taylor and Fortunoff.
HBC might lose Saks Fifth Ave and Bergdorf Goodman. He is worse than Sears Eddie Lampert.
“Fraid to say” that Japan will be one of the casualties of the new world order. BOJ is trying to right their monetary ship; but too little way too late.
Recent ugly exchange between Japan and China over islands near each, as well as Taiwan only confirms the longstanding hatred between these two countries is still intact.
China’s goal is clean the clock of the past/current manufacturing titans including Germany, US and Japan. I believe they will succeed.
With respect to Japan, besides having this massive QE overhang, a severely aging population (and no immigration) will only assist in their loss of competiveness.
As one example, I am looking to buy a compact tractor for my mini-farm. Kubota has been the clear leader for decades but is fast losing that spot due to high pricing. Tractors from Korea and India are making big inroads in the US. Quality is closely comparable and price is signficantly lower. China is equal also, but will be banned from US.
Compact tractors are the tip of the iceberg, I believe.
Keep your eyes on gold. It appears as though we have entered a new phase where people are waking up to the value of this asset, including, I’m sure ordinary people in Japan. Fiat is going to continue to flow into gold; something China has been planning for over the past decades. Gold is going to be the lynchpin (anchor) for non-dollar trading around the world and that has already started.
Japan will not go away. Nor will the US and other past strong economies. They will simply lose their wealth to the new order. Based on how obscene wealth displays in the US, I’m not sure that will be all bad for us.
During this insanity me stacks of silver and gold keep going up (in fiat dollars)value wise.
I was hoping that would not happen and economic sanity make a return but here we are.
Merry Christmas all here and Merry Christmas to the world.
Interesting to see a central bank’s efforts to control all segments of the yield curve. There was a Reuter’s article in March 2025 entitled “BOJ to cut buying of super-long bonds (10-25 years left to maturity) for first time in taper plan… it kept the level for bonds with more than 25 years to maturity unchanged”
Difficult to find discussions like this about the Fed.
1. “Difficult to find discussions like this about the Fed.”
No, it’s not difficult; they’re all here on this site. All you have to do is read them. It’s right here on this site.
I cover all those things in details and in charts, both for the BOJ and the Fed. You can see all Fed articles here:
https://wolfstreet.com/category/all/federal-reserve/
Here is the most recent quarterly BOJ balance sheet discussion (Oct 7), with detailed charts and data:
https://wolfstreet.com/2025/10/07/bank-of-japan-balance-sheet-qt-accelerates-148-billion-in-q3-407-billion-from-peak-will-sell-etfs-reits-sold-all-bank-stocks/
2. “BOJ to cut buying of super-long bonds (10-25 years left to maturity) for first time in taper plan…”
What else is it going to cut? Treasury bills? The BOJ has almost none of them. The average maturity of its bond holdings is over 9 years. In doing QT, much of what rolls off without replacement are these maturing long bonds, by definition due to the structure of its holdings.
From the standpoint of the banking system, all monetary savings are frozen, as banks always create new money when they lend/invest. The Japanese save more and keep more of their savings impounded in their banks than other countries. The BOJ also guarantee’s all transaction deposits.
Japan’s money velocity has been trending down for years. It’s probably reversing now.
U.S. Bonds are vulnerable. The means-of-payment money supply just soared in November. M2 didn’t change much. But there was an unusual seasonal shift from TDs (time deposits) to DDs (demand deposits). Changes my forward look.
No surprise that nominal GDP rose to 8.2 percent. R-gDp rose by 4.3 percent in the 3rd qtr.
Feels like there’s nowhere to hide in terms of currencies and bonds.
The yen is absolutely sinking compared to the USD, thanks to negative real interest rates. The memories of deflation and lost decades mean those negative real interest rates might not change soon, but do you really want to own 30y Japanese bonds and hope demand for yen or yen denominated bonds holds up? Too risky for me!
The USD, meanwhile, is the currency every central bank seems to be diversifying away from, and a new commodity class – gold, silver, platinum, copper, natural gas – seems to pop up every day as having been undervalued. Actually, it just means the USD is losing its value in the world – just at an uneven pace in the terms of which prices move where.
And as the US devalues its dollar, other countries are encouraged to follow suit in order to not change trade balances or lose strategic advantages. It’s a race to the bottom in terms of money printing. I can’t identify any country that cannot conclude they’d be better off matching the USD’s devaluation. Even fiscally responsible countries have to think about their export markets.
Yea there’s gold. I own a lot of it. But I am aware this is greater-fool-theory speculation. I wish I could find productive assets denominated in a currency that’s not going to be destroyed by its own government.
Wolf, what is your opinion of Ray Dalio’s work?
You’ve probably been asked this before, but the rapid depreciation of the yen, the Japanese government’s efforts to prop it up while maintaining negative real rates, and the debt forcing them to take this route sound very much like the process Dalio describes how empires go broke.
I wonder if Japan’s present might be the US’s future.
I don’t think Japan and the US can be compared like that. Japan is a very different setup, with different issues and strengths, in many ways, than the US.
But even in Japan, they ended YCC and switched to QT and rate hikes because YCC and 0% were threating to blow up that very special system. Longer-term interest rates have come up a lot and will likely come up further – so is the US going that route? That’s how you should have phrased your question.
Yea I think long term rates *should* rise. The people accepting sub-5% yields on the US’s spiraling 10-30 year debt are tragically heroic, considering that annualized inflation was rising at a 0.1% per month pace before we were cut off from reliable data a quarter ago. But yields seesawed in 2025 because markets thought a recession was imminent for most of the year.
An early clue is how long term rates have been moving the opposite direction as the FFR after every cut. Every cut means higher inflation being priced in.
But if Dalio is right, this eventually turns into a Minsky Moment / Liz Truss moment. 2025 was not the year for that, but 2026 could be.
*denotes a potentially expensive word.