Everyone is talking about the AI bubble – proclaiming it or denying it – but this is what it looks like from the leverage point of view.
By Wolf Richter for WOLF STREET.
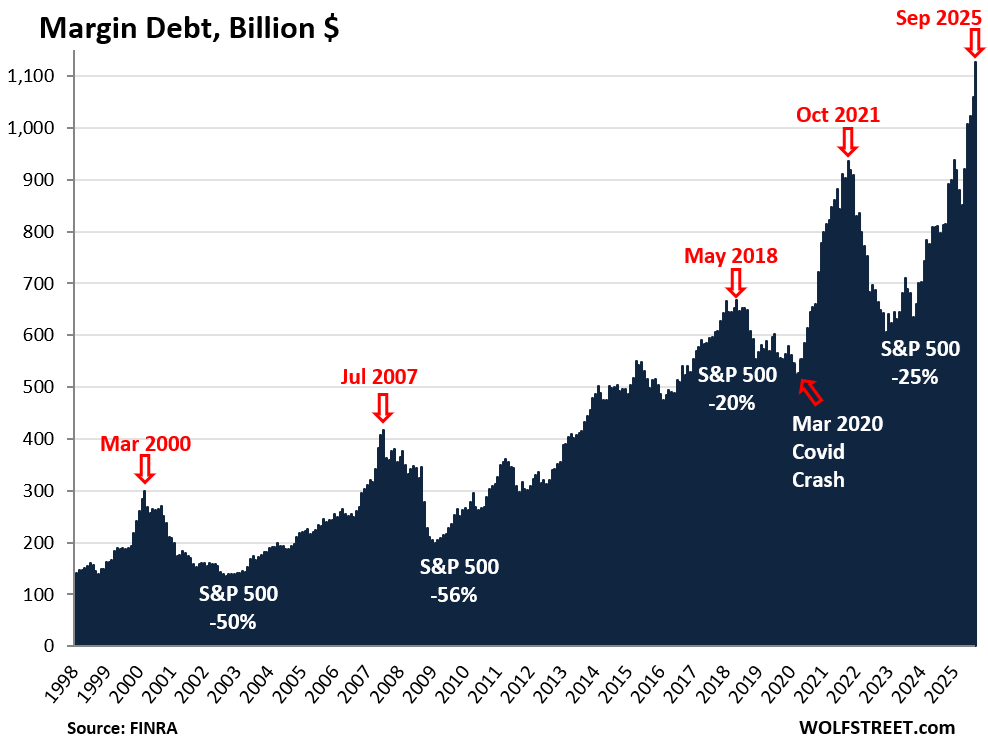
Leverage in the stock market has been spiking since April. In September, margin debt – the amount investors borrowed from their brokers – spiked by another 6.3%, or by $67 billion, from August to a record $1.13 trillion.
Since April, margin debt has spiked by 39%, the biggest five-month increase since October 2021; it was in early November 2021 that stocks began to tank, with the S&P 500 ultimately dropping by 25%.
The additional leverage – borrowed money flowing into the stock market – creates buying pressure and drives stock prices higher. Leverage is the great accelerator on the way up, but it’s also the great accelerator on the way down. Multi-month surges in margin debt, jumping from new high to new high, indicate excessive speculation and risk-taking and have invariably led to sharp selloffs:
Everyone has been talking about the AI bubble, either proclaiming it or denying it – Is it Really Different this Time? – but this is what it looks like from the leverage point of view, and it’s scary: A massive spike in risk-taking and excessive speculation in the stock market, as demonstrated by this multi-month spike in margin debt from record to record, that is creating big vulnerabilities and risks.
In the long-term view of margin debt, such as in the chart above, it’s not the absolute dollar amounts that matter, but the steep spikes in margin debt from new high to new high over a multi-month period.
The annotations in the chart:
March 2000 was the beginning of the Dotcom Bust, during which the S&P 500 fell by 50% and the Nasdaq by 78%.
July 2007 was just before the stock market started tuning into the beginning of the Financial Crisis, during which the S&P 500 fell by 56%.
May 2018 was followed by a 20% decline in the S&P 500 by late 2018.
October 2021 led to a 25% decline of the S&P 500.
March 2020 was the Covid crash, caused by investors’ reaction to the pandemic. At the time, leverage was relatively low and had been declining, which was a good thing and protected the market. If leverage had been spiking for five months from record to record before the pandemic, the sell-off would likely have been much more severe.
Enjoy reading WOLF STREET and want to support it? You can donate. I appreciate it immensely. Click on the mug to find out how:

![]()
Let’s see where this will go…all the warning signs are out there plain as day but yet plenty of people treating it like it’s another nothing burger, every single dip follow by twice the velocity of FOMO buy the dip rally, rinse and repeat….guess the lack of any real moral hazard or long term sustain consequences like that of dotcom recently, couple with just buy index funds and you’ll be just fine mentality got us to where we are at now….
This time is different right? hmm…
Thanks Wolf. It’s charts like these which I only saw after the sell off in 2008. They made me regret not seeing the obvious warning signs of an overvalued stock market.
Good Chart, We need to see through the Lens of Margin Debt to Market Cap $1.1T to $63T in MCap ie. 1.7% is much lower than 2.7% in 2007-08…So the Bubble has more Legs to Run :-)
That’s not how it works. You’re abusing the chart. This is how it works, second paragraph under the chart:
“In the long-term view of margin debt, such as in the chart above, it’s not the absolute dollar amounts that matter, but the steep spikes in margin debt from new high to new high over a multi-month period.“
Brilliant chart. Thanks, Wolf.
Measured as a percentage of market cap, margin loans were —
2.1% in March 2000,
2.8% in July 2007,
2.4% in May 2018,
2.0% in Oct 2021, and
1.7% in Sept 2025.
Source: gurufocus
In line with Wolf’s argument, most of these prior peaks were preceded by a sharp run-up in the margin debt / market cap ratio. The monthly figure was 1.3% in August 2024 (which was the lowest since 1998) but has since risen persistently each month (with one exception — April 2025) to reach 1.7% as of end-September.
Is that 2% line the Crack of Doom? Or should we worry more about the parabolic increase over the past year? Asking these rhetorical questions for a rhetorical friend who discloses that he/she/they is/are still up there dancing the AI lambada.
That’s not how it works. You’re abusing the chart. This is how it works, second paragraph under the chart:
“In the long-term view of margin debt, such as in the chart above, it’s not the absolute dollar amounts that matter, but the steep spikes in margin debt from new high to new high over a multi-month period.“
Most people on Wall Street are too young to have seen 2008 & 2000 depression.
I say Depression as both were very much an economic depression to me. I got cleaned out in both.
The lesson I learned? A fool & his money are soon parted. I was that fool who thought real estate could never go down in 2008. And that fool who invested in Nortel & Cisco in 2000. Boy, did I get that wrong.
This time I’m fully hedged for a crash.
T.I.P.S, I bonds, cash, T-bills, long bonds, ammo, guns, water, land for a garden, every Led Zepplin album & Gadstone flags.
Your jealous, I know.
What a great chart in pictures. And the commentary from Wolf that the key is not the absolute numbers but the parabolic shape.
Option activity is also experiencing a significant rise especially with the proliferation of leveraged etfs . Tqqq maybe one of the largest was created in 2010. Pretty much the bottom of the GFC drop and the start of QE. Impeccable timing to have created a product with leverage with the rise tech money printing era. Manage risk my recommendation .