And they fell in 21 of our 33 metros: Tampa, Austin, Miami, San Diego, Los Angeles, San Jose, San Francisco, San Antonio, Dallas, Phoenix, Orlando, Atlanta, Denver, Raleigh, Houston, Seattle… Others up YoY: Boston, Chicago, New York, Philadelphia… A few hit new highs.
By Wolf Richter for WOLF STREET.
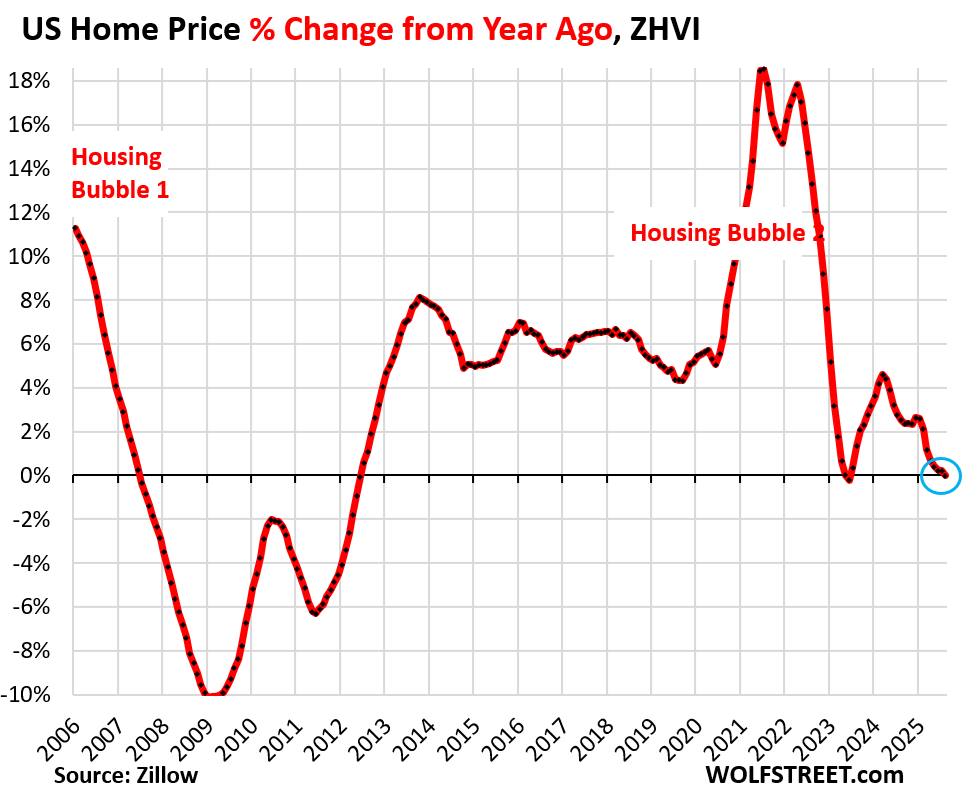
At the national level, prices of mid-tier single-family homes, condos, and co-ops declined year-over-year in August, the first decline since June 2023, and both were the first declines since the Housing Bust.
But prices moved in different directions among the 33 large and expensive metropolitan statistical areas (MSAs) that we track here: 21 had year-over-year (YoY) declines in July, up from 6 at the end of 2024. And in 23 of our 33 metros, prices were down from their peaks in prior years. But in a few others, prices inched up to new records.
The 21 metros of our 33 metros with year-over-year price declines:
The five metros with the biggest year-over-year declines among our 33 metros were in Florida and Texas.
Year-over-year declines in August:
- Tampa: -6.1%
- Austin: -5.8%
- Miami: -4.3%
- Orlando: -4.1%
- Dallas: -3.8%
- San Francisco: -3.8%
- Phoenix: -3.6%
- San Antonio: -3.2%
- Atlanta: -3.0%
- Denver: -2.8%
- San Diego: -2.5%
- Raleigh: -2.2%
- Sacramento: -2.0%
- Houston: -1.9%
- San Jose: -1.7%
- Honolulu: -1.7%
- Charlotte: -0.9%
- Portland: -0.7%
- Seattle: -0.6%
- Los Angeles: -0.4%
- Nashville: -0.1%
The 23 metros of our 33 whose prices are down from their highs in 2022 and 2024.
The peaks of 17 metros were in 2022; the peaks of the remaining 6 were in 2024 (Miami, San Diego, Atlanta, Charlotte, San Jose, Los Angeles).
Percentage declines from their respective highs in prior years:
- Austin: -23.2%
- San Francisco: -10.7%
- Phoenix: -10.5%
- San Antonio: -8.4%
- Denver: -7.2%
- Sacramento: -7.1%
- Tampa: -6.7%
- Dallas: -6.5%
- Honolulu: -5.2%
- Portland: -4.8%
- San Jose: -4.8%
- Orlando: -4.4%
- Miami: -4.3%
- Seattle: -4.1%
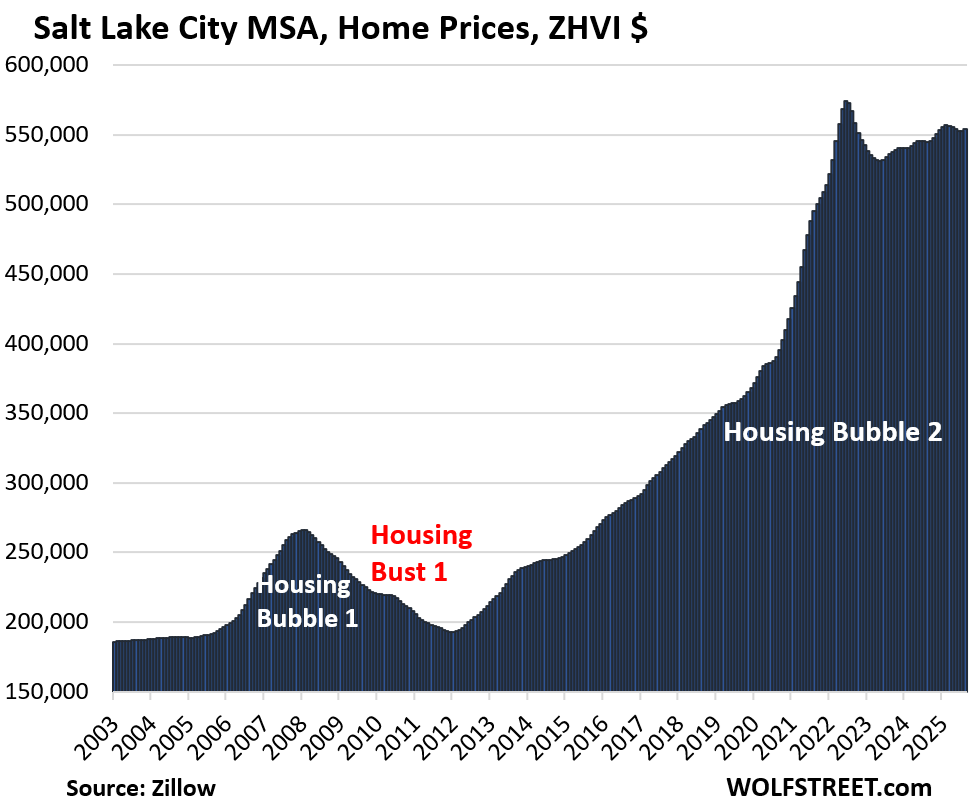
- Salt Lake City: -3.7%
- Raleigh: -3.5%
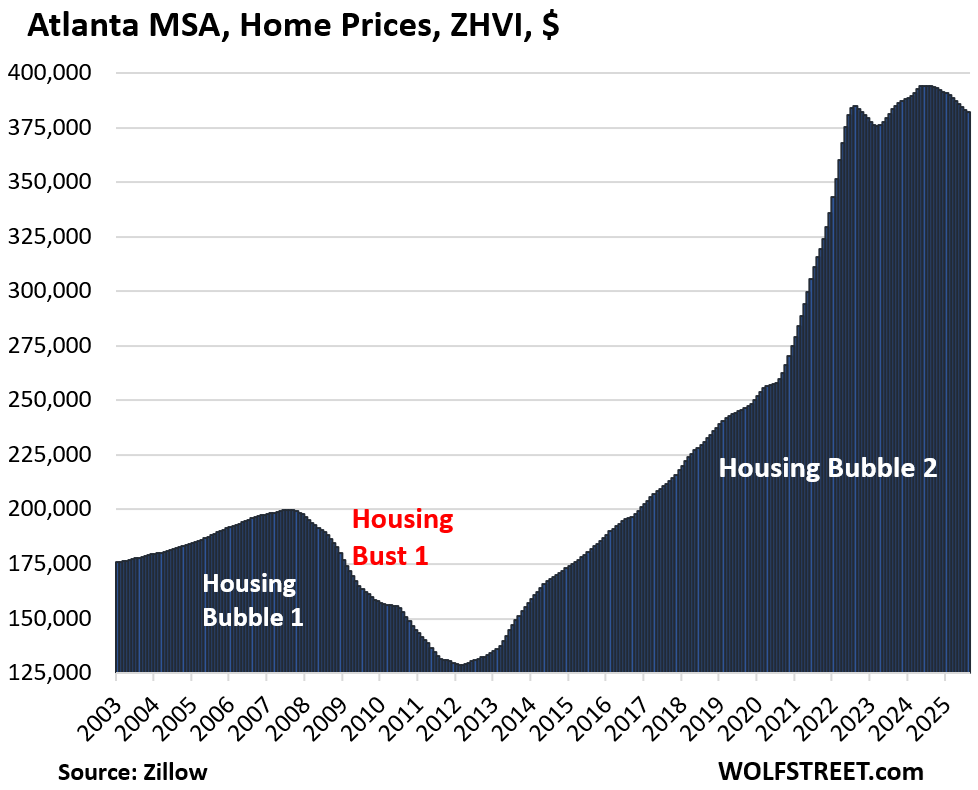
- Atlanta: -3.1%
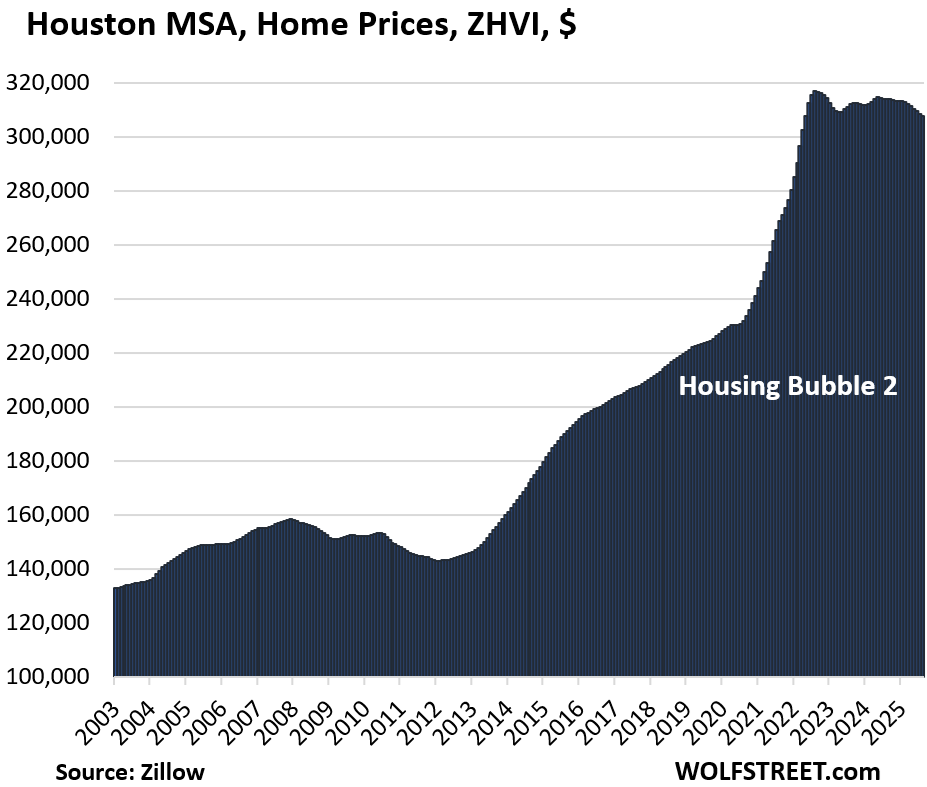
- Houston: -2.8%
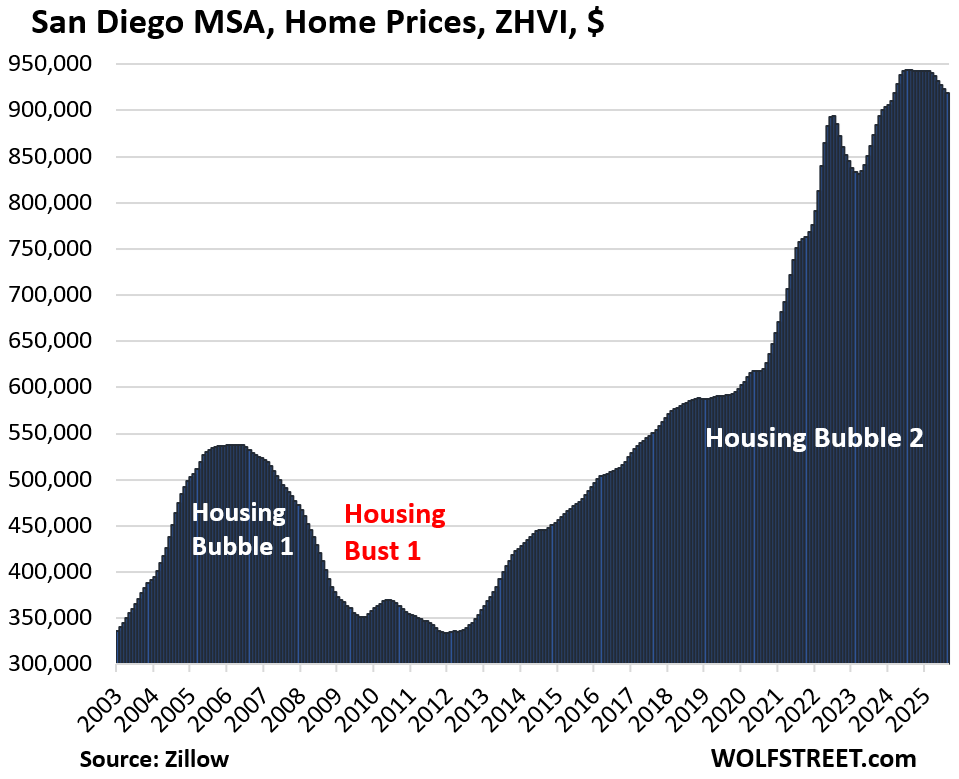
- San Diego: -2.6%
- Las Vegas: -2.5%
- Los Angeles: -2.5%
- Nashville: -1.7%
- Charlotte: -1.0%
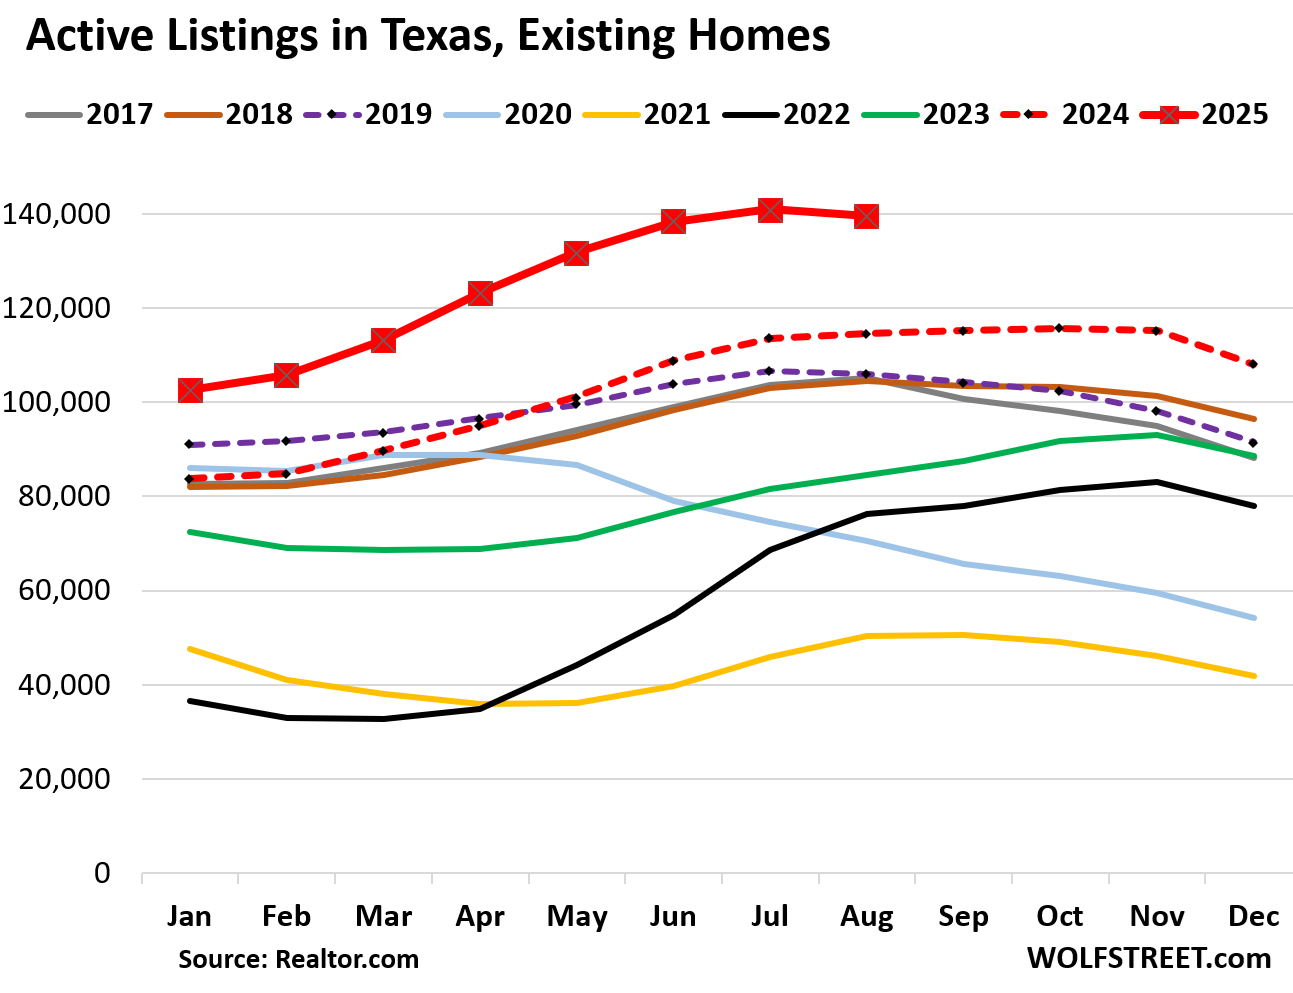
Prices skidded in many markets because supply of existing homes has surged and demand has plunged. And homebuilders have been aggressively building inventory, and that inventory of new homes for sale reached the highest level since 2008, and in the South the highest level ever.
Methodology: All pricing data here for the 33 metropolitan statistical areas (MSA) is from the seasonally adjusted three-month-average mid-tier Zillow Home Value Index (ZHVI), released today. The ZHVI is based on millions of data points in Zillow’s “Database of All Homes,” including from public records (tax data), MLS, brokerages, local Realtor Associations, real-estate agents, and households across the US. It includes pricing data for off-market deals and for-sale-by-owner deals. Zillow’s Database of All Homes also has sales-pairs data.
All data here about active listings is from Realtor.com.
To qualify for this list of 33 most splendid housing bubbles, the MSA must be one of the largest by population and must have had a ZHVI of at least $300,000 at some point. Some metros that are large enough don’t qualify for this list because their ZHVI has never reached $300,000, despite the blistering surge of home prices in recent years, such as the metros of New Orleans, Memphis, Oklahoma City, Tulsa, Cincinnati, and Pittsburgh.
The 33 Most Splendid Housing Bubbles.
In the little tables, MoM = month over month; YoY = year-over-year. In the column furthest to the right: the percentage increase “since 2000.”
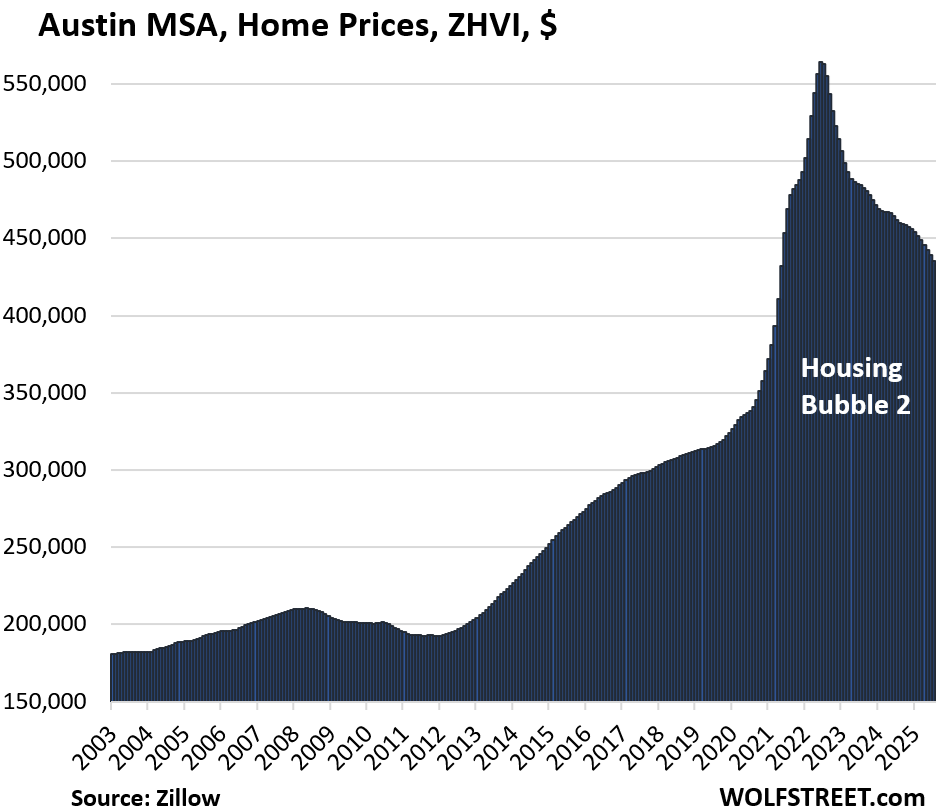
| Austin MSA, Home Prices | |||
| From Jun 2022 peak | MoM | YoY | Since 2000 |
| -23.2% | -0.5% | -5.8% | 149% |
The lowest since May 2021.
From January 2020 through June 2022, prices in the Austin-Round Rock-San Marcos metro exploded by 73%. This price explosion documents the absurdity that the housing markets had become under the Fed’s reckless free-money monetary policy until 2022 – and when money is free, prices don’t matter.
Here is what active listings in Texas look like:
| San Francisco MSA, Home Prices | |||
| From May 2022 peak | MoM | YoY | Since 2000 |
| -10.7% | -0.6% | -3.8% | 283% |
The San Francisco-Oakland-Fremont metro includes San Francisco, much of the East Bay (such as Oakland), much of the North Bay, and goes south on the Peninsula into Silicon Valley through San Mateo County. It does not include the San Jose metro, which covers the southern portion of the Bay Area (see below).
From January 2020 through June 2022, prices exploded by 33%.
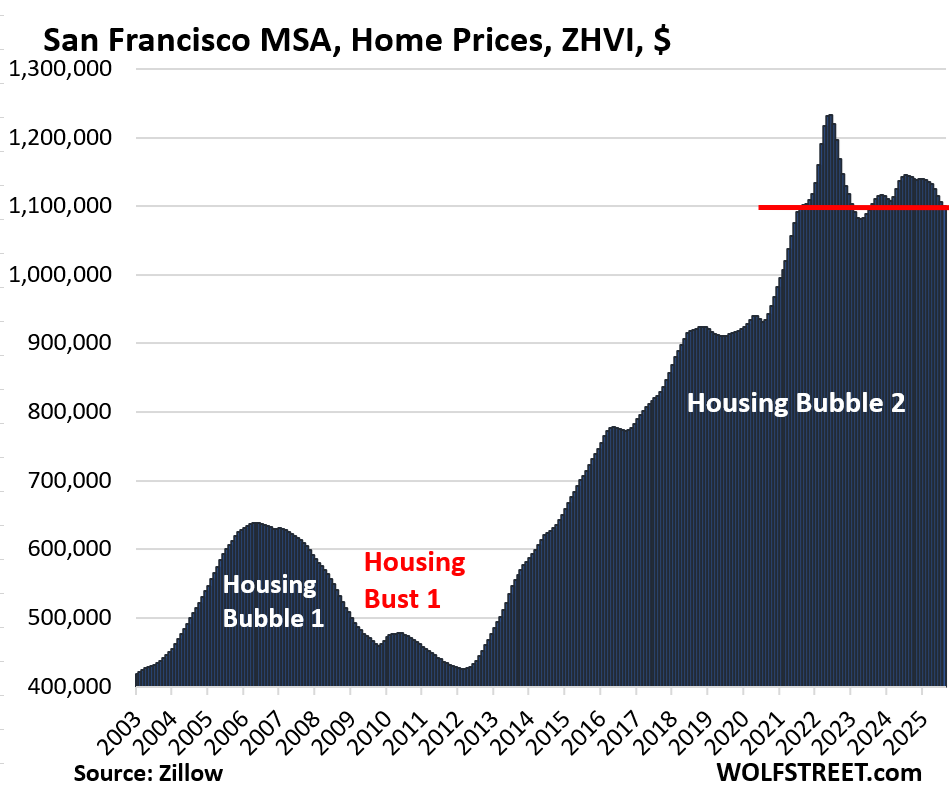
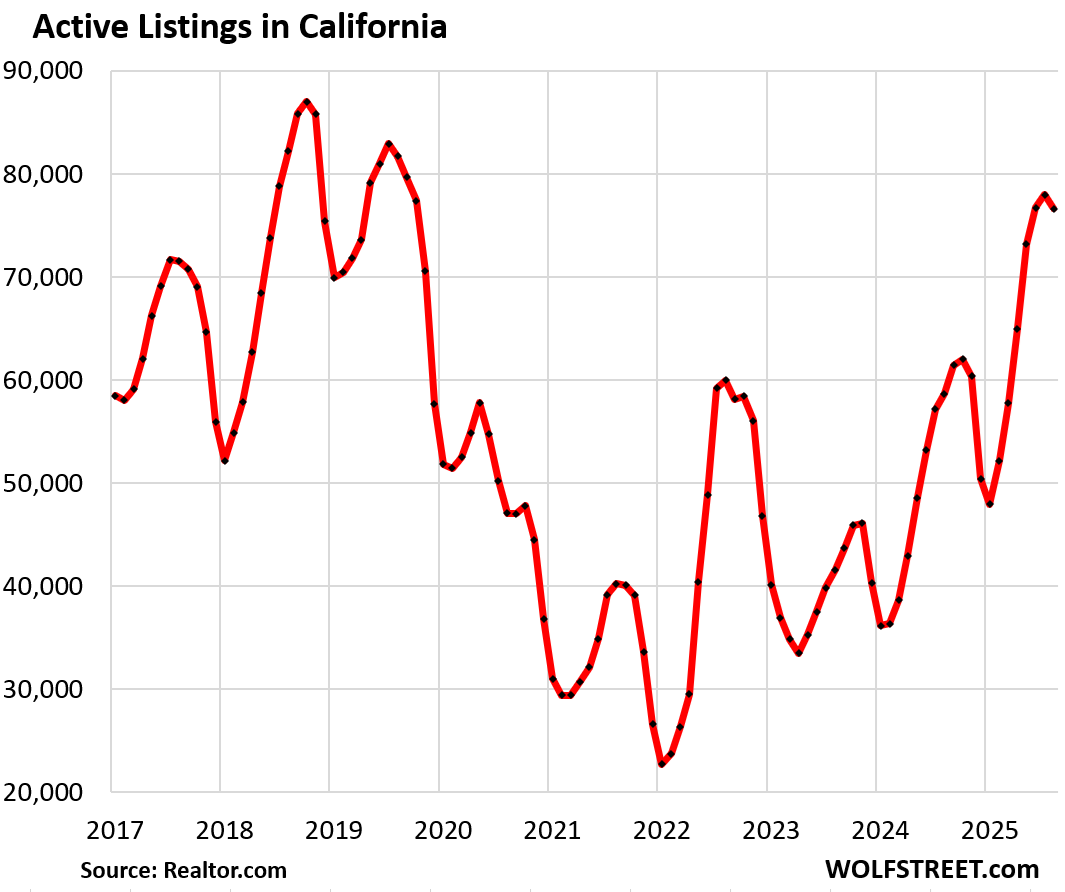
Inventory across California has been surging. And homes now spend more time on the market before they’re delisted or sold for this time of the year than in well over a decade.
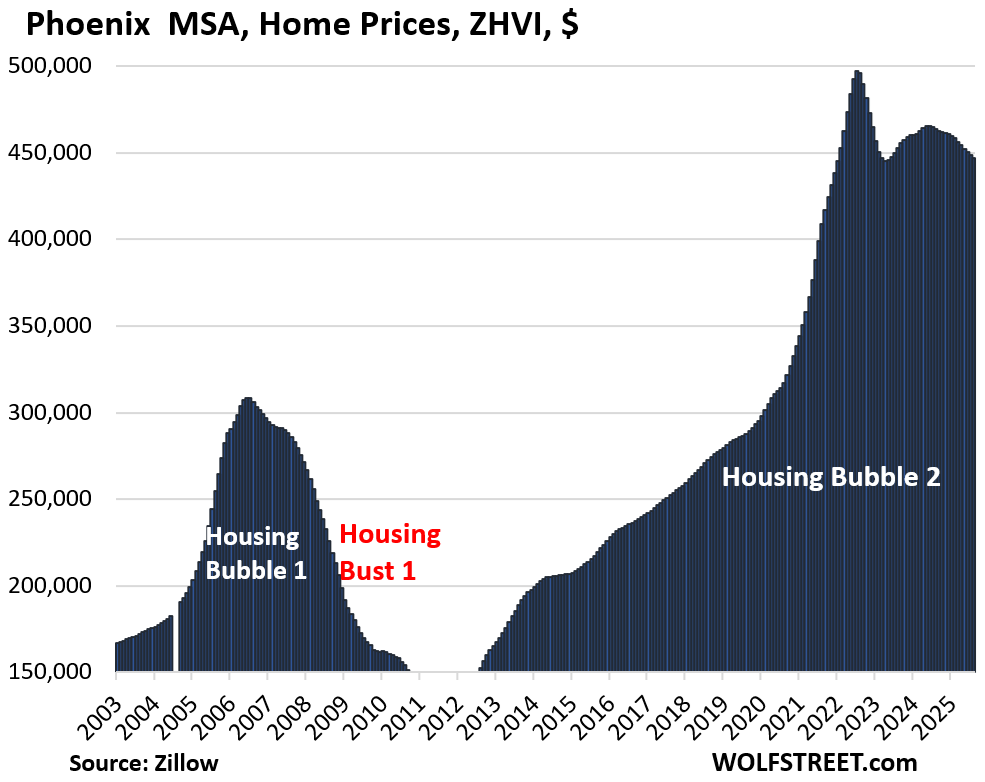
| Phoenix MSA, Home Prices | |||
| From Jun 2022 peak | MoM | YoY | Since 2000 |
| -10.1% | -0.4% | -3.6% | 212% |
Prices exploded by 65% from January 2020 through June 2022.
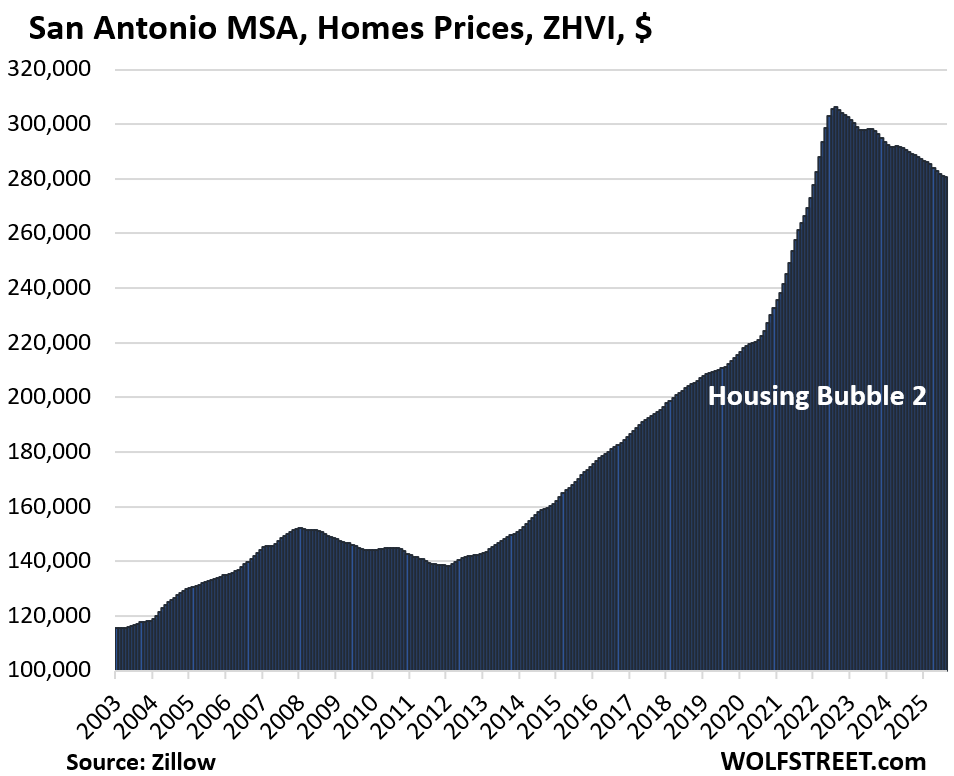
| San Antonio MSA, Home Prices | |||
| From Jul 2022 peak | MoM | YoY | Since 2000 |
| -8.4% | -0.2% | -3.2% | 144% |
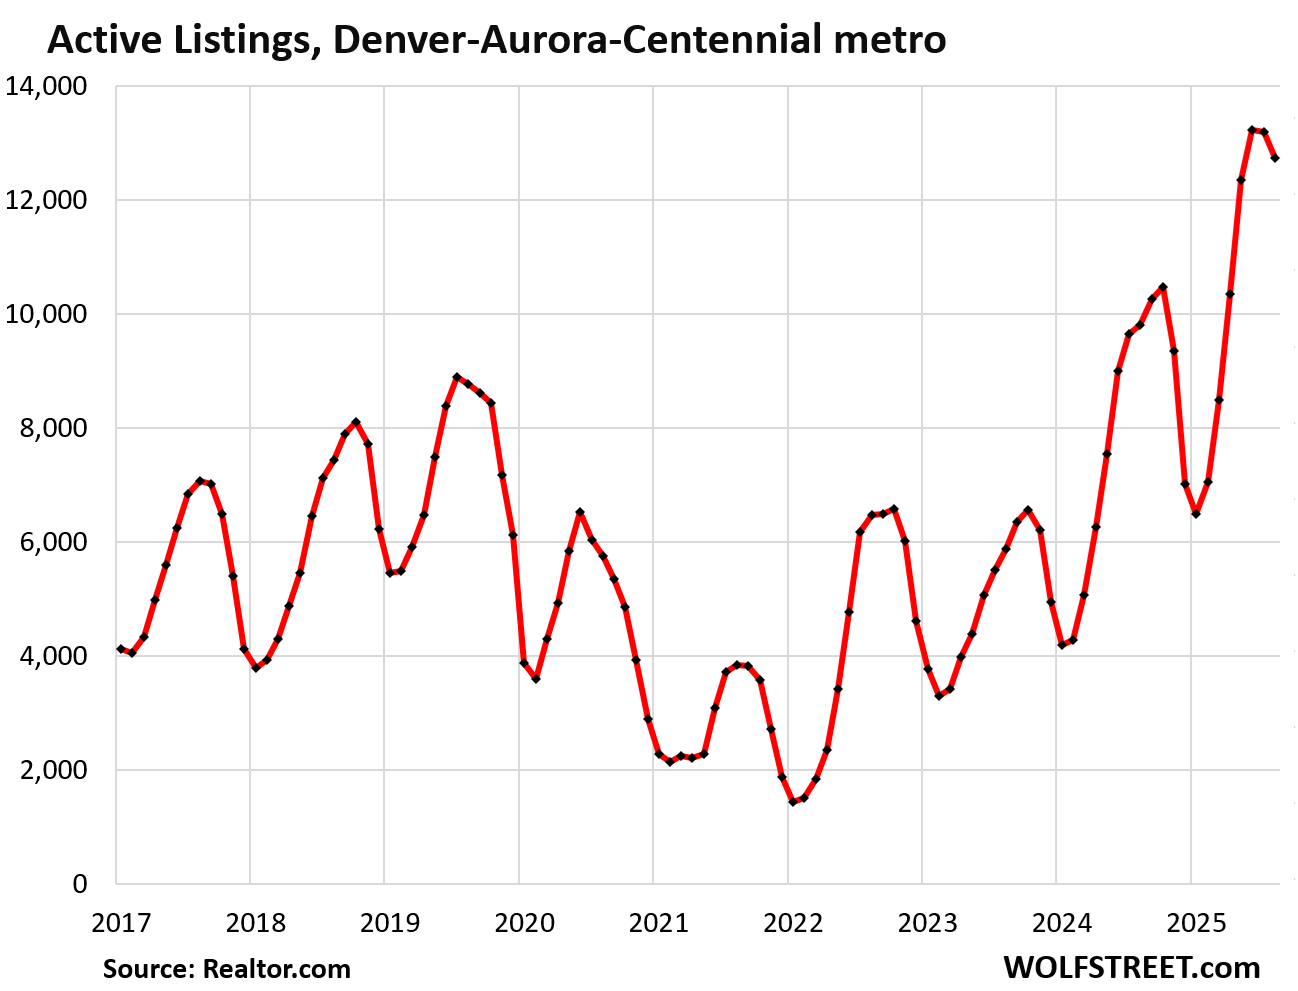
| Denver MSA, Home Prices | |||
| From Jun 2022 peak | MoM | YoY | Since 2000 |
| -7.2% | -0.2% | -2.8% | 203% |
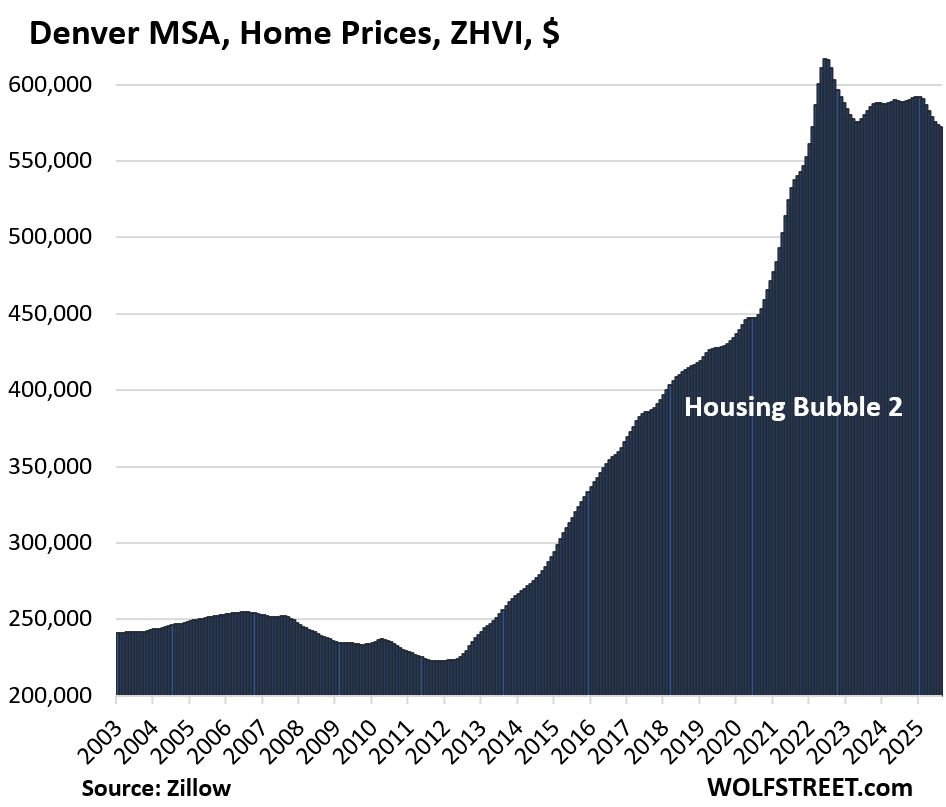
And inventory in the Denver MSA:
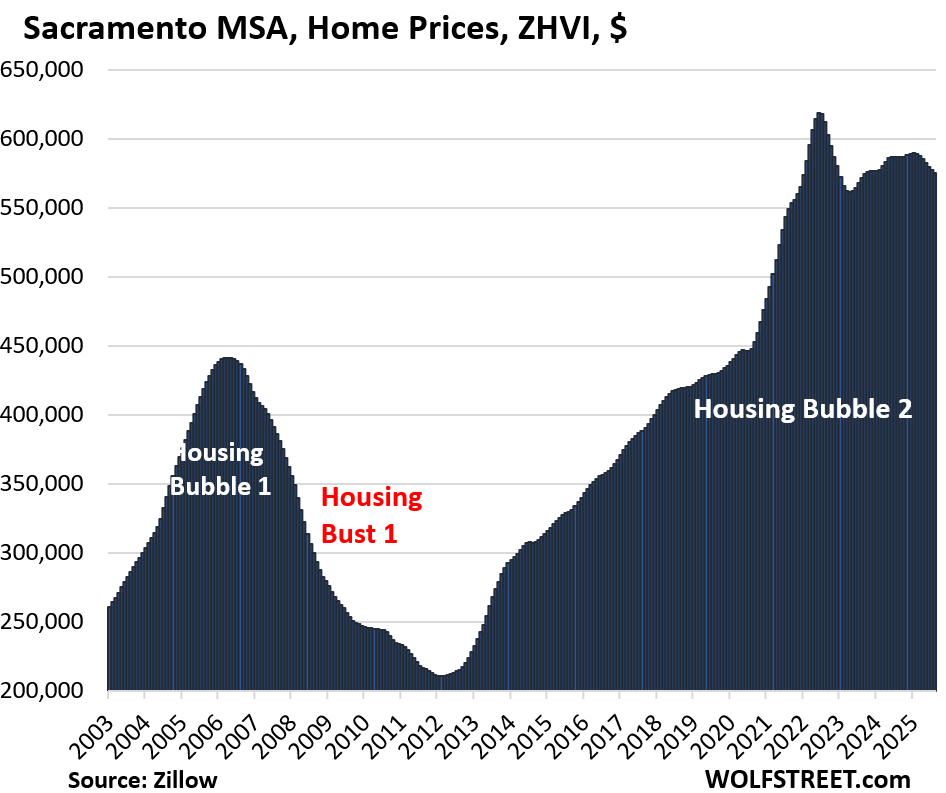
| Sacramento MSA, Home Prices | |||
| From July 2022 peak | MoM | YoY | Since 2000 |
| -7.1% | -0.4% | -2.0% | 239.9% |
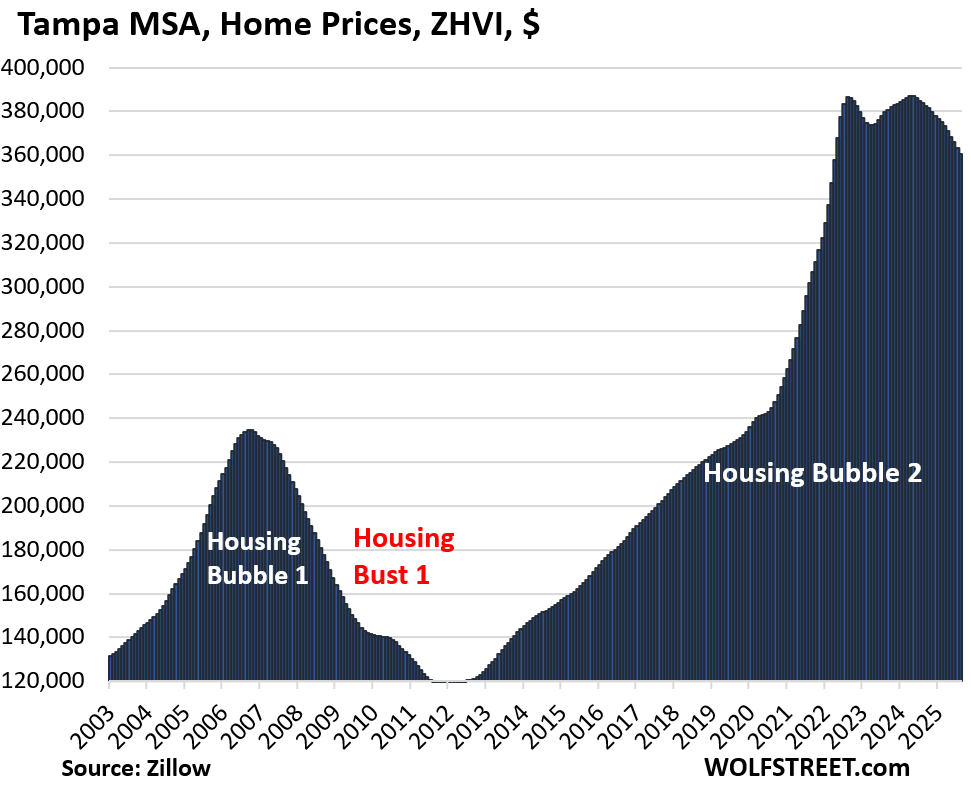
| Tampa MSA, Home Prices | |||
| From Jul 2022 peak | MoM | YoY | Since 2000 |
| -6.7% | -0.7% | -6.1% | 256% |
Prices exploded by 60% between January 2020 and June 2022.
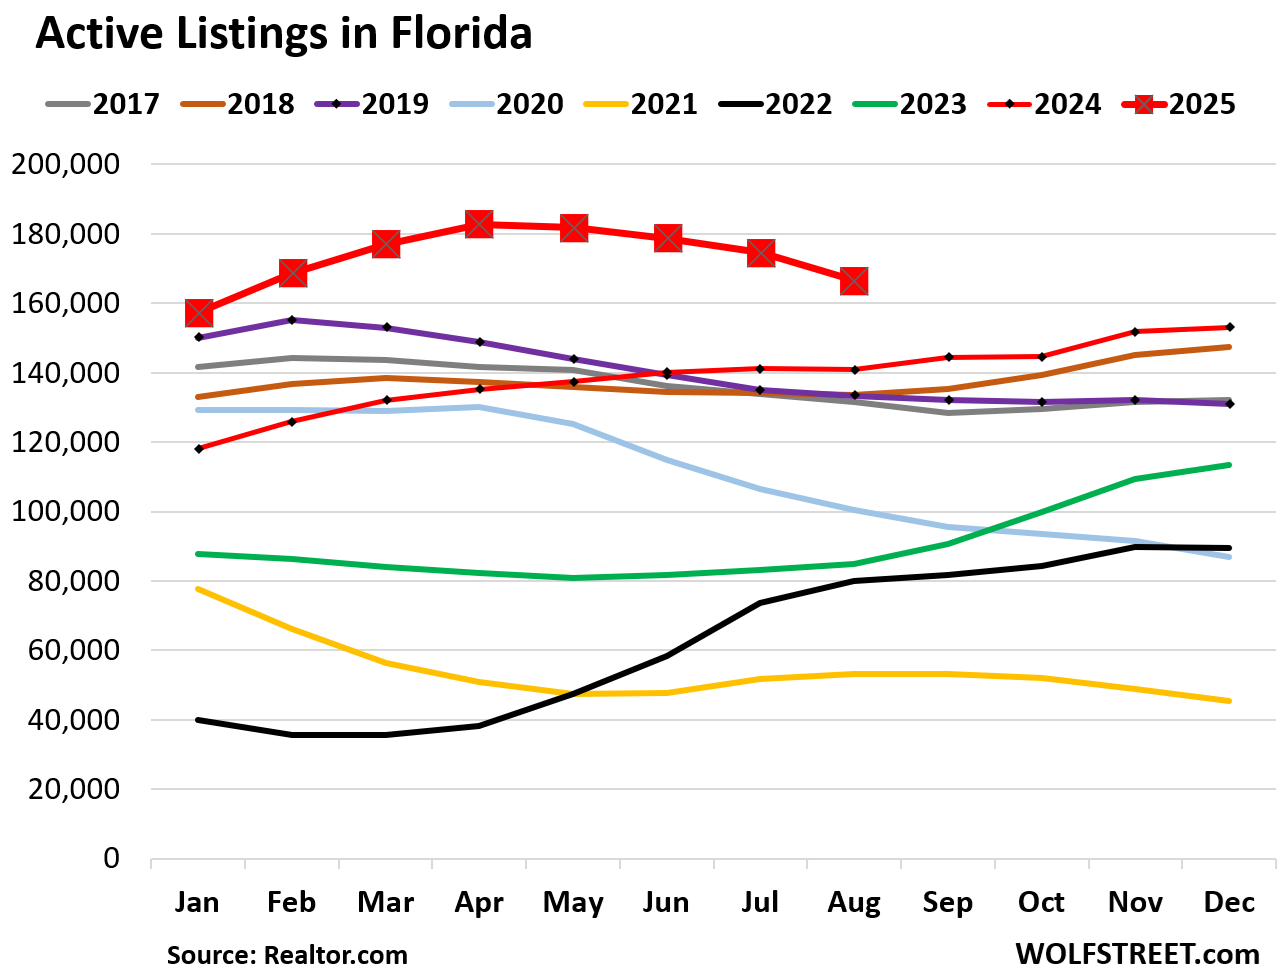
Active listings in Florida have been all year at the highest levels in well over 10 years:
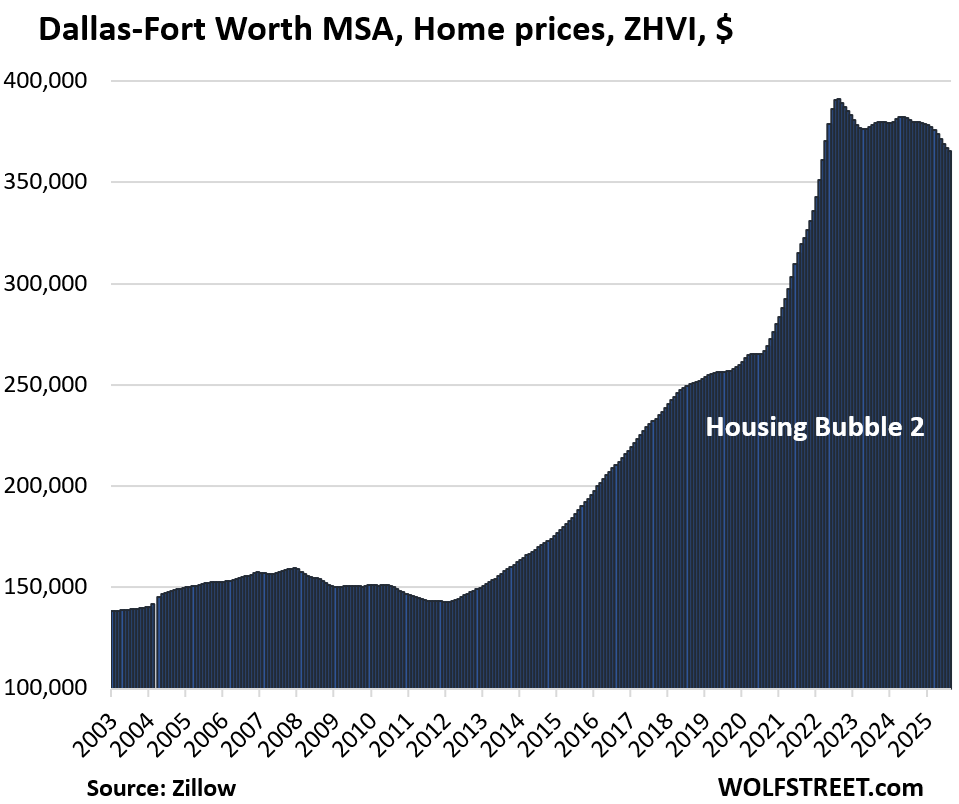
| Dallas-Fort Worth MSA, Home Prices | |||
| From Jun 2022 peak | MoM | YoY | Since 2000 |
| -6.5% | -0.4% | -3.8% | 184% |
Prices exploded by 48% between January 2020 and June 2022.
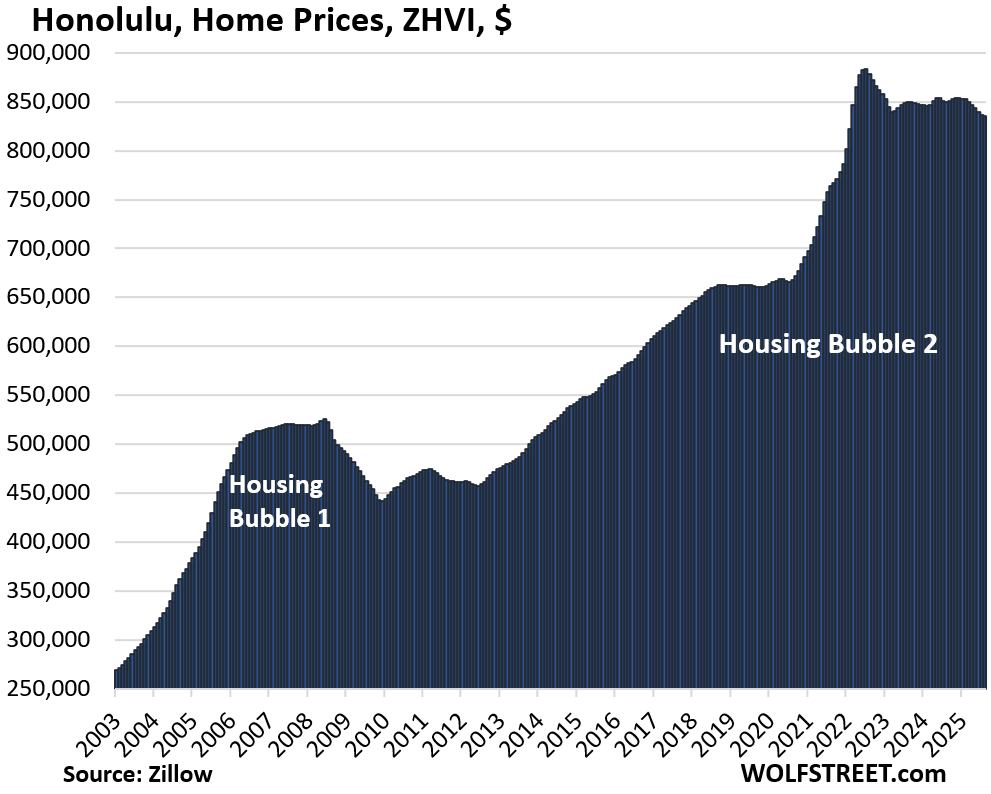
| Honolulu, Home Prices | |||
| From Jun 2022 peak | MoM | YoY | Since 2000 |
| -5.4% | -0.2% | -1.7% | 275% |
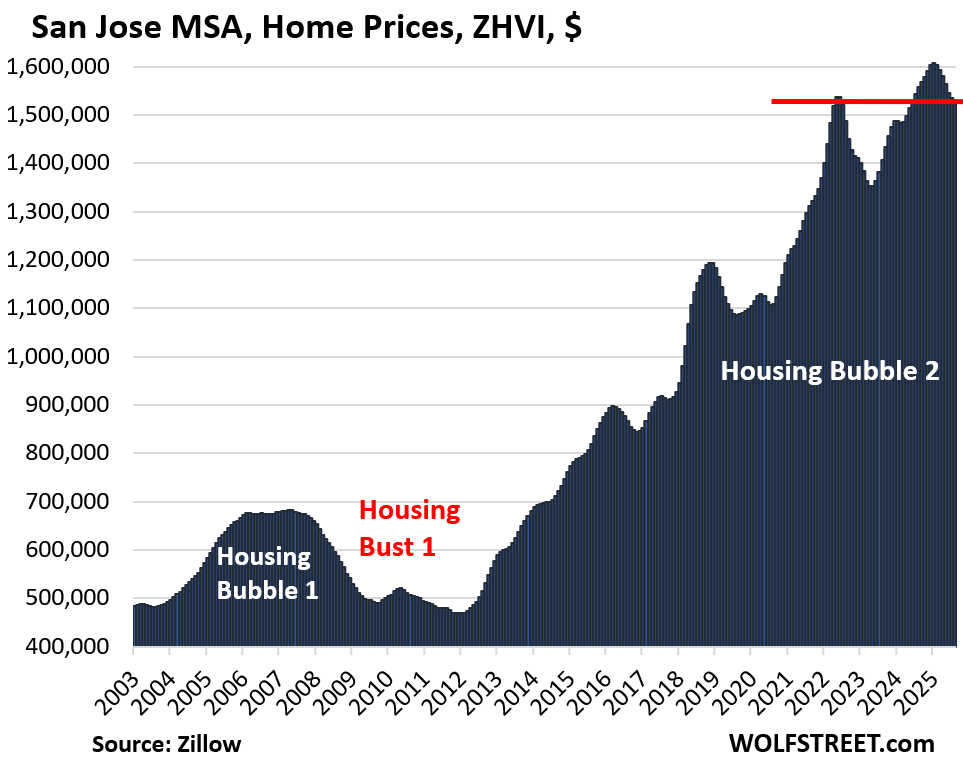
| San Jose MSA, Home Prices | |||
| Fr Dec 2024 high | MoM | YoY | Since 2000 |
| -4.8% | -0.2% | -1.7% | 326% |
Back to March 2022.
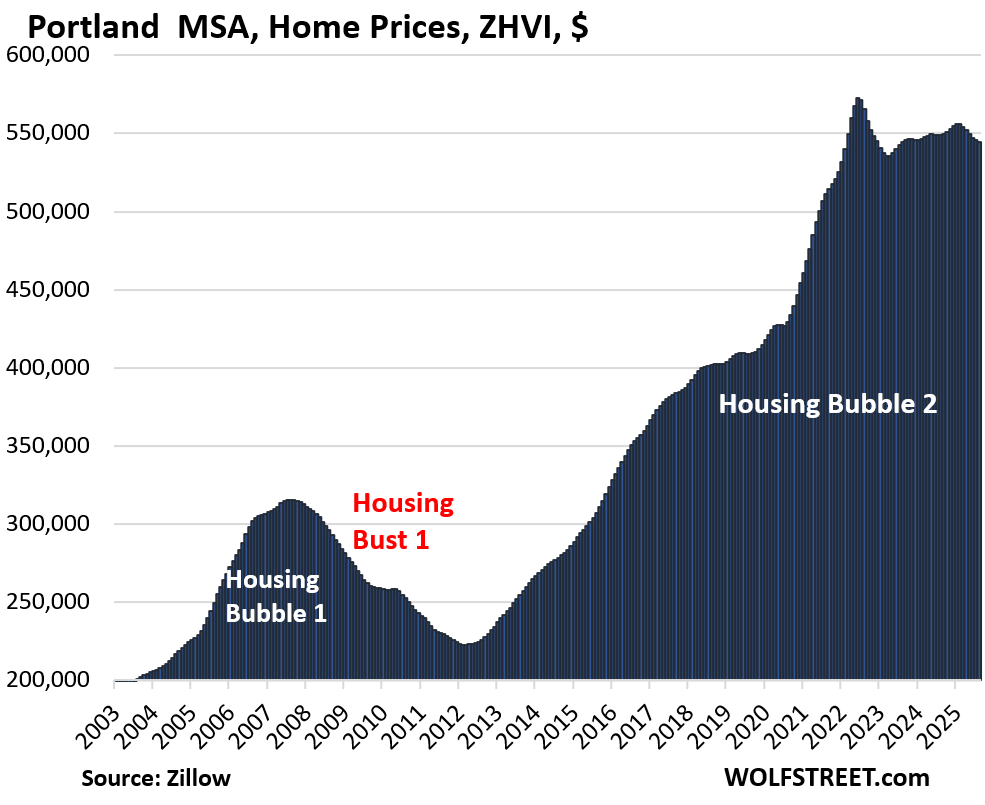
| Portland MSA, Home Prices | |||
| From May 2022 peak | MoM | YoY | Since 2000 |
| -4.8% | -0.2% | -0.7% | 212% |
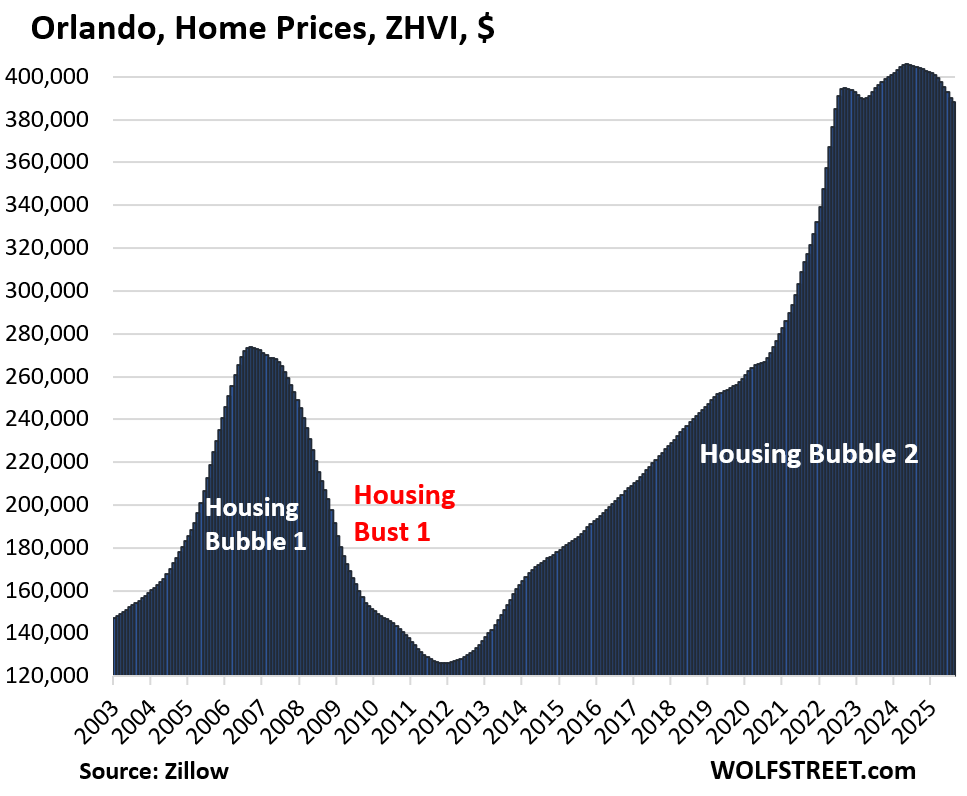
| Orlando MSA, Home Prices | |||
| From June 2022 | MoM | YoY | Since 2000 |
| -4.4% | -0.6% | -4.1% | 226% |
Prices exploded by 48% between January 2020 and June 2022.
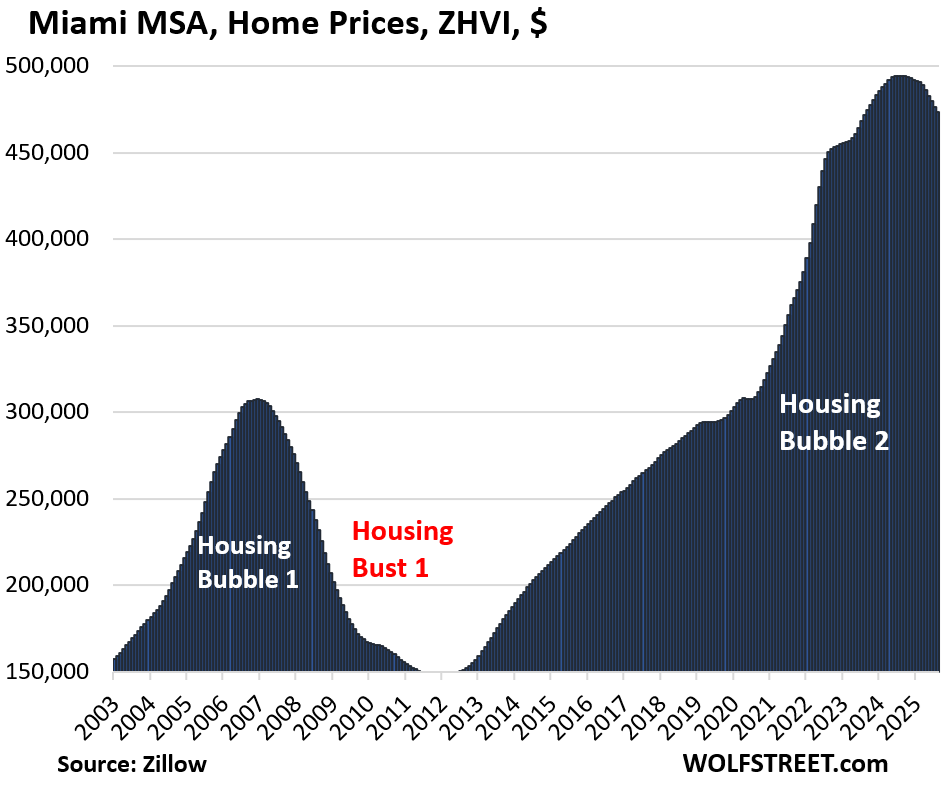
| Miami MSA, Home Prices | |||
| Fr Sep 2024 peak | MoM | YoY | Since 2000 |
| -4.3% | -0.6% | -4.3% | 315% |
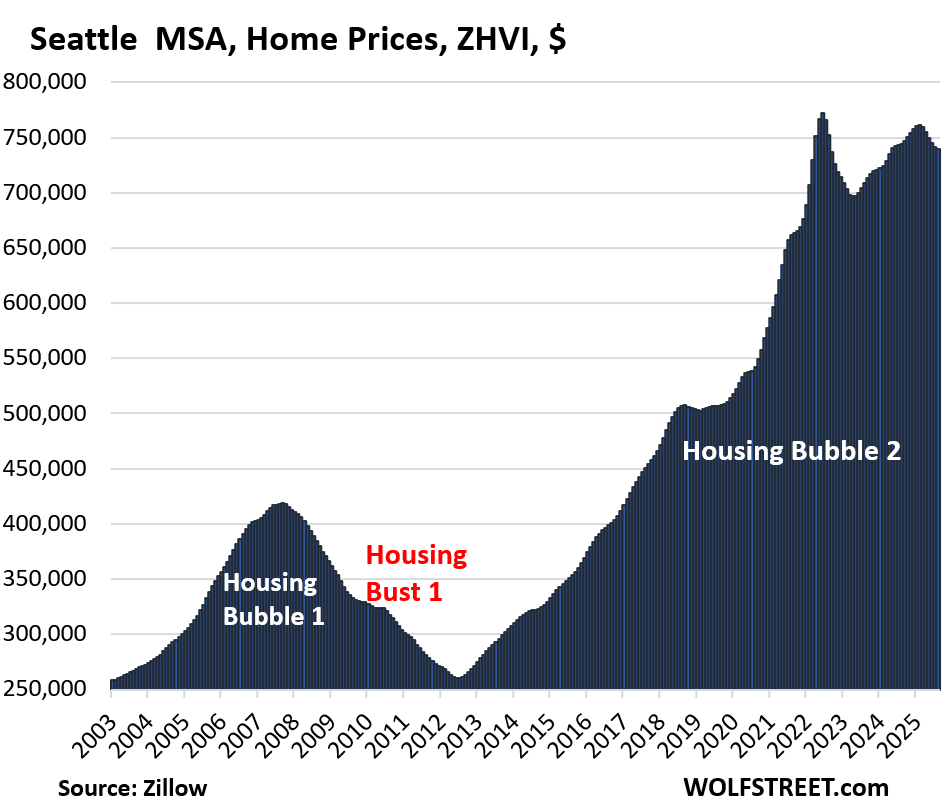
| Seattle MSA, Home Prices | |||
| From May 2022 peak | MoM | YoY | Since 2000 |
| -4.1% | -0.2% | -0.6% | 232% |
In the 2.5 years through June 2022, home prices had exploded by 49%.
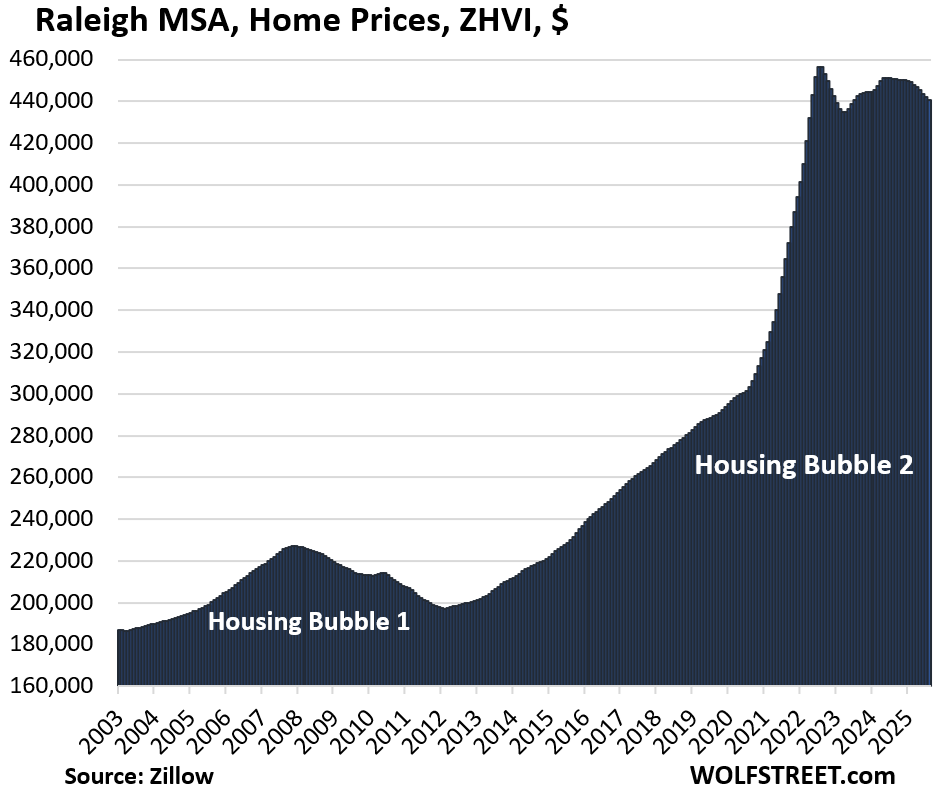
| Raleigh MSA, Home Prices | |||
| From July 2022 peak | MoM | YoY | Since 2000 |
| -3.5% | -0.3% | -2.2% | 153% |
| Salt Lake City MSA, Home Prices | |||
| From July 2022 peak | MoM | YoY | Since 2000 |
| -3.5% | 0.2% | 1.6% | 215% |
Prices exploded by 54% from January 2020 through June 2022.
| Atlanta MSA, Home Prices | |||
| From July 2022 | MoM | YoY | Since 2000 |
| -3.1% | -0.2% | -3.0% | 156% |
Prices exploded 51% between January 2020 and June 2022.
| Houston MSA, Home Prices | |||
| From Jul 2022 peak | MoM | YoY | Since 2000 |
| -2.8% | -0.2% | -1.9% | 147% |
| San Diego MSA, Home Prices | |||
| Fr Jul 2024 peak | MoM | YoY | Since 2000 |
| -2.6% | -0.4% | -2.5% | 328% |
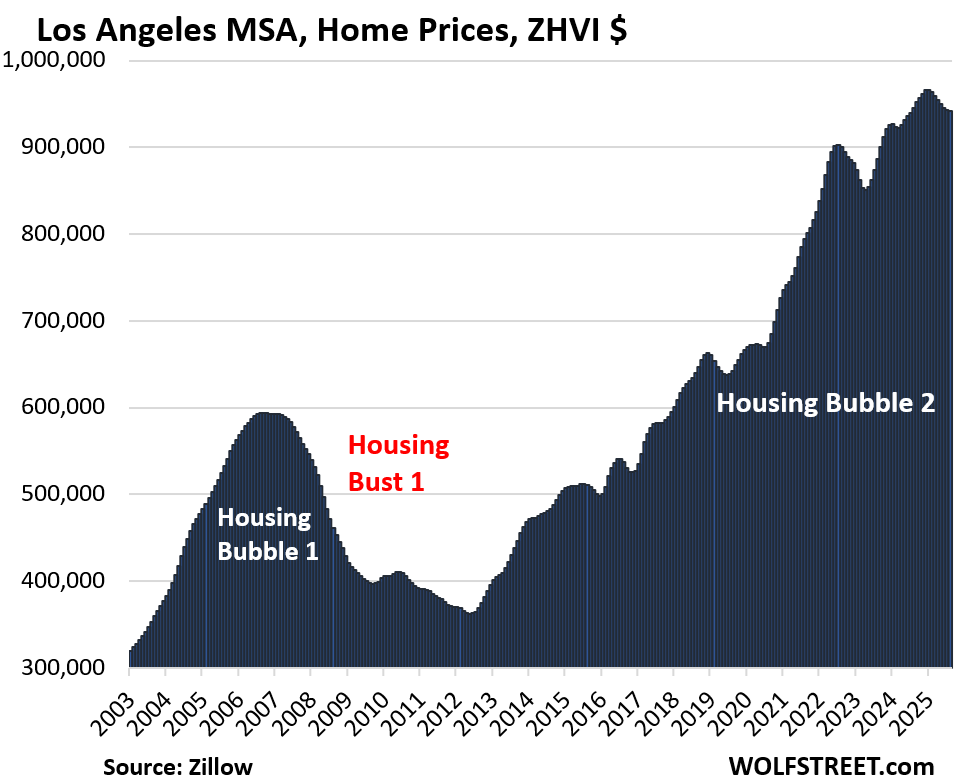
| Los Angeles MSA, Home Prices | |||
| Fr Dec 2024 high | MoM | YoY | Since 2000 |
| -2.5% | -0.1% | -0.4% | 324% |
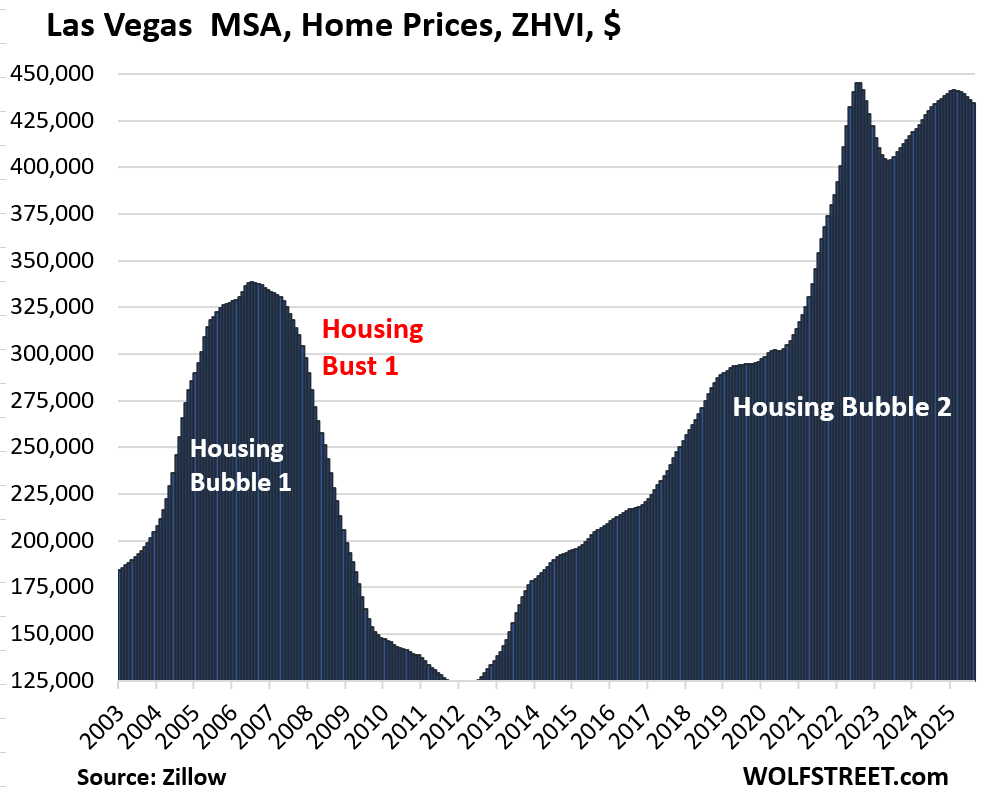
| Las Vegas MSA, Home Prices | |||
| From June 2022 peak | MoM | YoY | Since 2000 |
| -2.5% | -0.4% | 0.1% | 179% |
| Nashville MSA, Home Prices | |||
| From July 2022 peak | MoM | YoY | Since 2000 |
| -1.7% | -0.2% | -0.1% | 215% |
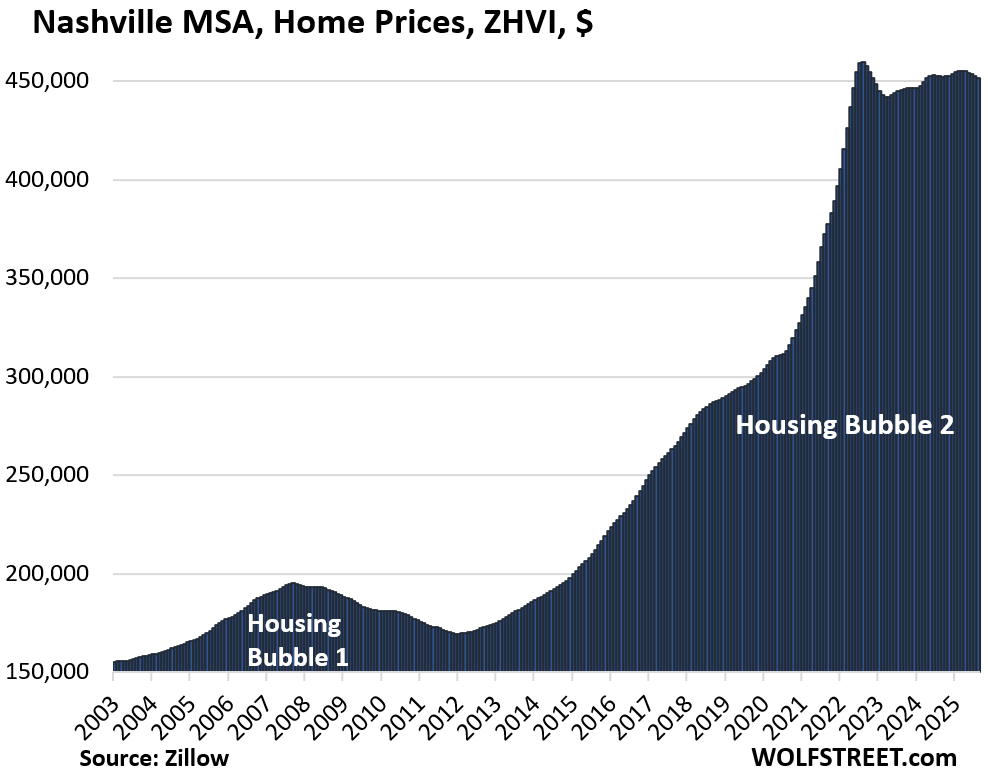
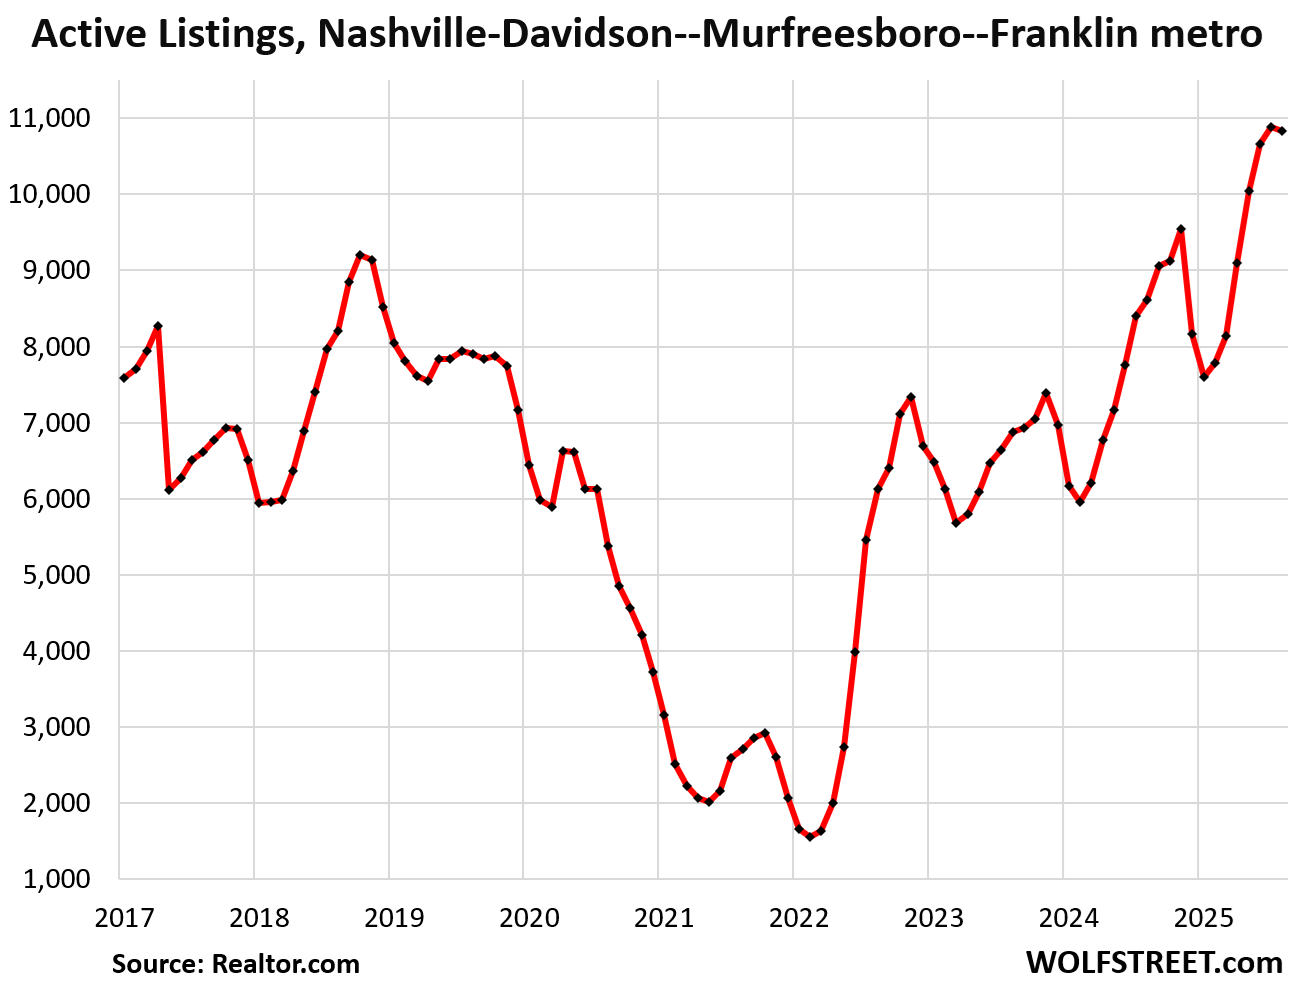
And inventory in the Nashville metro:
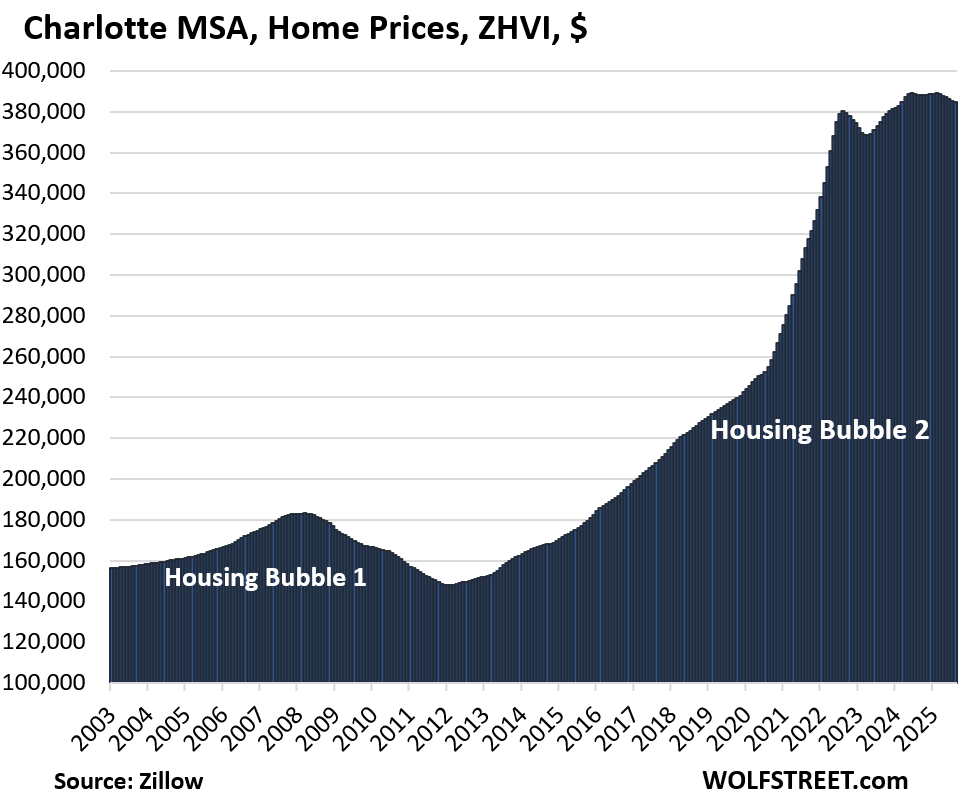
| Charlotte MSA, Home Prices | |||
| Fr May 2024 peak | MoM | YoY | Since 2000 |
| -1.0% | -0.1% | -0.9% | 166% |
Prices exploded by 54% between January 2020 and June 2022.
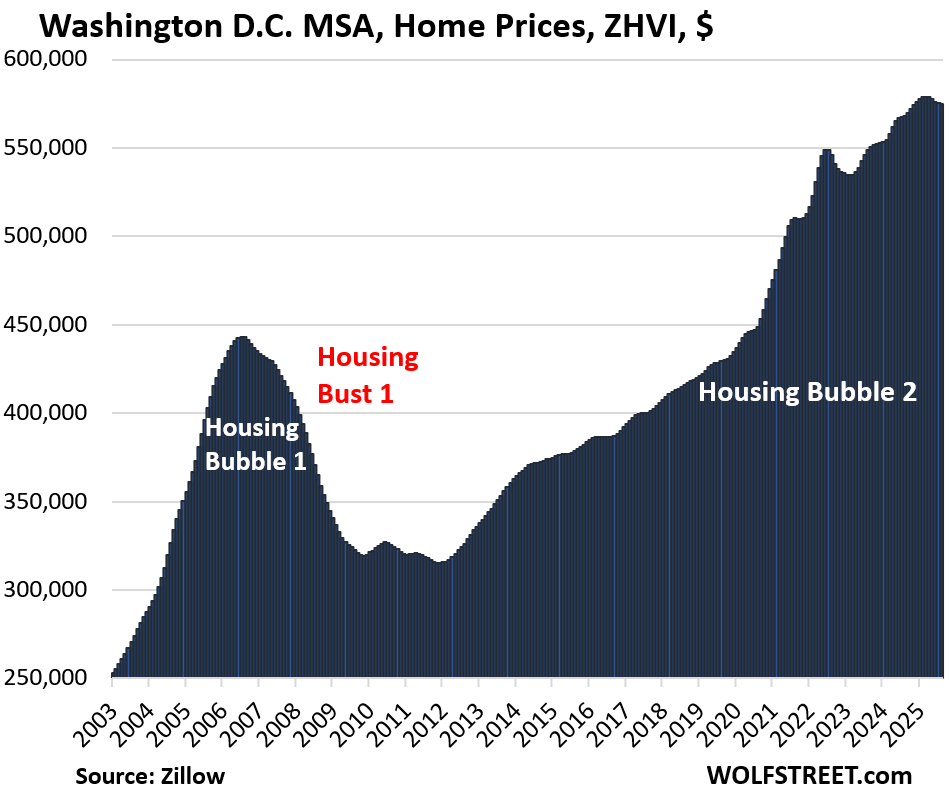
| Washington D.C. MSA, Home Prices | ||
| MoM | YoY | Since 2000 |
| -0.1% | 1.1% | 216% |
The Washington-Arlington-Alexandria, which includes all of Washington, D.C., and parts of Maryland, Virginia, and West Virginia, is a huge diverse area. In Washington DC itself, prices have been skidding, with single-family home prices down 12% from their peak.
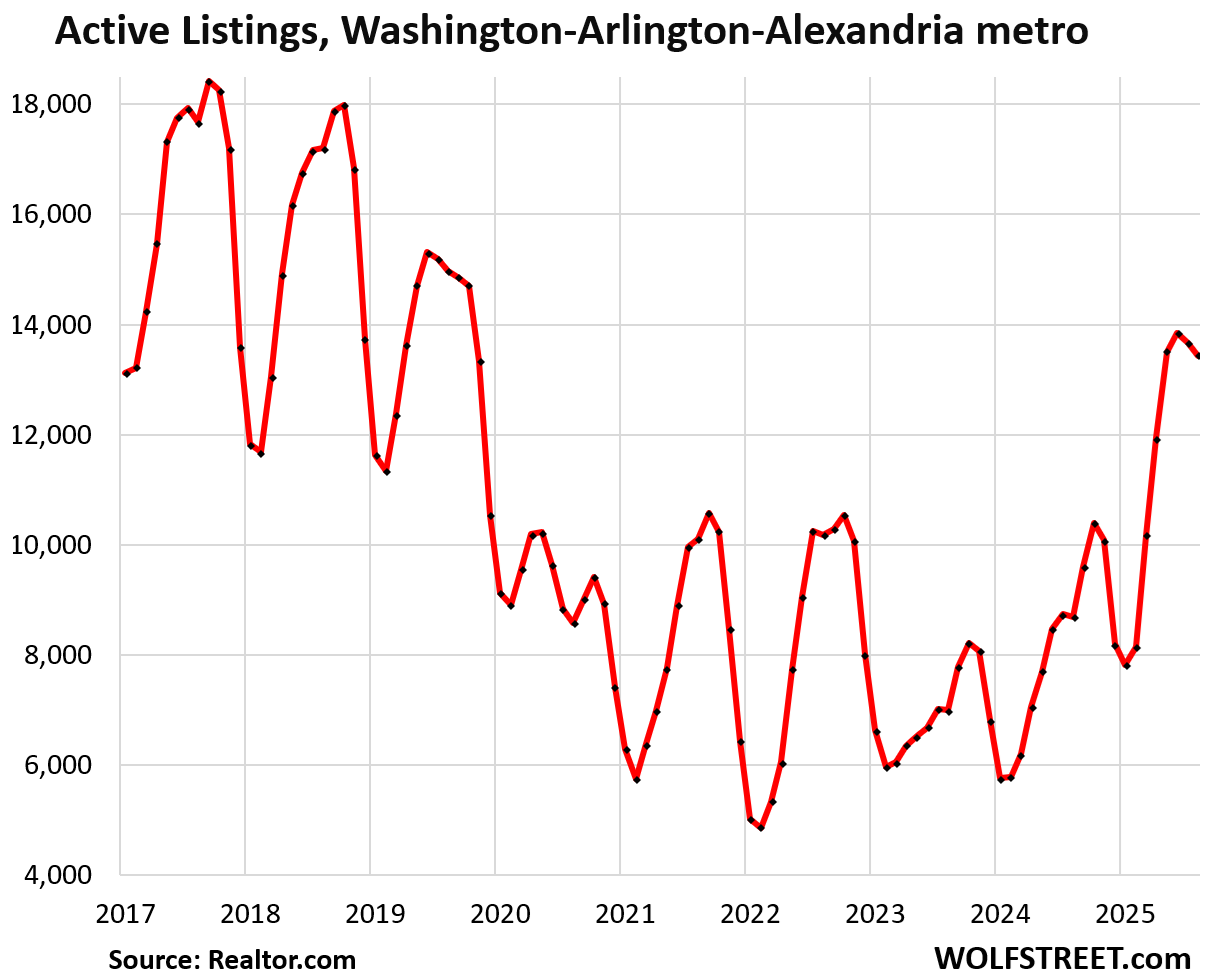
And inventory:
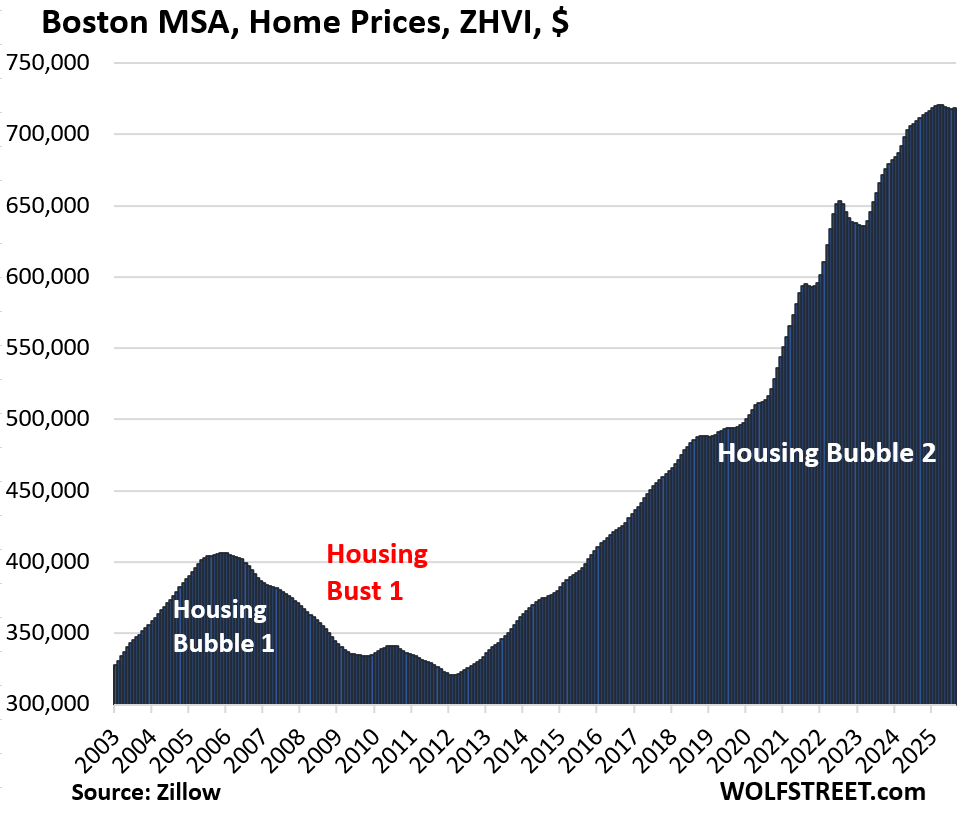
| Boston MSA, Home Prices | ||
| MoM | YoY | Since 2000 |
| 0.0% | 1.2% | 225% |
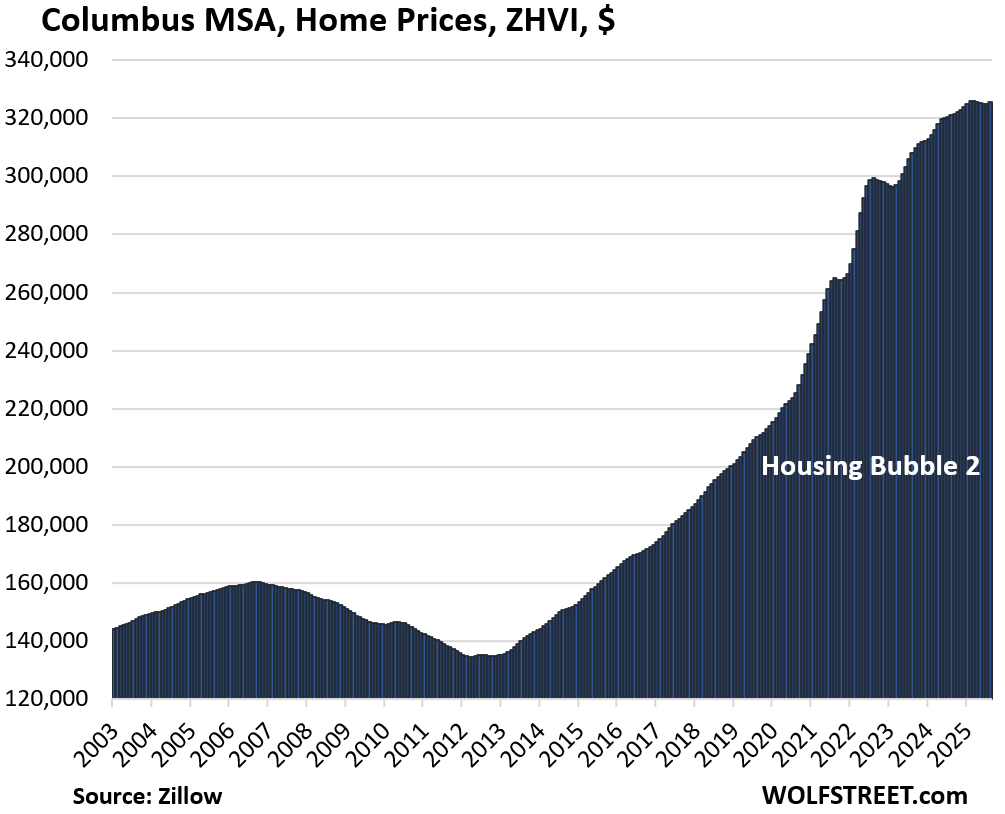
| Columbus MSA, Home Prices | ||
| MoM | YoY | Since 2000 |
| 0.1% | 1.4% | 155% |
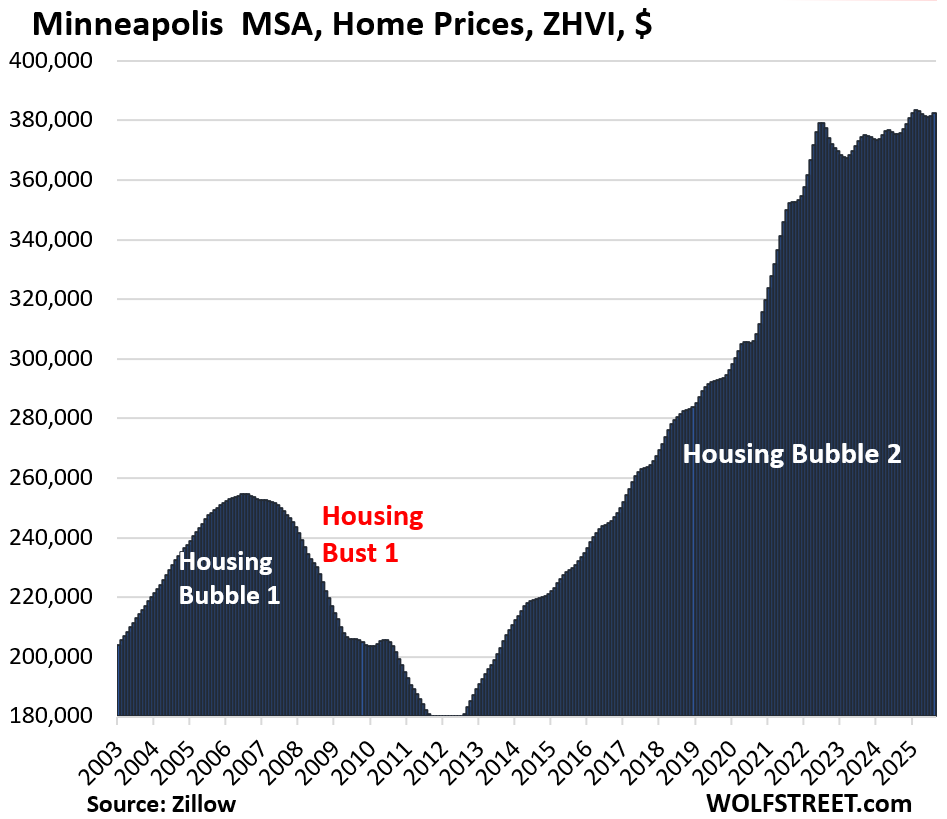
| Minneapolis MSA, Home Prices | ||
| MoM | YoY | Since 2000 |
| 0.3% | 1.9% | 160% |
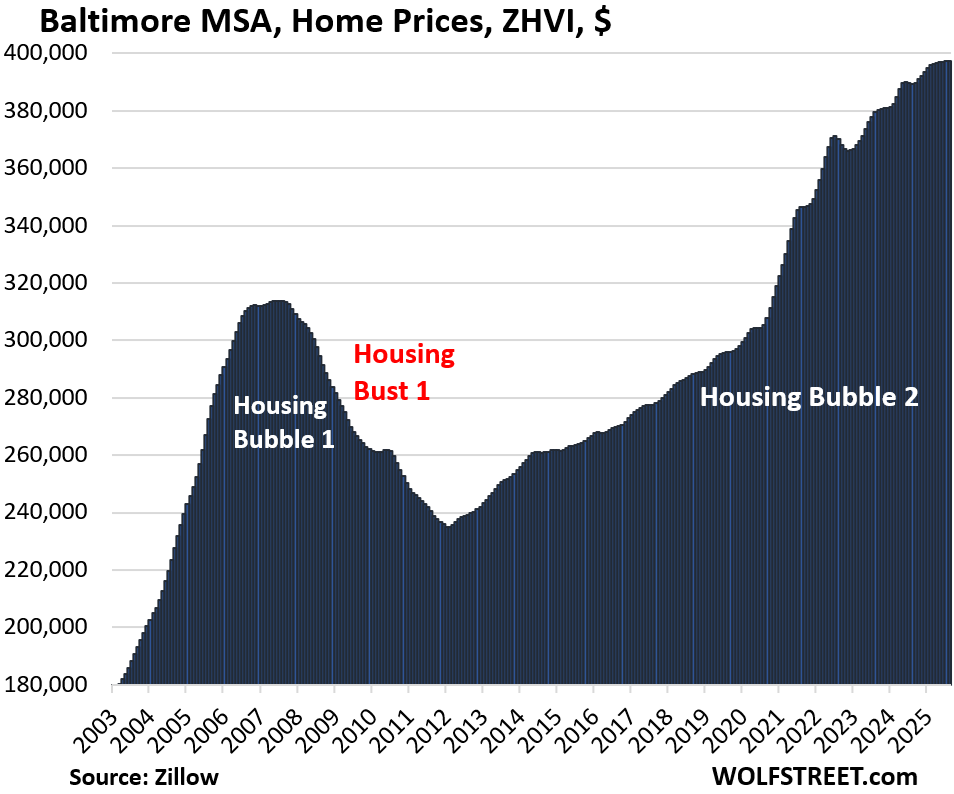
| Baltimore MSA, Home Prices | |||
| MoM | YoY | Since 2000 | |
| 0.1% | 2.1% | 177% | |
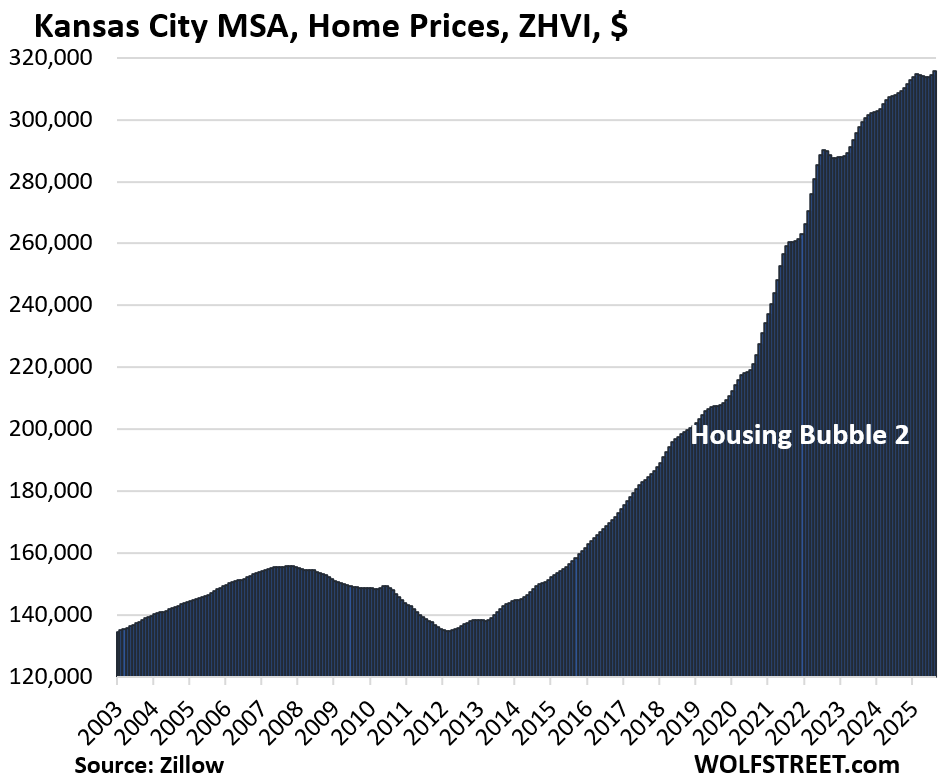
| Kansas City MSA, Home Prices | ||
| MoM | YoY | Since 2000 |
| 0.4% | 2.3% | 178% |
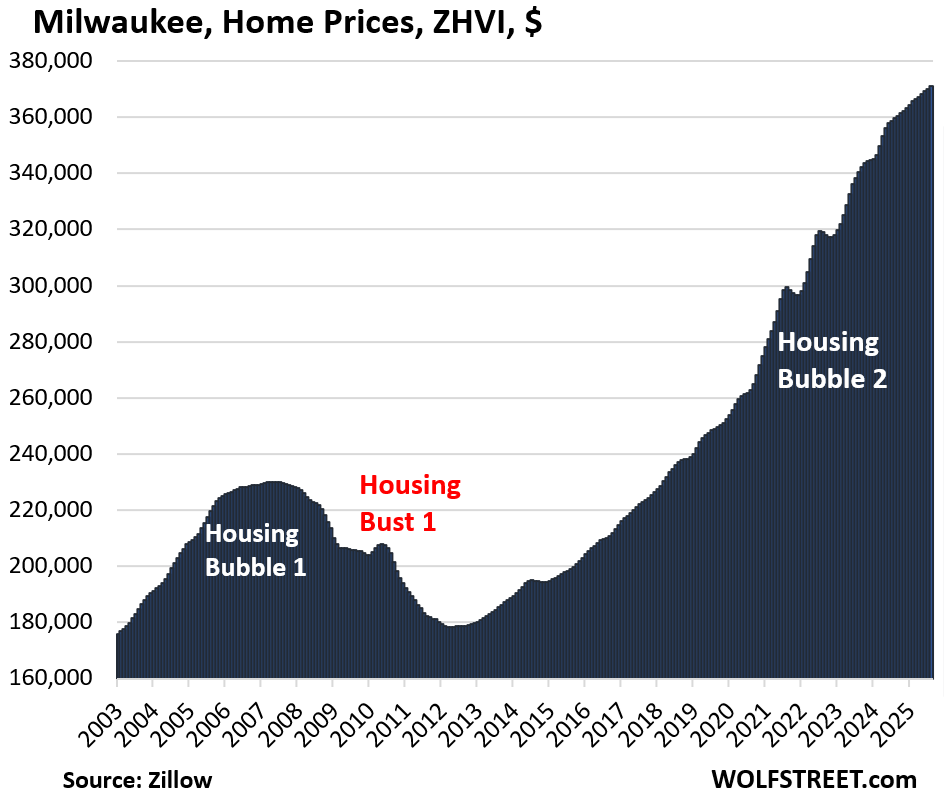
| Milwaukee MSA, Home Prices | ||
| MoM | YoY | Since 2000 |
| 0.2% | 3.2% | 150.7% |
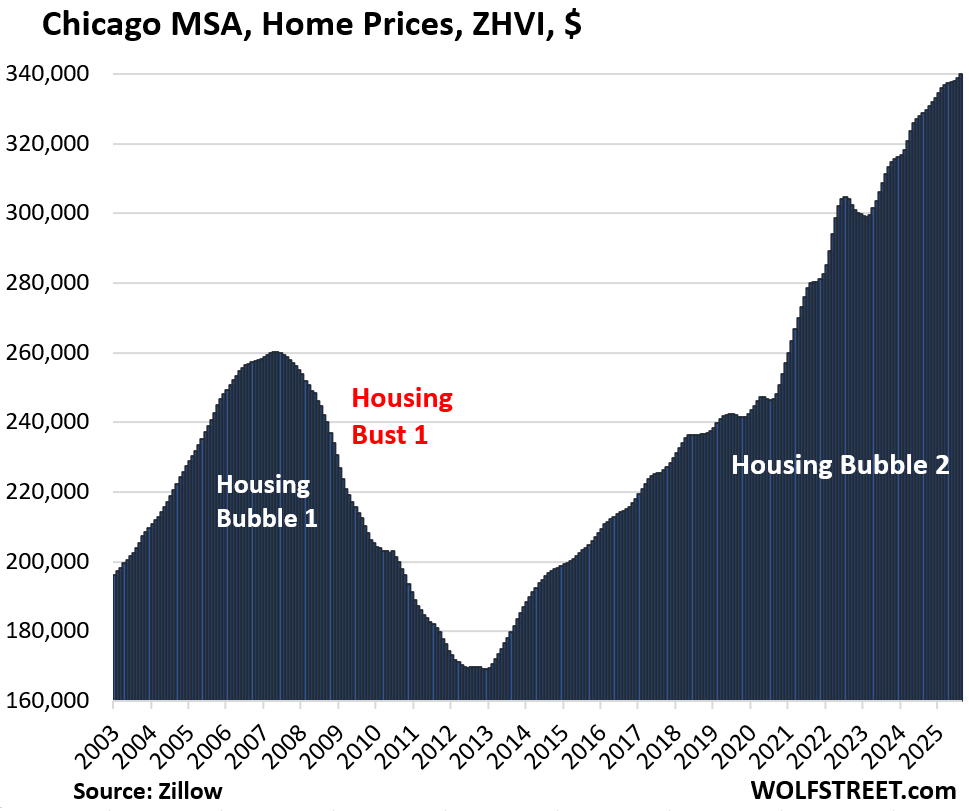
| Chicago MSA, Home Prices | ||
| MoM | YoY | Since 2000 |
| 0.3% | 3.4% | 118% |
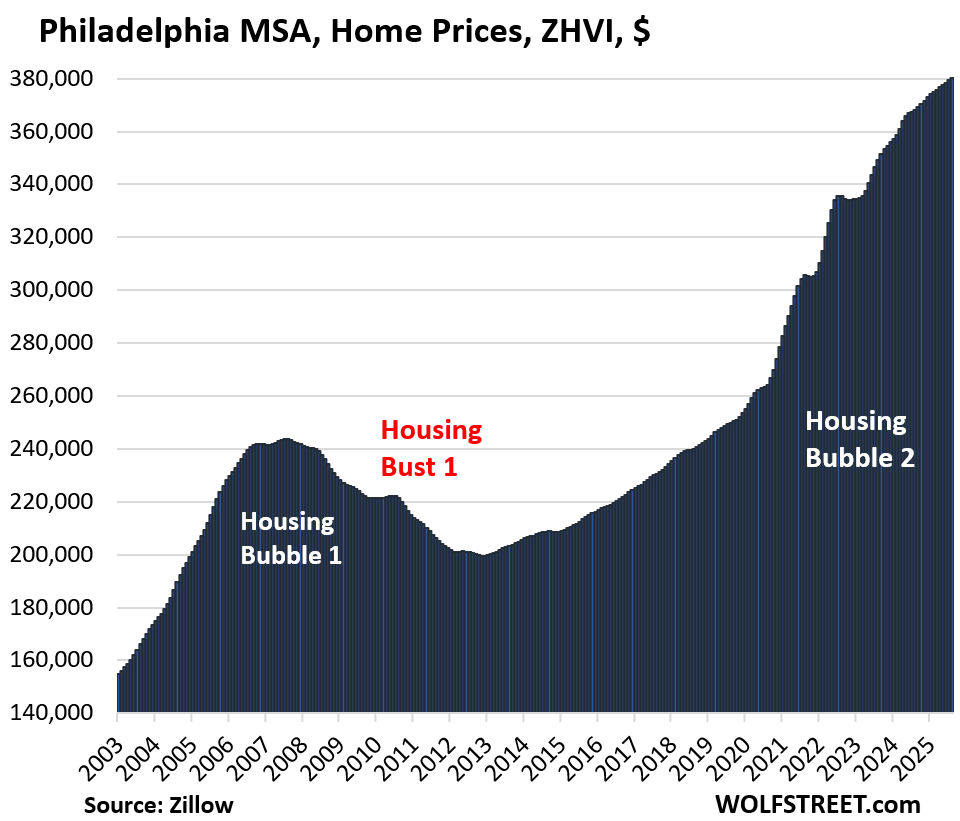
| Philadelphia MSA, Home Prices | ||
| MoM | YoY | Since 2000 |
| 0.2% | 3.4% | 208% |
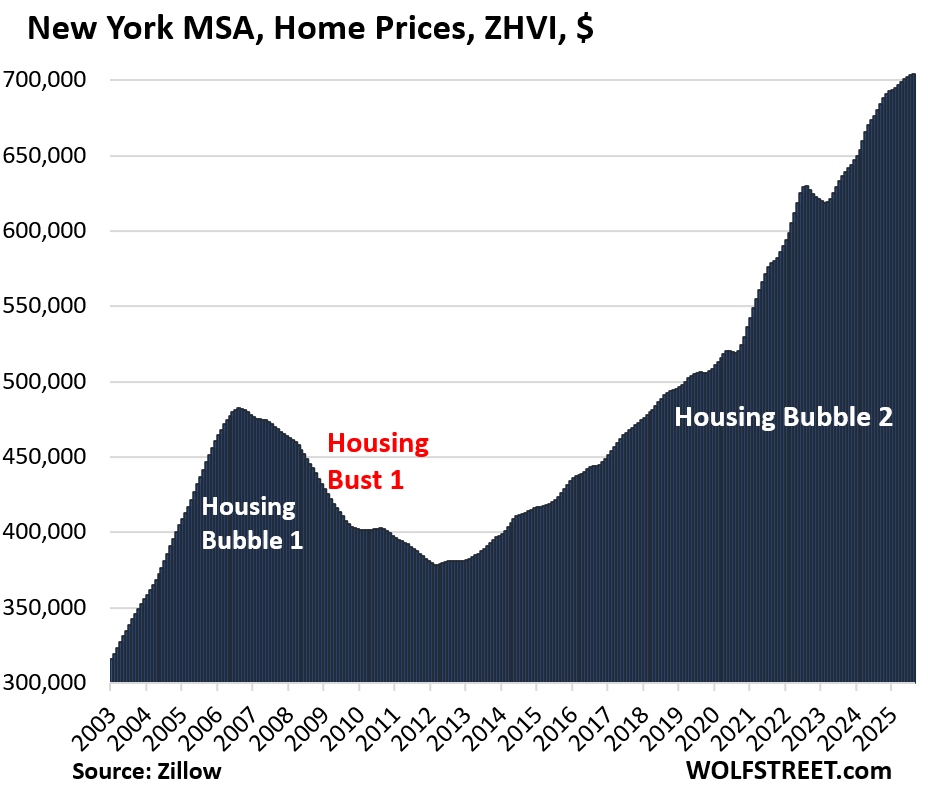
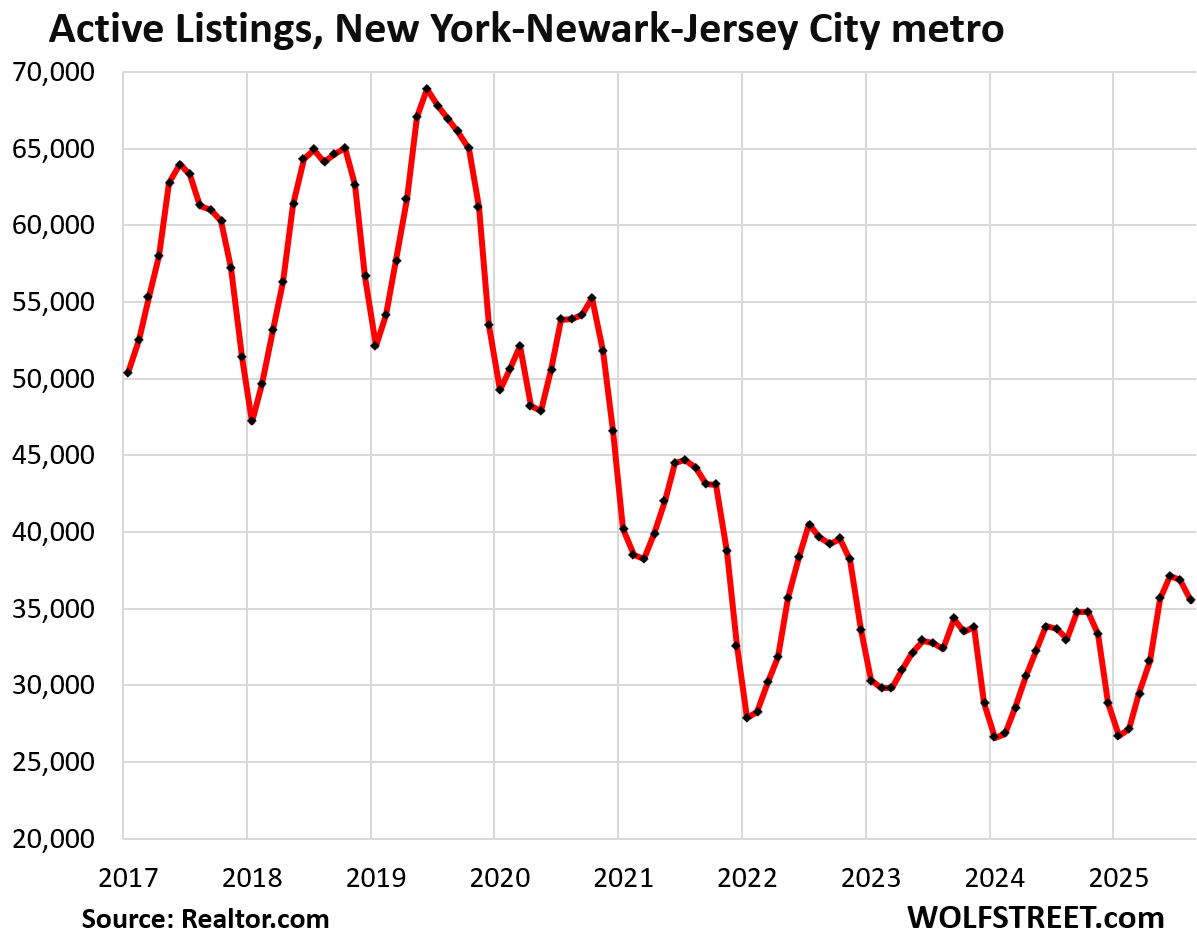
| New York MSA, Home Prices | ||
| MoM | YoY | Since 2000 |
| 0.1% | 3.6% | 219% |
And inventory:
Enjoy reading WOLF STREET and want to support it? You can donate. I appreciate it immensely. Click on the mug to find out how:

![]()
44 of biggest 50 metros flashing grave warning that house price crash next…
Interesting, let’s see if this will continue to play out, MSM and plenty of RE agents and Redditors already hyping lower mortgage rates and the recent decline of 10yrs as the coming savior. Last I checked, my credit union is now doing 30yrs fixed at 5.25, lower than almost 7 just a month ago. For SoCal, maybe that’s enough to help tip the scale in bringing enough FOMO buyers back even though houses are still massively overpriced and crapshack still shamelessly asking and in some cases getting sold for over $1M…lower rates will certainly offer some incentives for certain groups of buyers that can afford and was on the sidelines to cross the rubicon.
Anyone who tries to play that game now is beyond mega-foolish. Sad.
We are suffering, yes suffering, the Great Housing Abomination.
One word is totally applicable – MANIPULATION.
Only by buyers bidding prices sky high. That is what markets always do.
That slide show of volcanos is fascinating — seems like massive amounts of lava left in the magma chambers – and likely we end up seeing eruptions all winter (and 2006). Those babies look ready to blow any second! I’m downwind…
I would not advise any young person today to sign up for as much debt as it now takes to buy a “starter” home. All the math indicates they’d be better off renting and plowing the money they would have spent on a down payment, skyrocketing insurance, customization, and mortgage interest into paper assets instead. When you sign the line on a $500k mortgage (word bases mean “death lock”), you’ll never be free again.
Yes, a lot of stocks are so expensive they don’t make sense, but none of the affordability metrics make sense with houses at this level either. I can use options strategies and diversification to hedge stock and bond portfolios, but there’s nothing I can do to save your $400k “starter home” a hour outside Orlando with outrageous HOA dues from confronting the reality that most people can’t afford it.
And a huge chunk of inventory is owned by boomers who will either die within the next 5-10 years or will soon be shipped off to nursing facilities. Meanwhile, the US fertility rate has been below 2 since 2009, suggesting a falling population unless immigration makes up for it. And if anything botches the planned partial-privitization of Fannie and Freddy, so that 30y mortgages are not guaranteed to anyone with a job and a pulse anymore, then look out below.
Wolf, I’m looking at your earlier list of REITs and companies that have invested in SFH rentals. They seem like juicy short candidates. I can’t make the math work on SFH’s. Apartments maybe, but not SFH’s. So when I see INVH selling for a PE ratio of 33 like it’s a big tech company, I’m tempted to short it, or at least bet it won’t go up from here. I think the first recession blows up this industry.
Completely agree with you but do want to say among my friends, family members or co workers, saying this stuff feels like screaming into the void or throwing a paper kite into the wind…
Especially when speaking to people more bias in housing is never a losing proposition camp and with SoCal prices sell not seeing any noticable correction like Austin, it’s truly an exercise in futility
All markets are certainly asset bubbles enabled by free money, but some are certainly going to hold up due to demographic shifts. I don’t think southeastern markets will see huge drops like in 2008 due to rapid in-migration
That in-migration has come to a crawl. There has already been a lot of soul-searching in Texas about it. Florida same thing. Other places too.
In Texas the extreme heat is expensive add that to high property taxes and high insurance rates it is not what it used to be. Florida is a disaster due to insurance and people asking if they want to hold their breath during hurricane season.
The idea that real estate prices will come down fast enough seems unlikely in the short and medium term. To get the prices down it seems the only way this will happen is major recession no where in sight. Note the banks are not excited about losing high interest income along with solid asset values now headed downward. I cannot see any major adjustment only the slow moving destruction of people who have to sell especially the Baby Boomers now needing to exit big properties….
“…don’t qualify for this list because their ZHVI has never reached $300,000, despite the blistering surge of home prices in recent years, such as the metros of New Orleans, Memphis, Oklahoma City, Tulsa, Cincinnati, and Pittsburgh.”
Interestingly, the above markets never even penetrated the lows, based on the charts, going back to 2003, of the following metros:
San Francisco
San Diego
San Jose
Los Angeles
Boston
New York
What is a young professional to do these days? The best job opportunities are in the largest and coastal cities. Yet, affordability lies in the mid-sized and inland cities. Is it better to rent in larger cities and hope things improve or move across the country to a city where you might be able to afford a home and save. I’ve considered moving somewhere like Phoenix or Austin, but it’s a tough call to move away from family and community.
If 30-year mortgage rates stabilize around 5.5 %, the Washington-DC housing market requires only a small 0–5 % nominal adjustment from today’s ZHVI levels, or a more noticeable 10–17 % decline from today’s median sale prices, to bring the typical household back to a sustainable 33 % PITI ratio within the next two years. Otherwise, simply letting inflation and income growth work for 24 months can produce an equivalent ~14 % real affordability improvement, even if nominal prices barely move.