Oakland, Austin, New Orleans, Cape Coral, San Francisco, Birmingham, Washington DC, Fort Myers, Denver, Portland, Phoenix, and Sarasota.
By Wolf Richter for WOLF STREET.
Each housing market moves to its own drummer. In some cities, prices of single-family homes have continued to rise, but in others they started to tank in mid-2022 or more recently, and that list of cities with dropping prices has been getting longer, and the list of cities with price drops of 10% or more has been getting longer too.
And there are a bunch of cities that are not included here because prices have dropped a little less than 10% so far, but each monthly decline gets them closer to the double-digit zone.
In 12 bigger cities, prices of mid-tier single-family homes have already dropped by 10% or more from their peaks through July, seasonally adjusted. In two of them, prices have dropped by 23% so far.
- Oakland, CA: -23%
- Austin, TX: -23%
- New Orleans, LA: -18%
- Cape Coral, FL: -18%
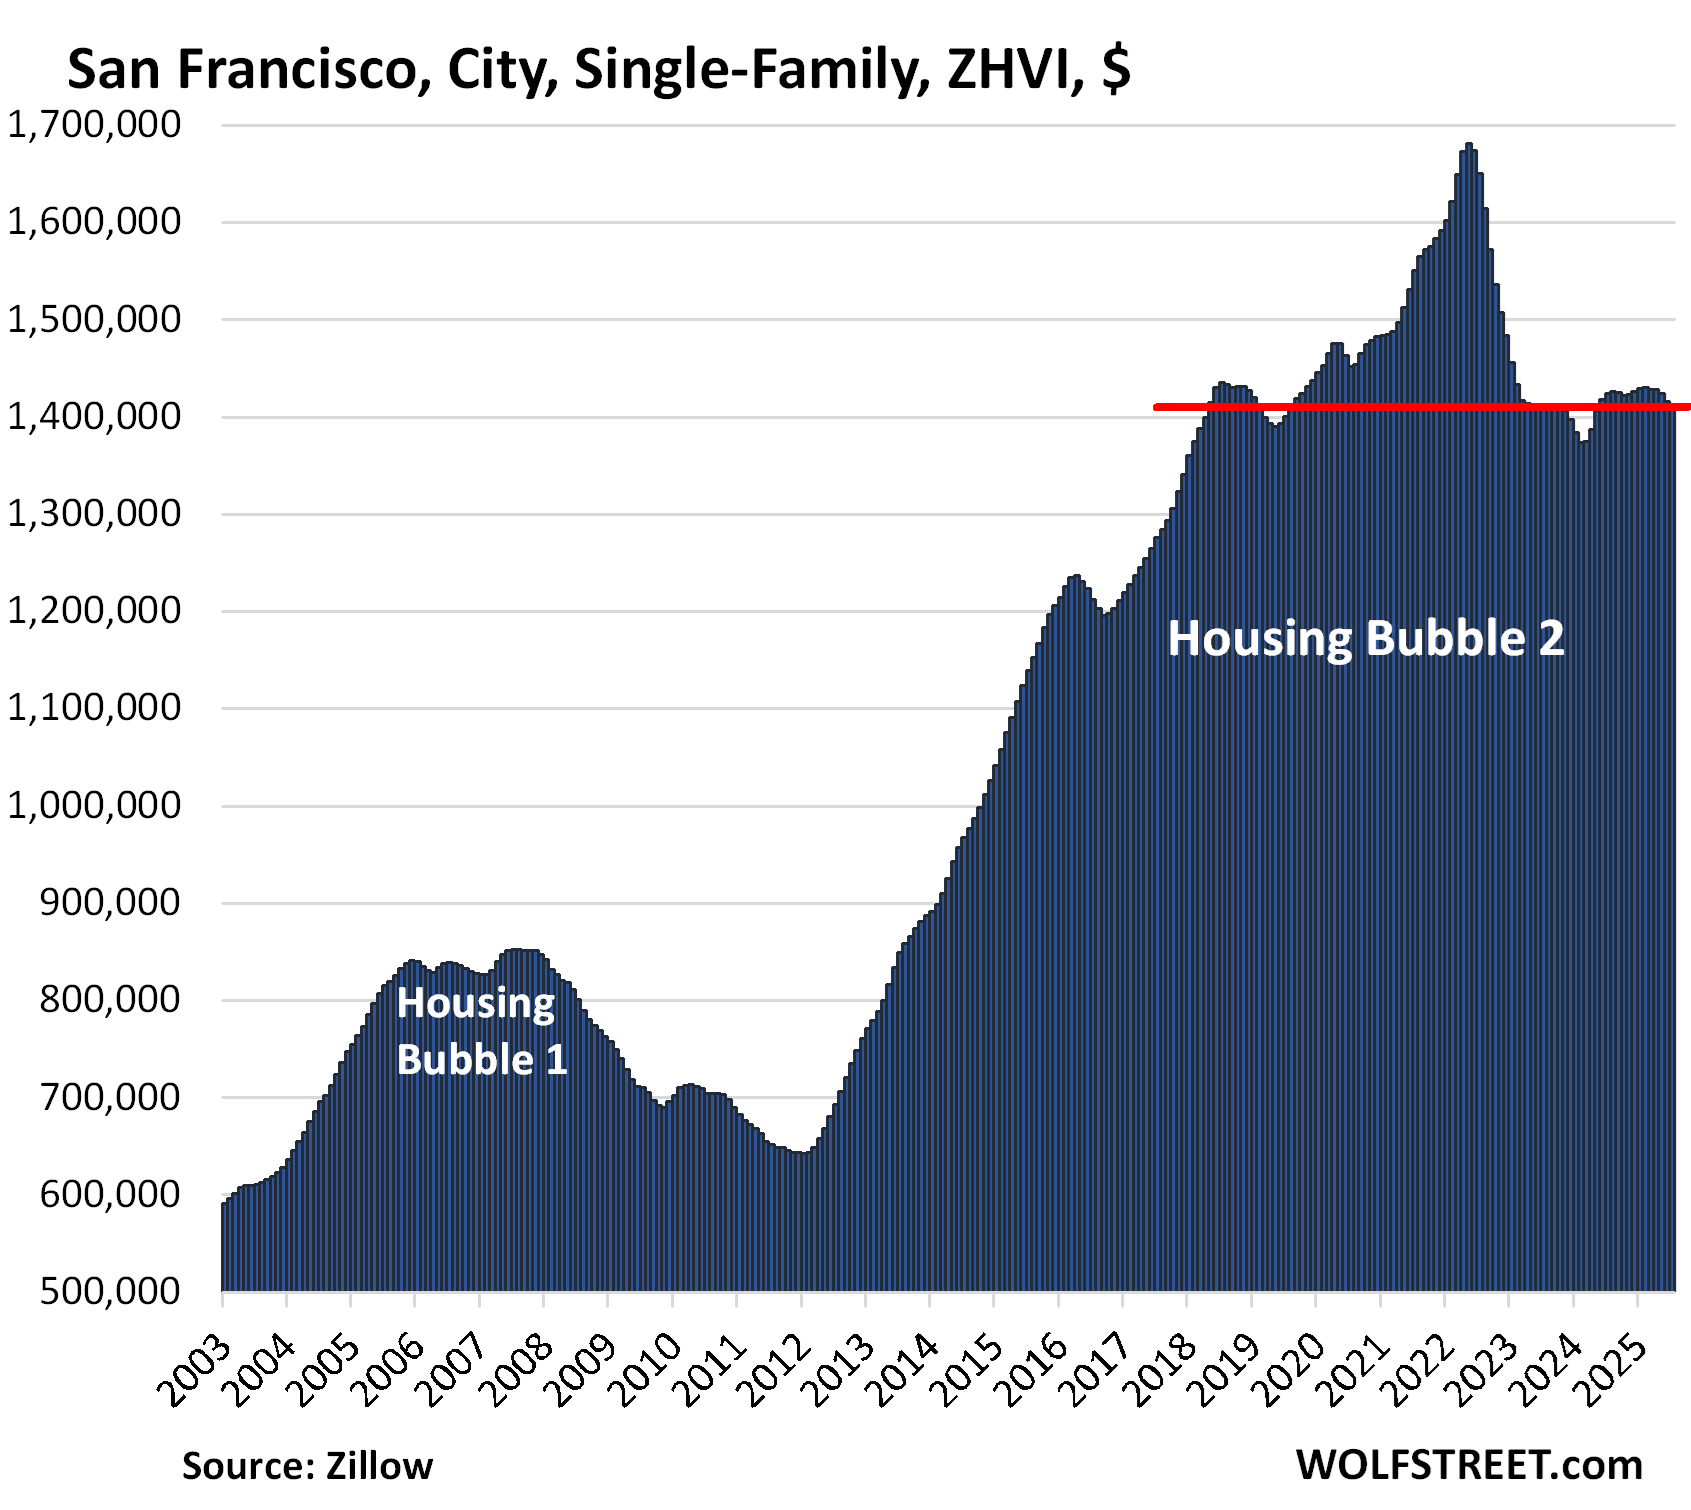
- San Francisco, CA: -16%
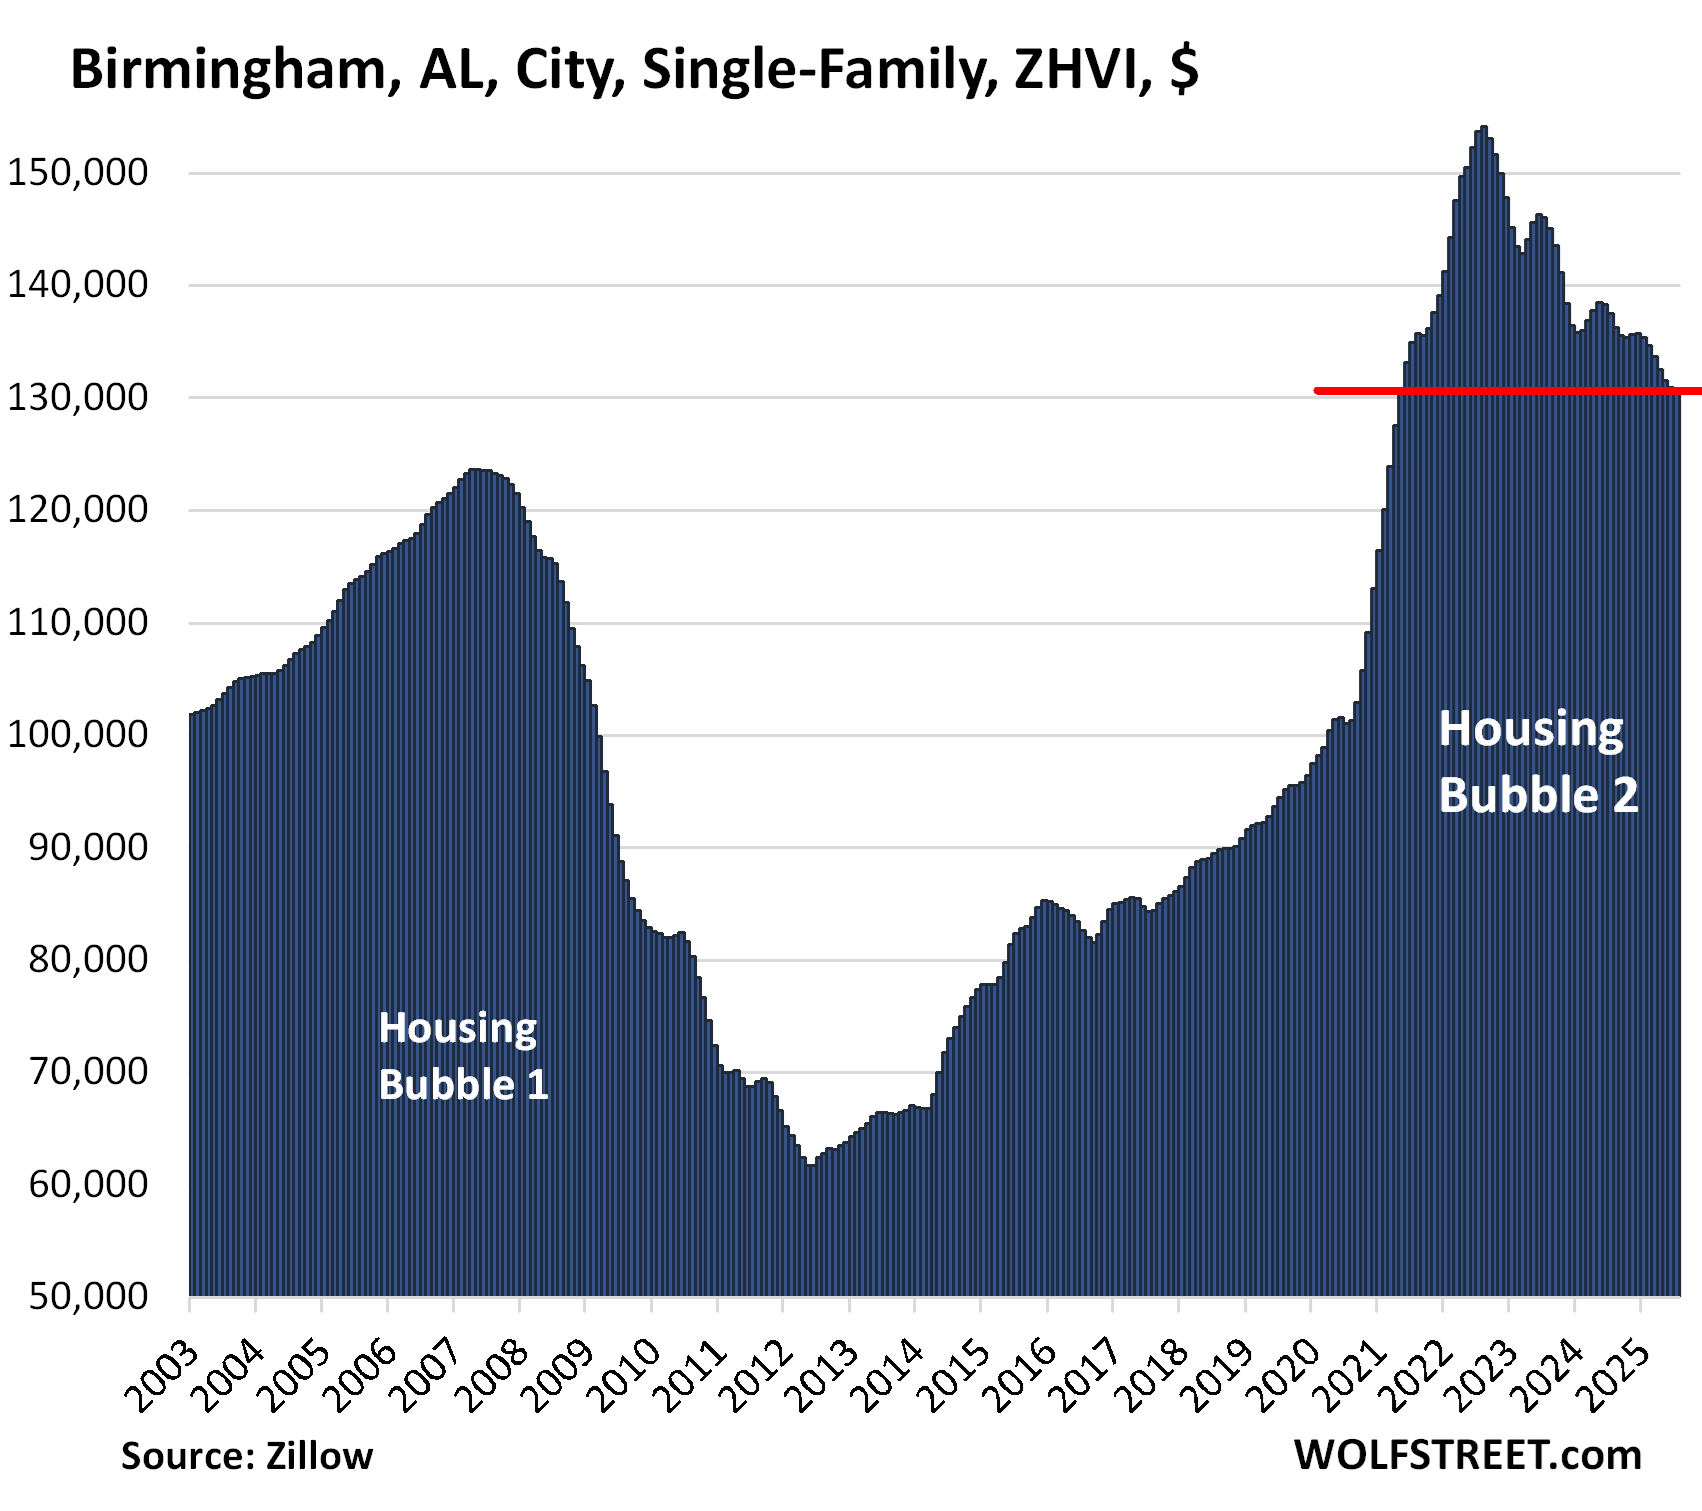
- Birmingham, AL: -15%
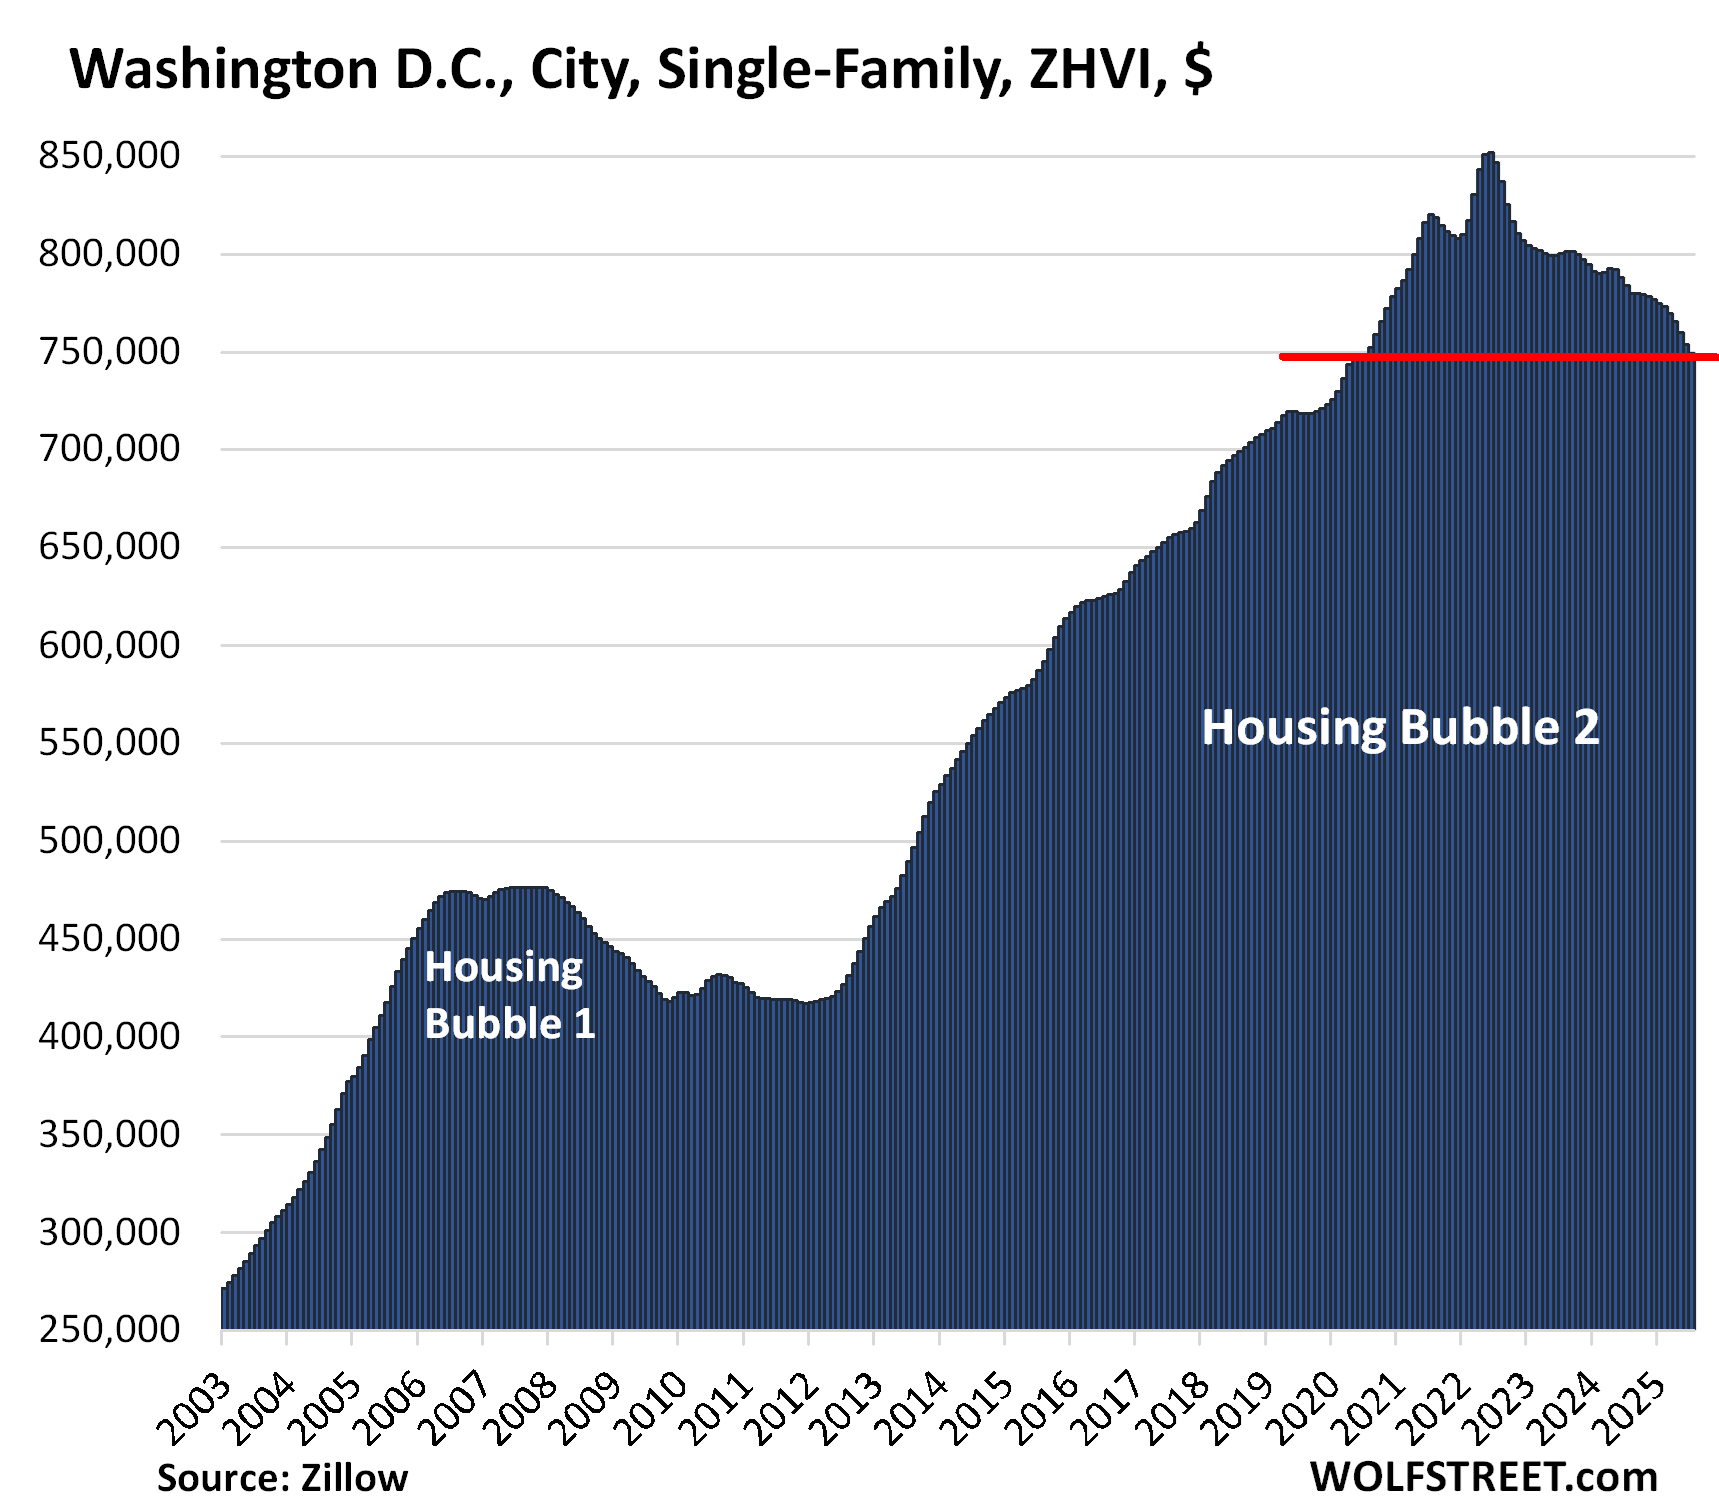
- Washington, DC: -12%
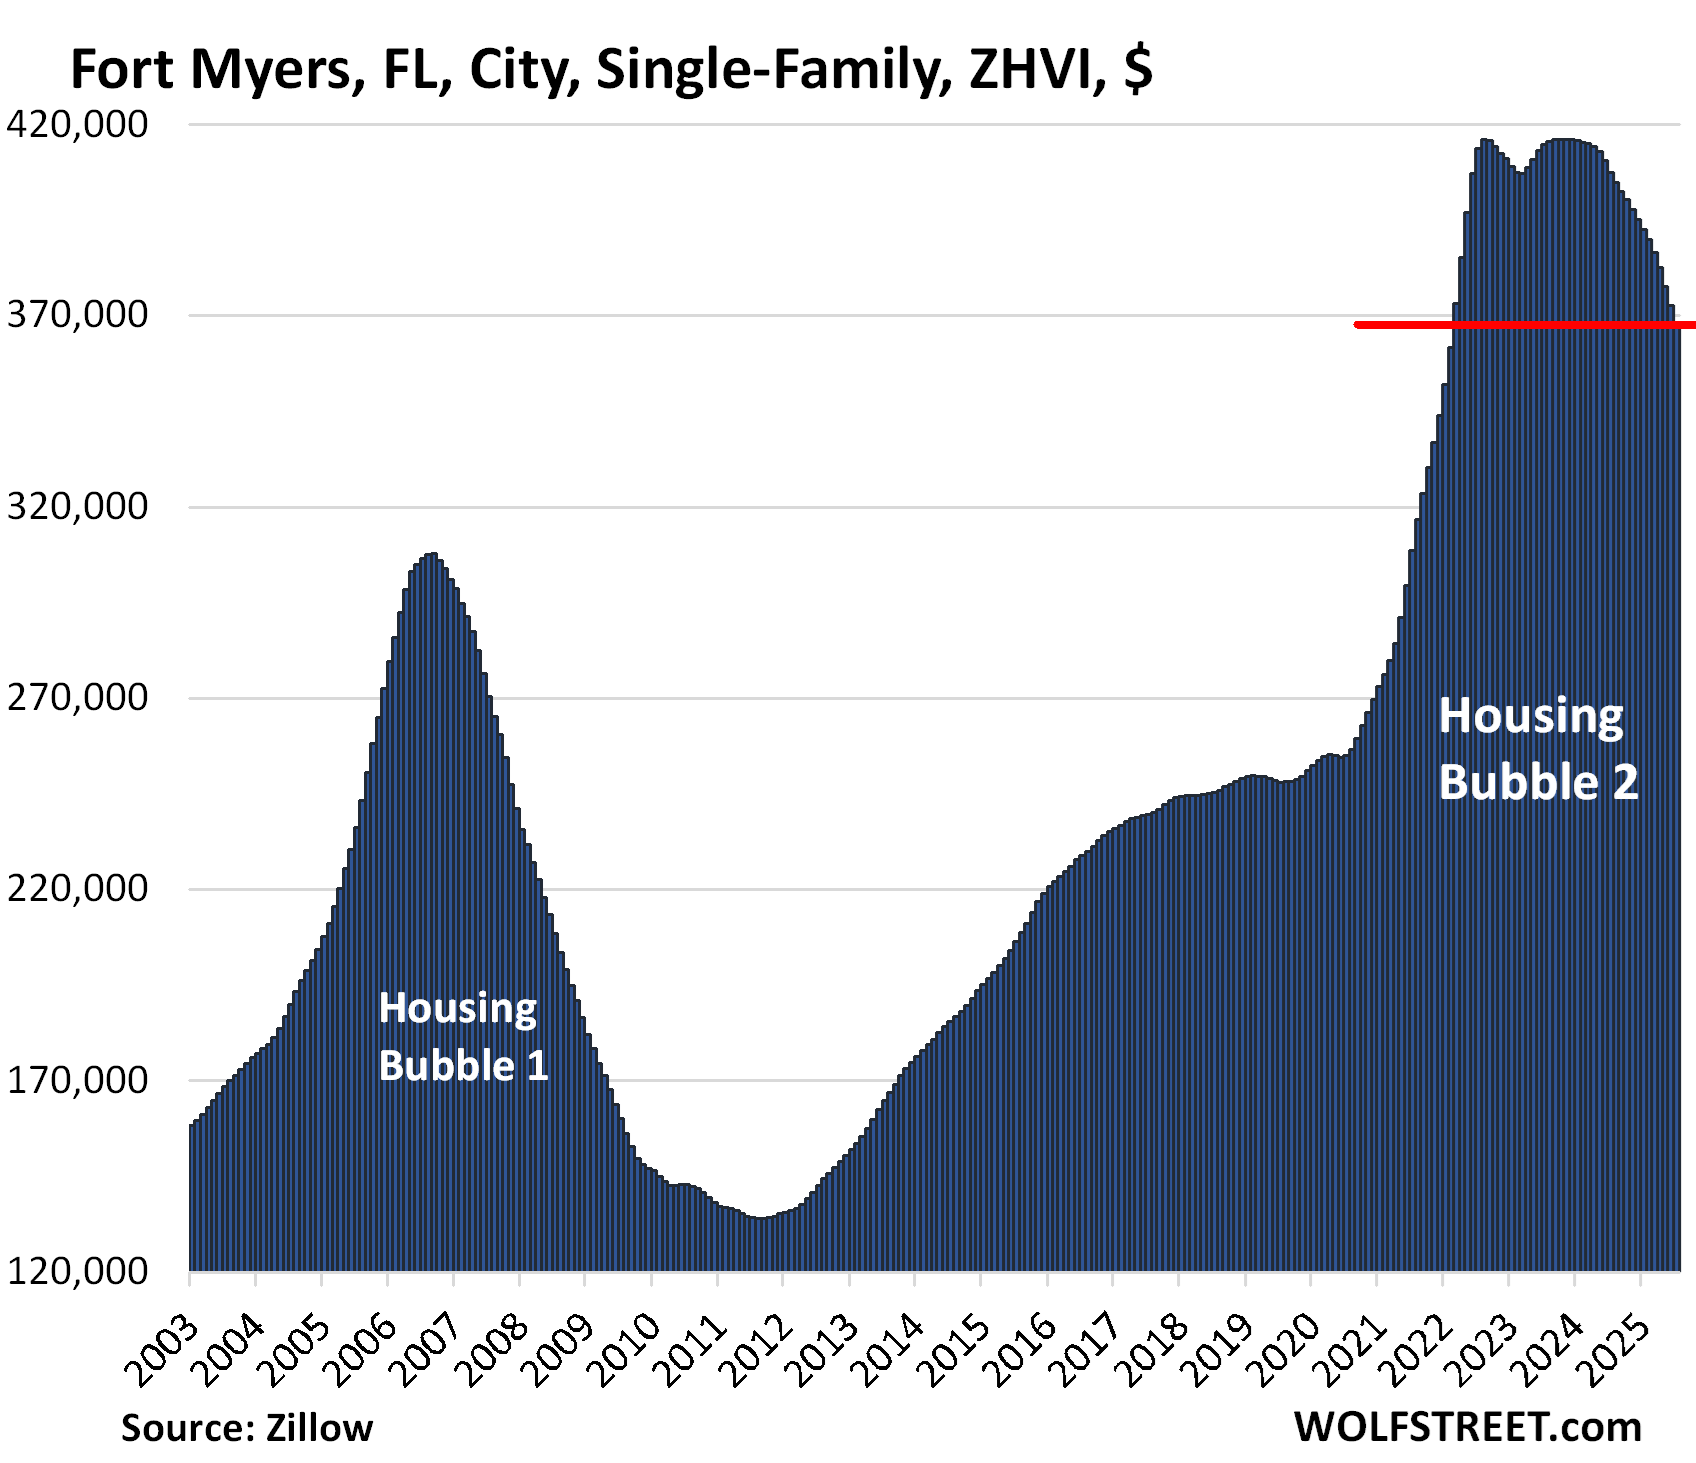
- Fort Myers, FL: -12%
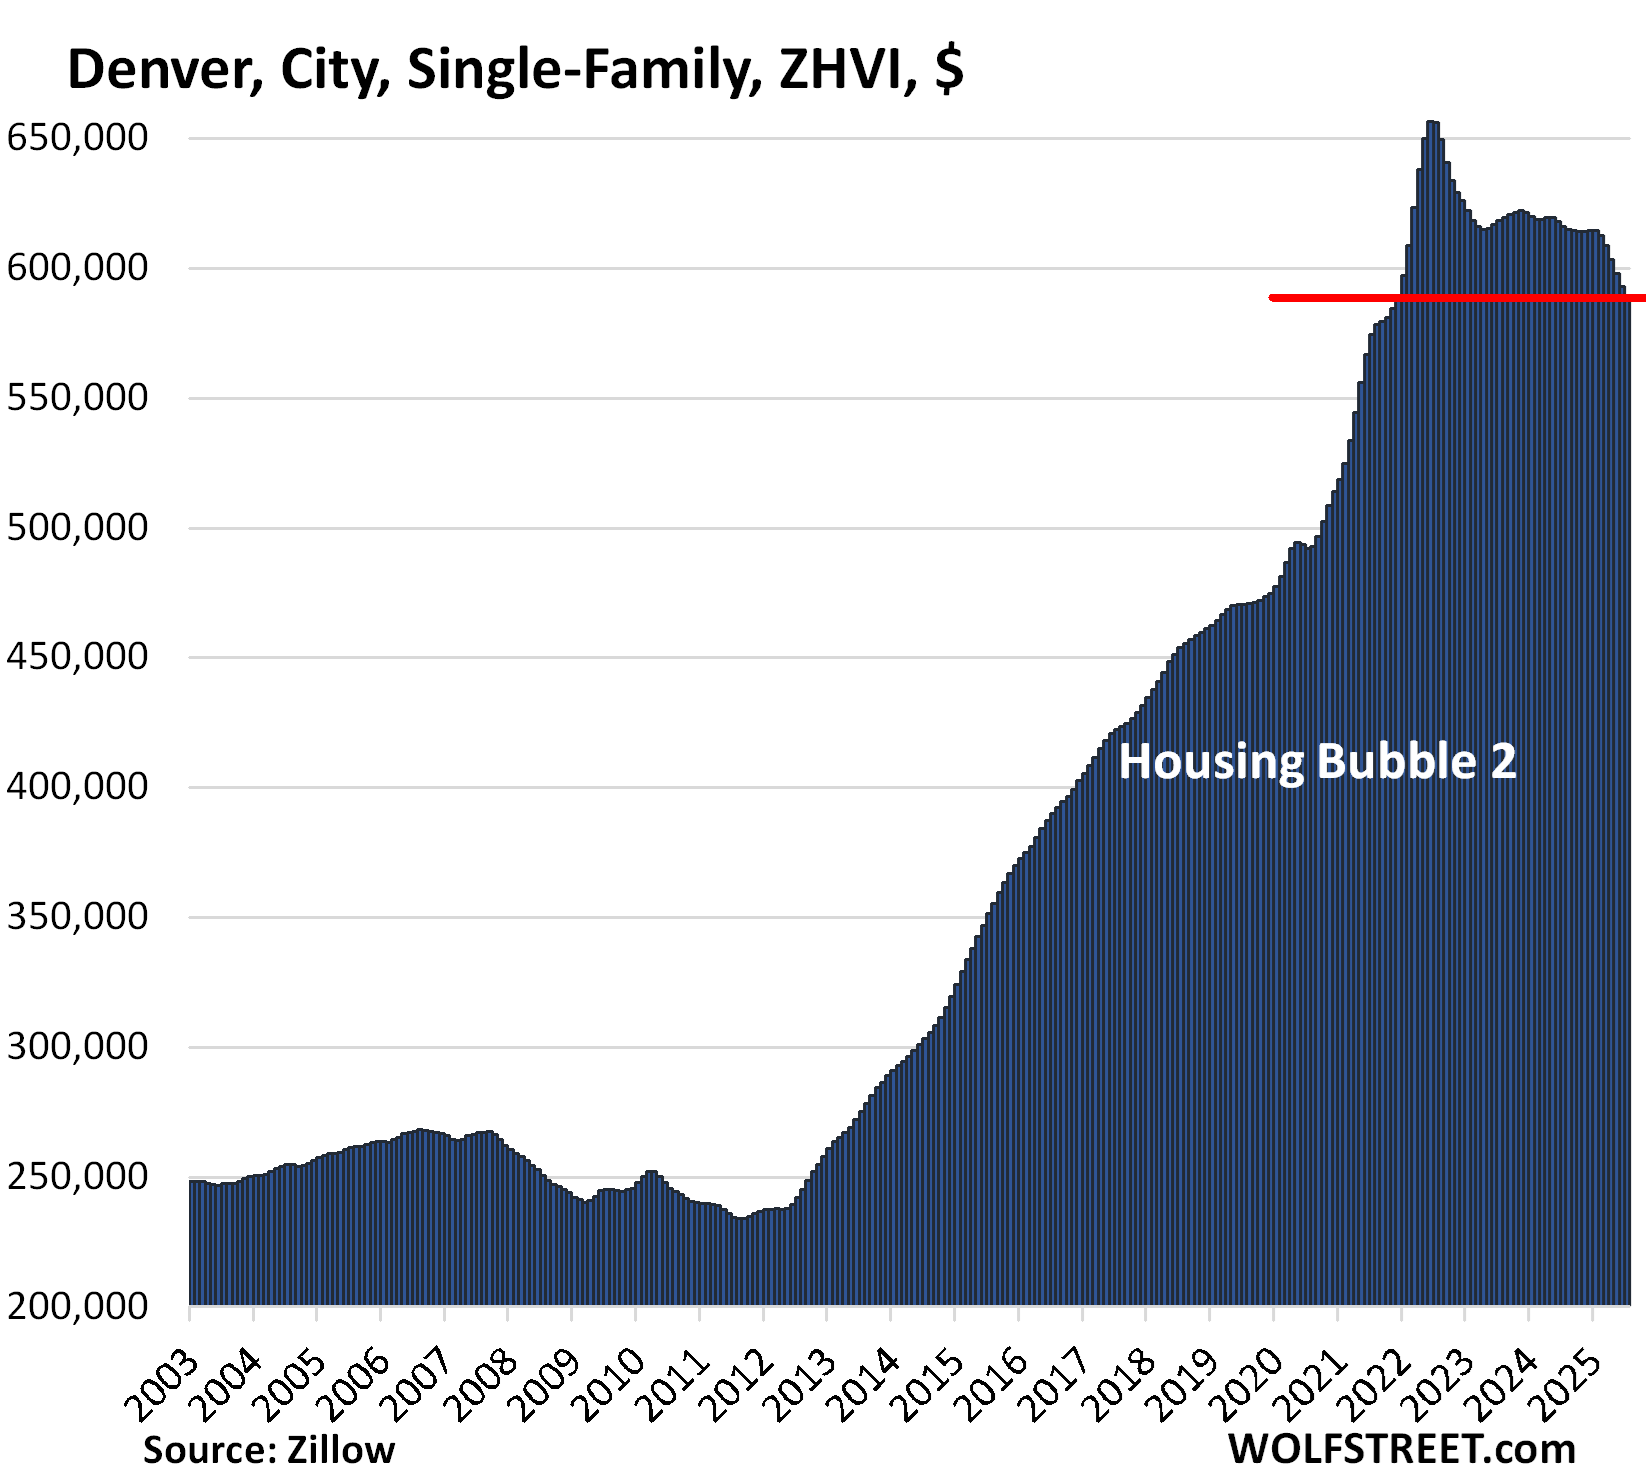
- Denver, CO: -10%
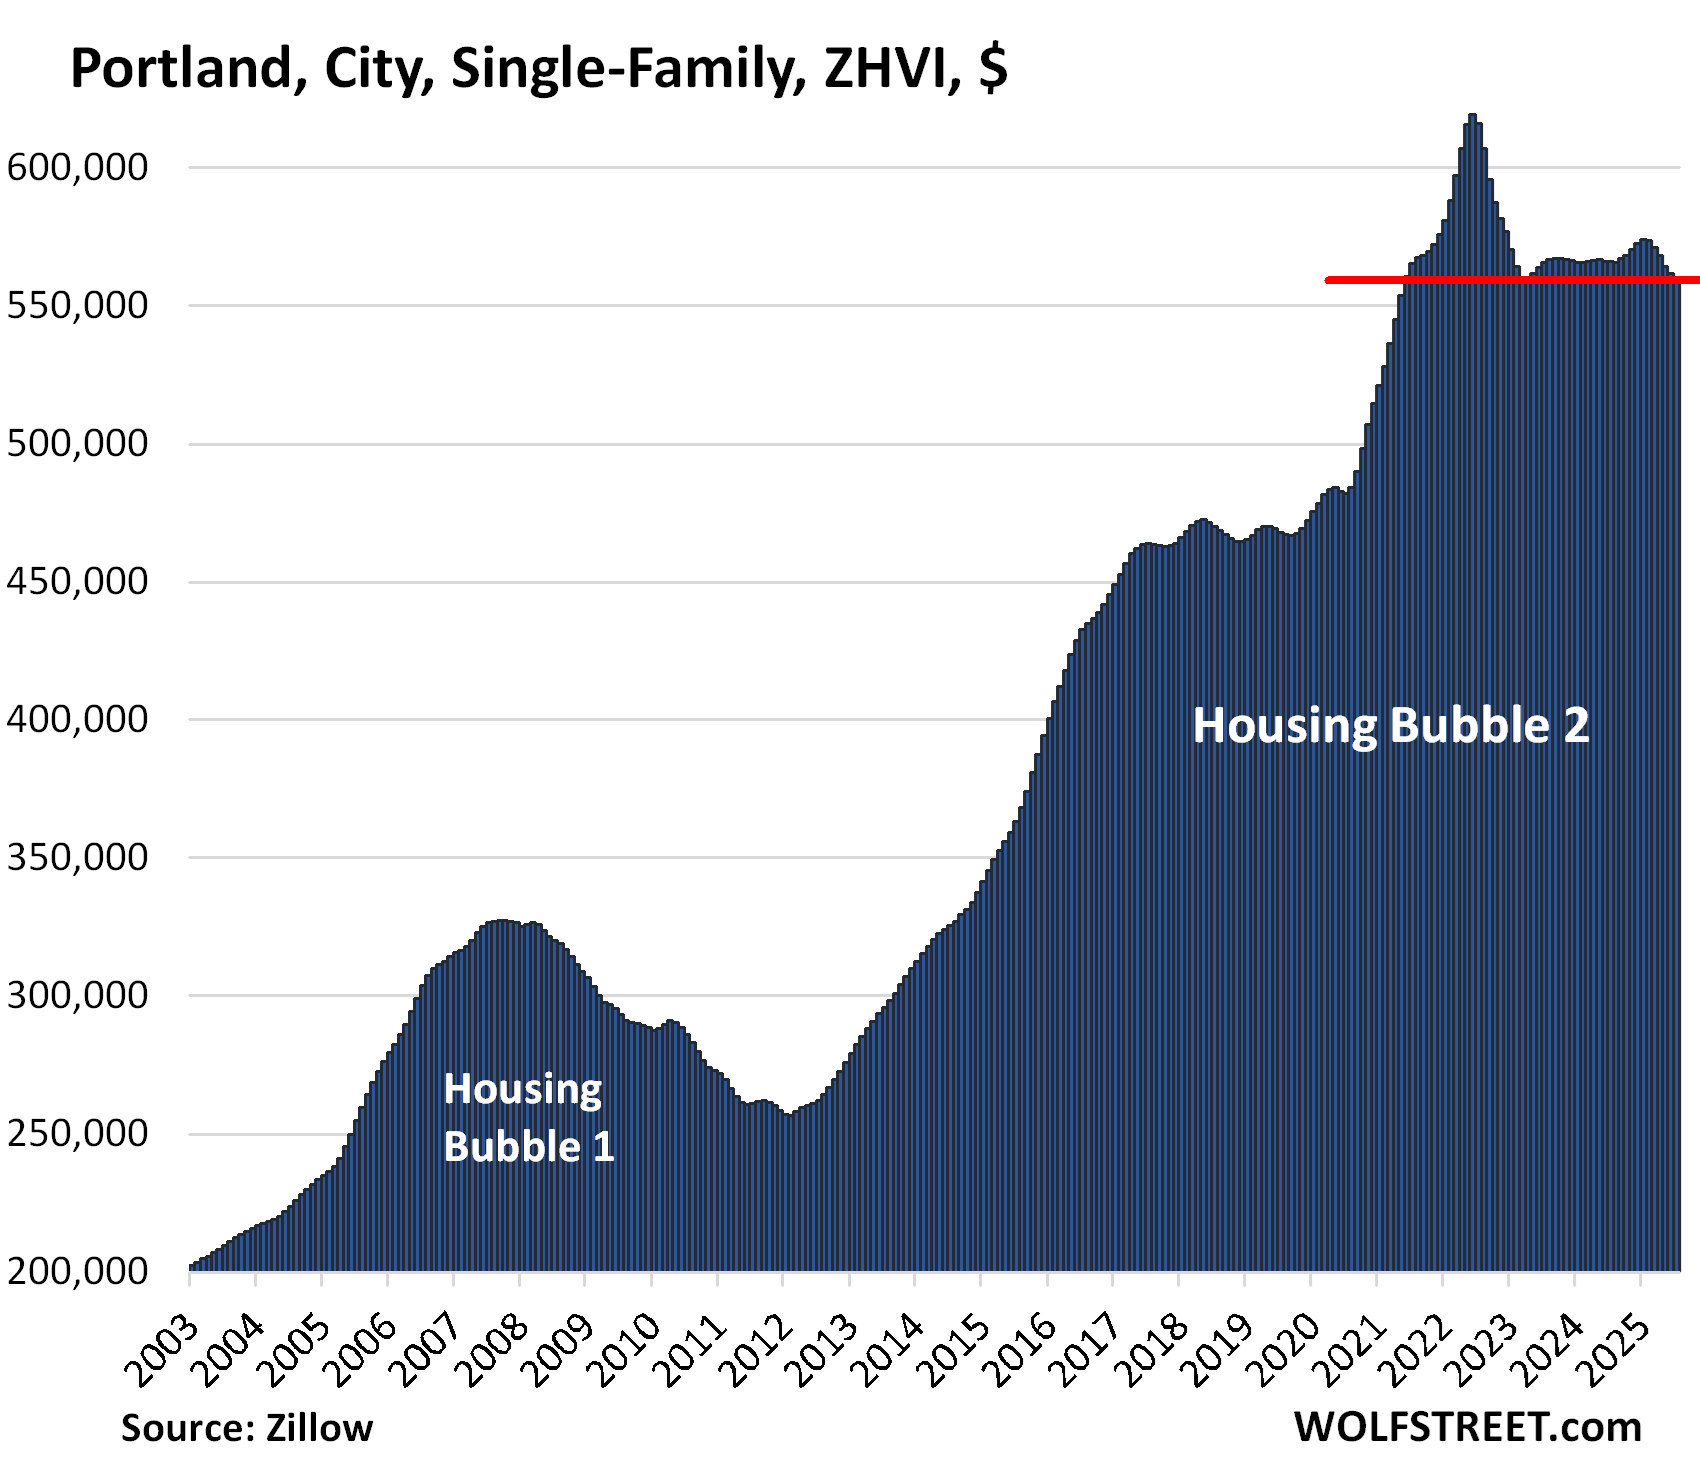
- Portland, OR: -10%
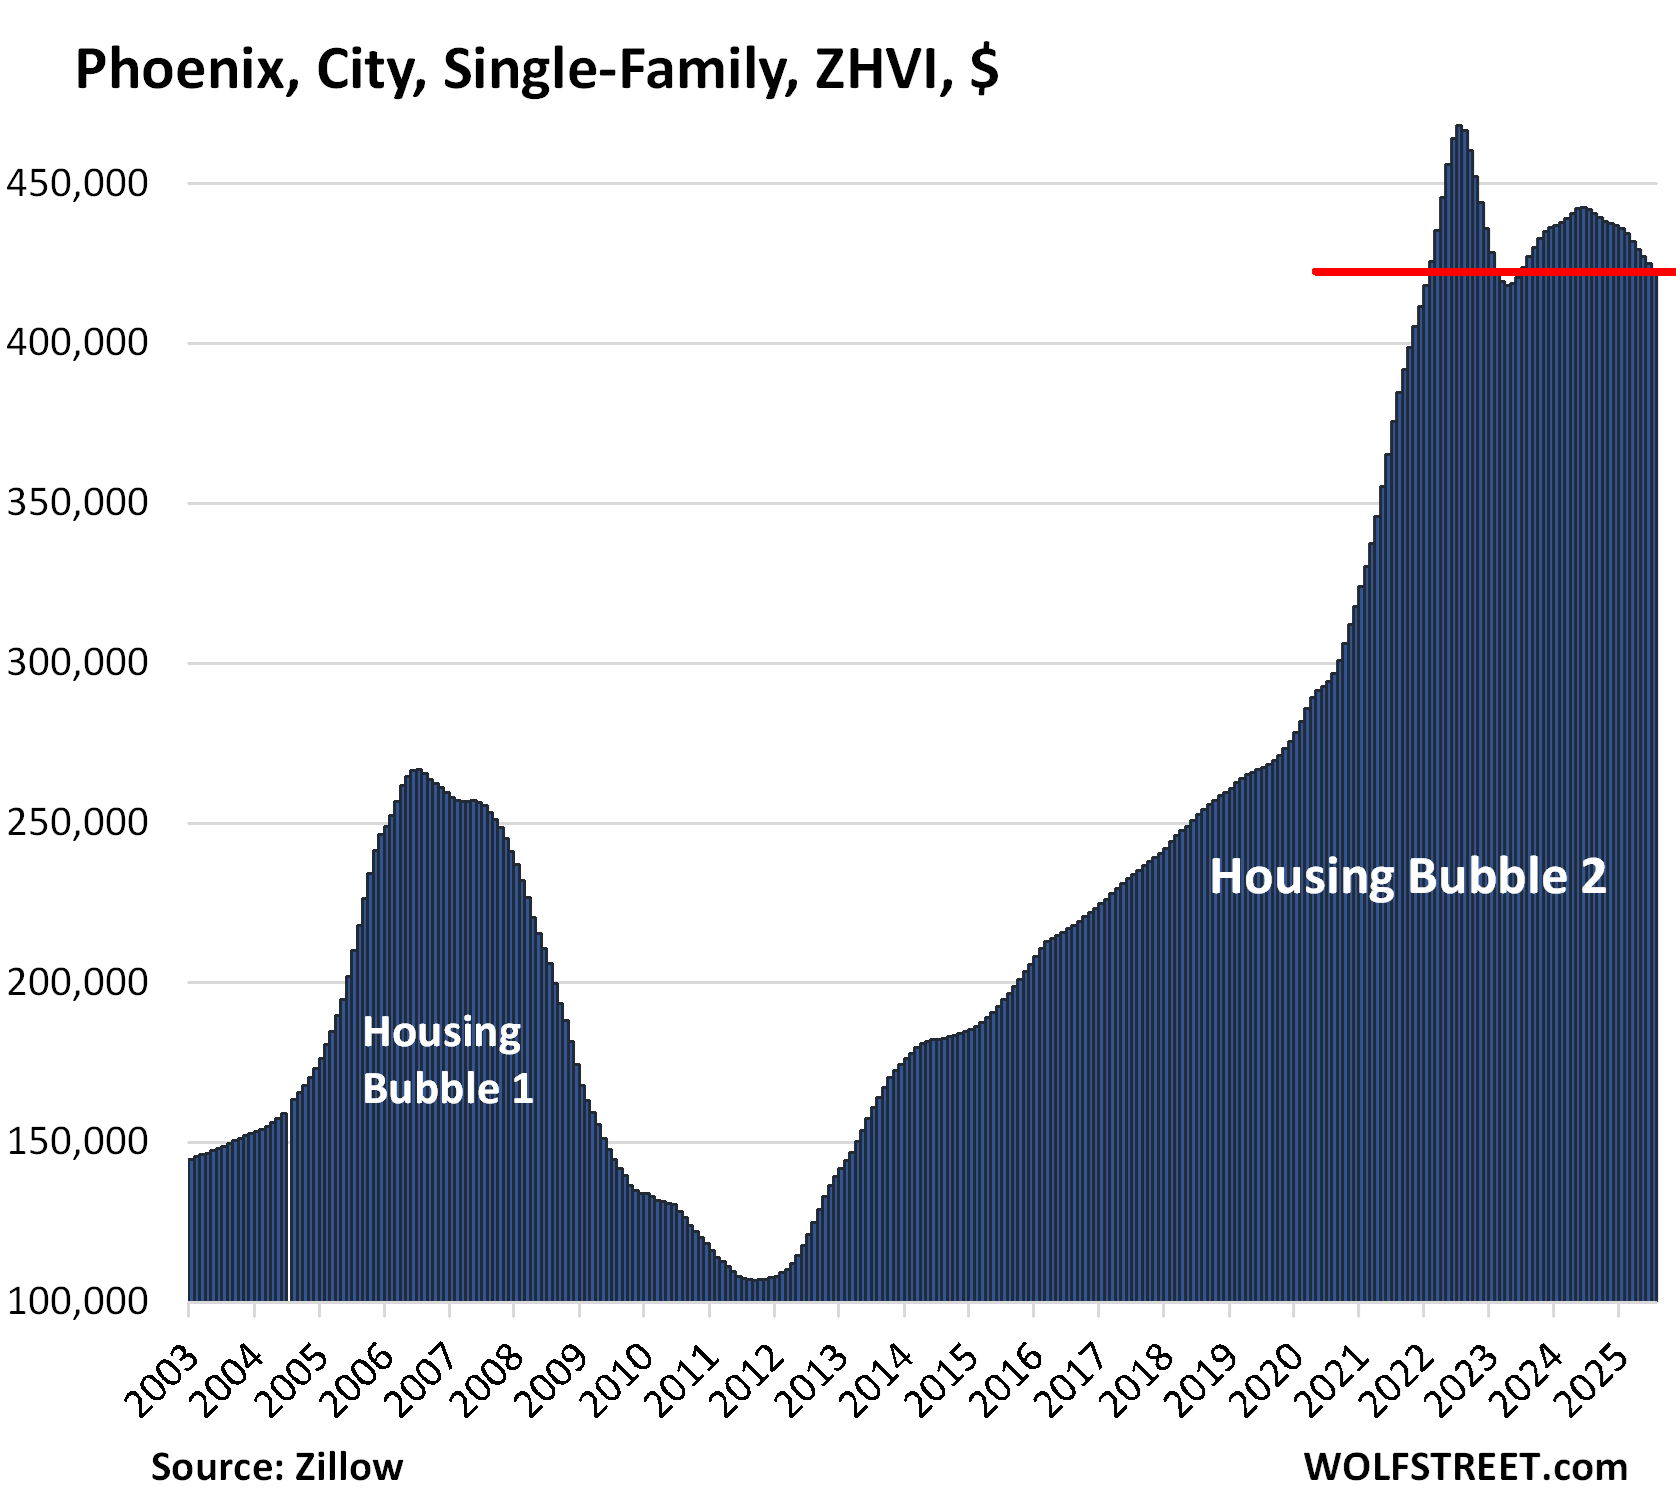
- Phoenix, AZ: -10%
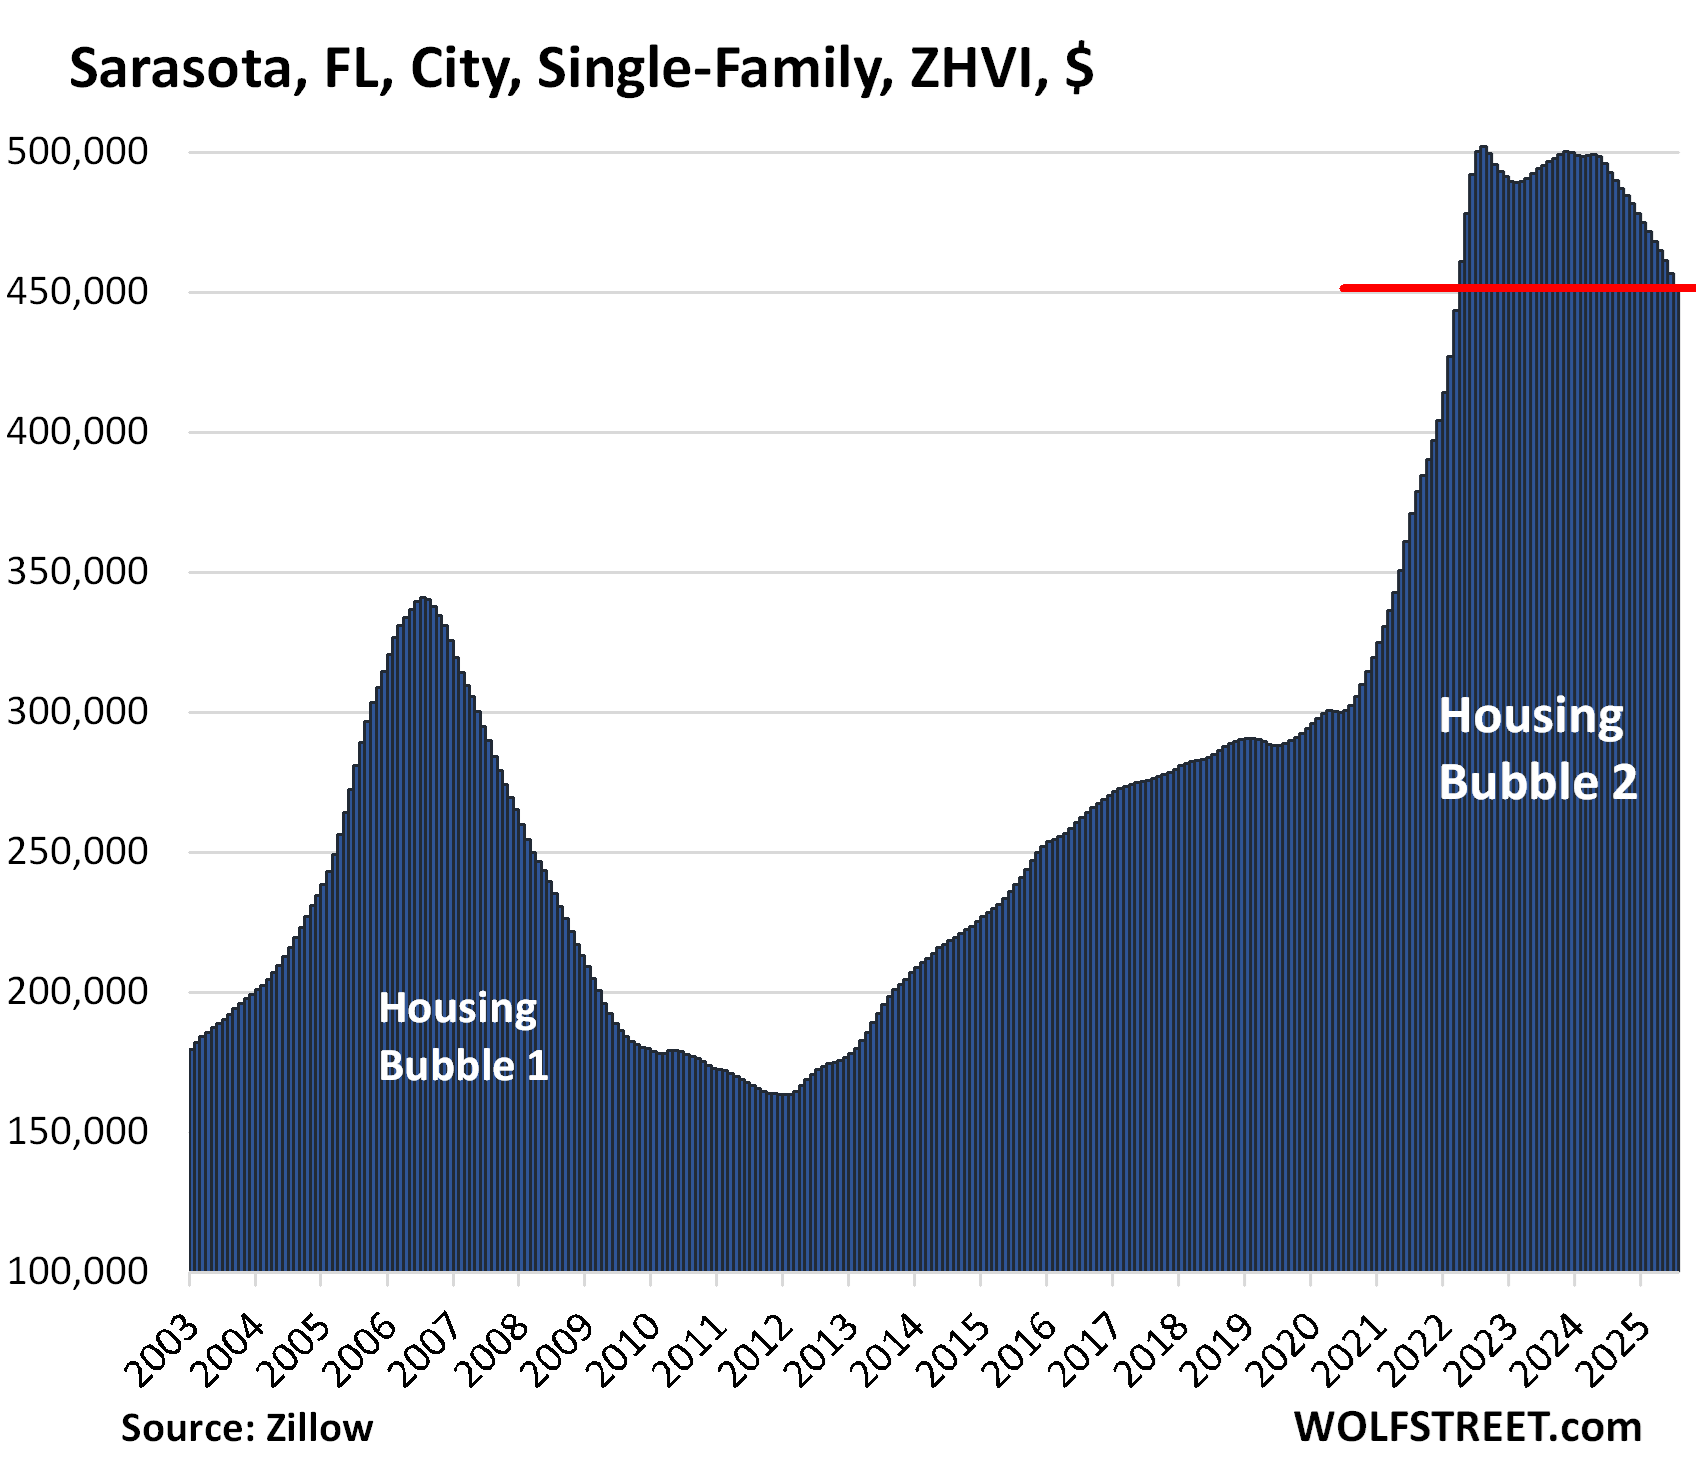
- Sarasota, FL: -10%
In four of the 12 cities, the price drops of mid-tier single-family homes have wiped out the entire or nearly the entire or more than the entire pandemic-era price spike. But in these four cities, the pandemic-era price spike didn’t measure up to the price explosion in some of the other cities.
In San Francisco, prices were already sky-high at the beginning of the pandemic – $1.47 million for a single-family mid-tier home – and had already hit a ceiling, and with some of the highly paid tech talent leaving during the pandemic, price increases were much smaller than in other cities where the Free Money era did its magic:
- San Francisco
- Oakland
- Washington, DC
- New Orleans.
Month-over-month, single-family home prices declined in all of the 12 cities in July, topped off by:
- Oakland: -1.5%
- Myers: -1.3%
- Sarasota: -1.2%
- Cape Coral: -1.2%
- Austin: -0.8%
Year-over-year, prices also declined in all 12 cities in July, topped off by:
- Oakland: -9.8%
- Fort Myers: -9.8%
- Cape Coral: -9.6%
- Sarasota: -8.4%
- Austin: -6.7%
Condo prices have skidded downhill faster than prices of single-family homes: Condo Prices Already Dropped by 12%-26% in 21 Bigger Cities through July. Condo Bust Takes Shape
Methodology and data: These prices are seasonally adjusted three-month averages of single-family mid-tier homes in “cities” (not in Metropolitan Statistical Areas, which are much larger). All data here are from the Zillow Home Value Index (ZHVI), which is based on millions of data points in Zillow’s “Database of All Homes,” including from public records (tax data), MLS, brokerages, local Realtor Associations, real-estate agents, and households across the US. It includes pricing data for off-market deals and for-sale-by-owner deals. These are not median prices.
The 12 Cities with the biggest price declines:
The metrics in each table from left to right: price decline from the peak, month-over-month change (MoM), year-over-year change (YoY), and increase since January 2000 (or 2022 as indicated).
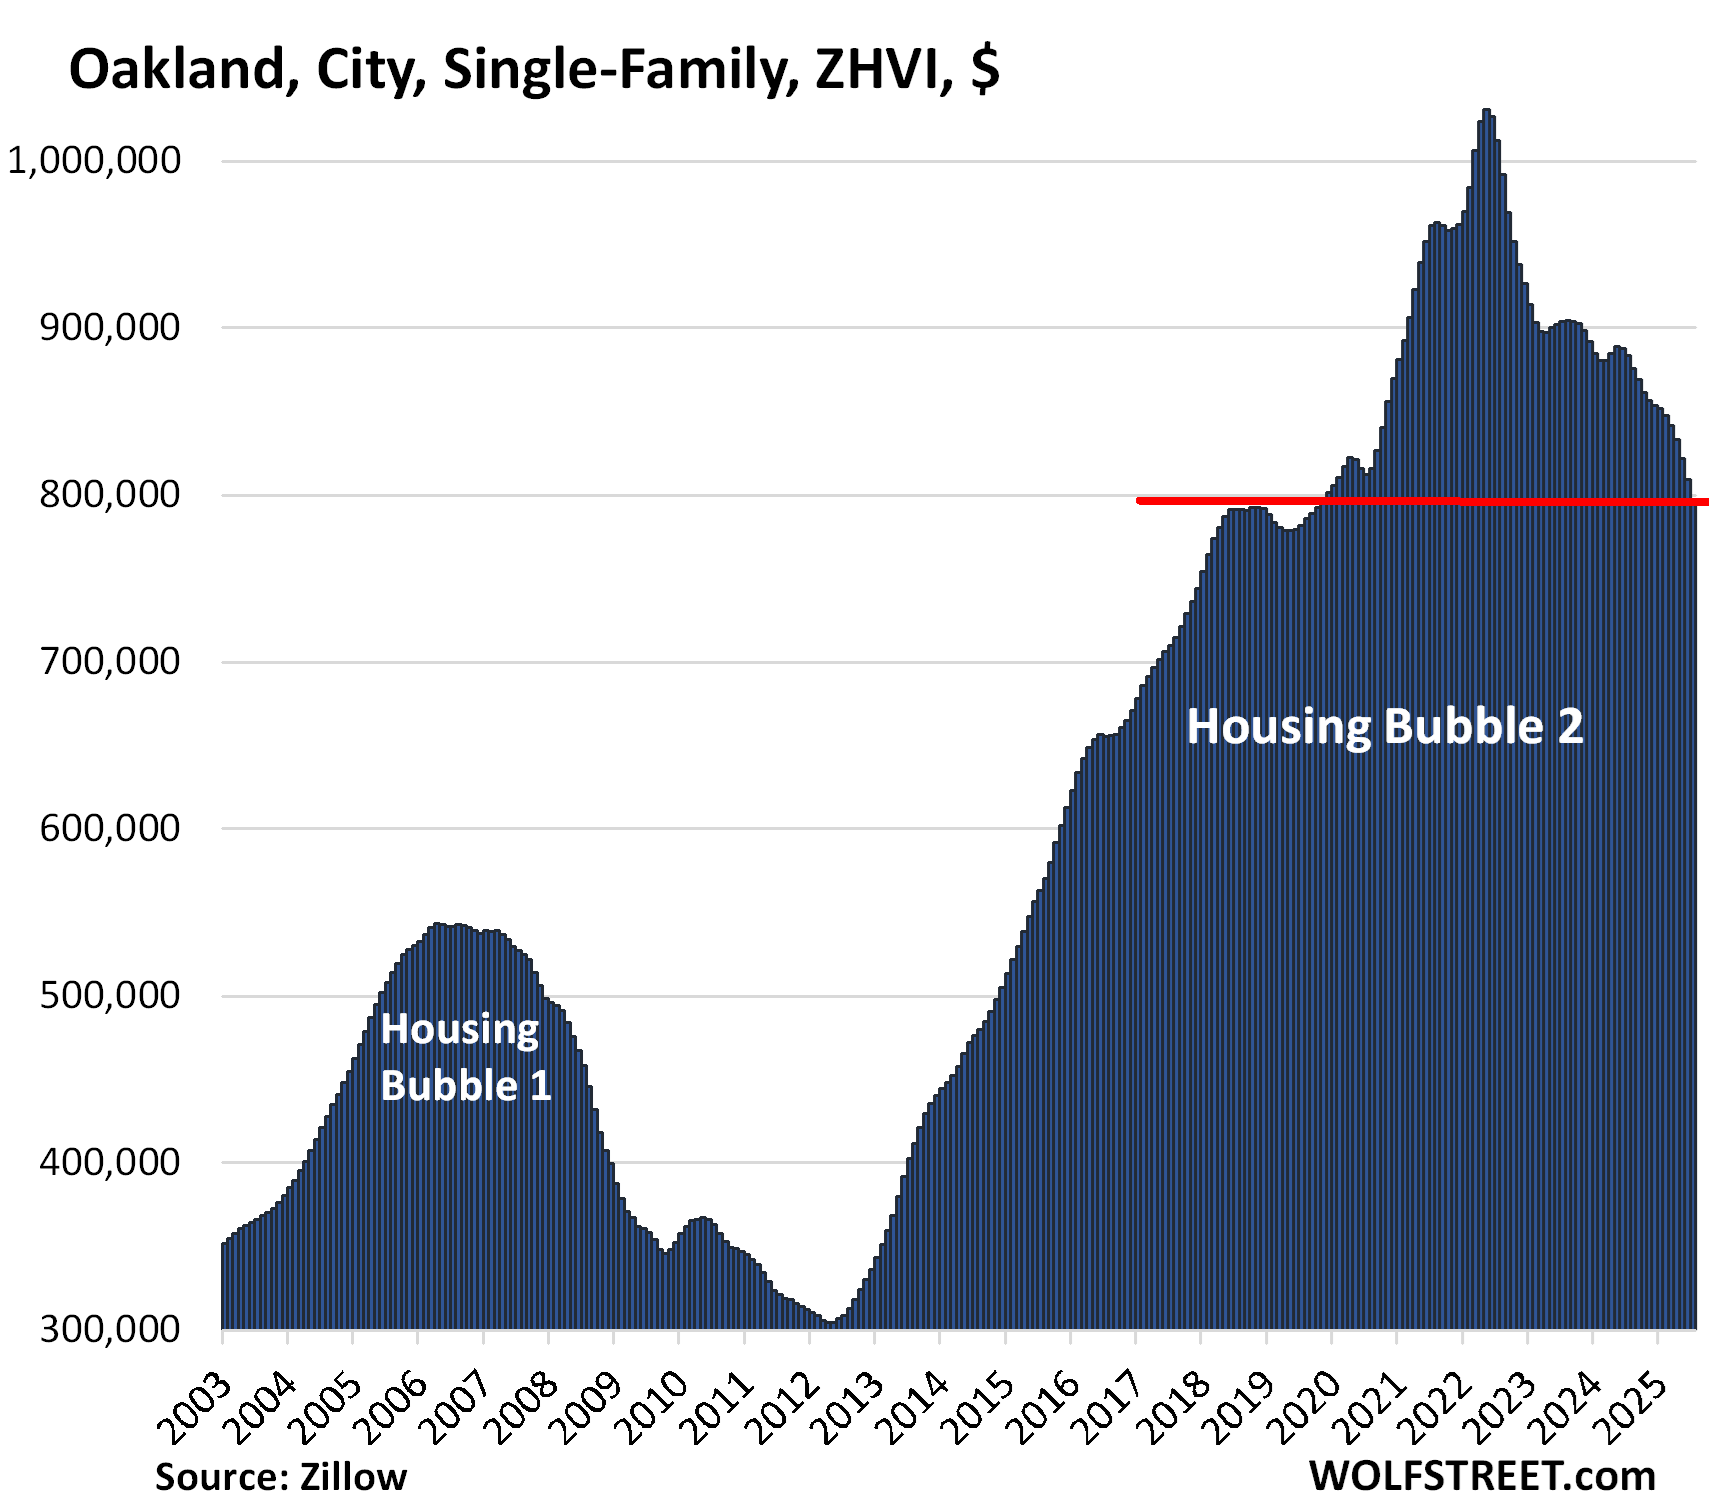
| Oakland, City, Single-Family Home Prices | |||
| From May 2022 peak | MoM | YoY | Since 2000 |
| -23% | -1.5% | -9.8% | 285% |
The month-to-month plunges are adding up: -1.5% in July, -1.6% in June, -1.4% in May (seasonally adjusted). This was fast!
Prices are back to late 2019, and nearly back to late 2018, having wiped out 100% of the pandemic-era price spike plus some.
In the decade between mid-2012 and the peak in May 2022, prices had exploded by 236%.
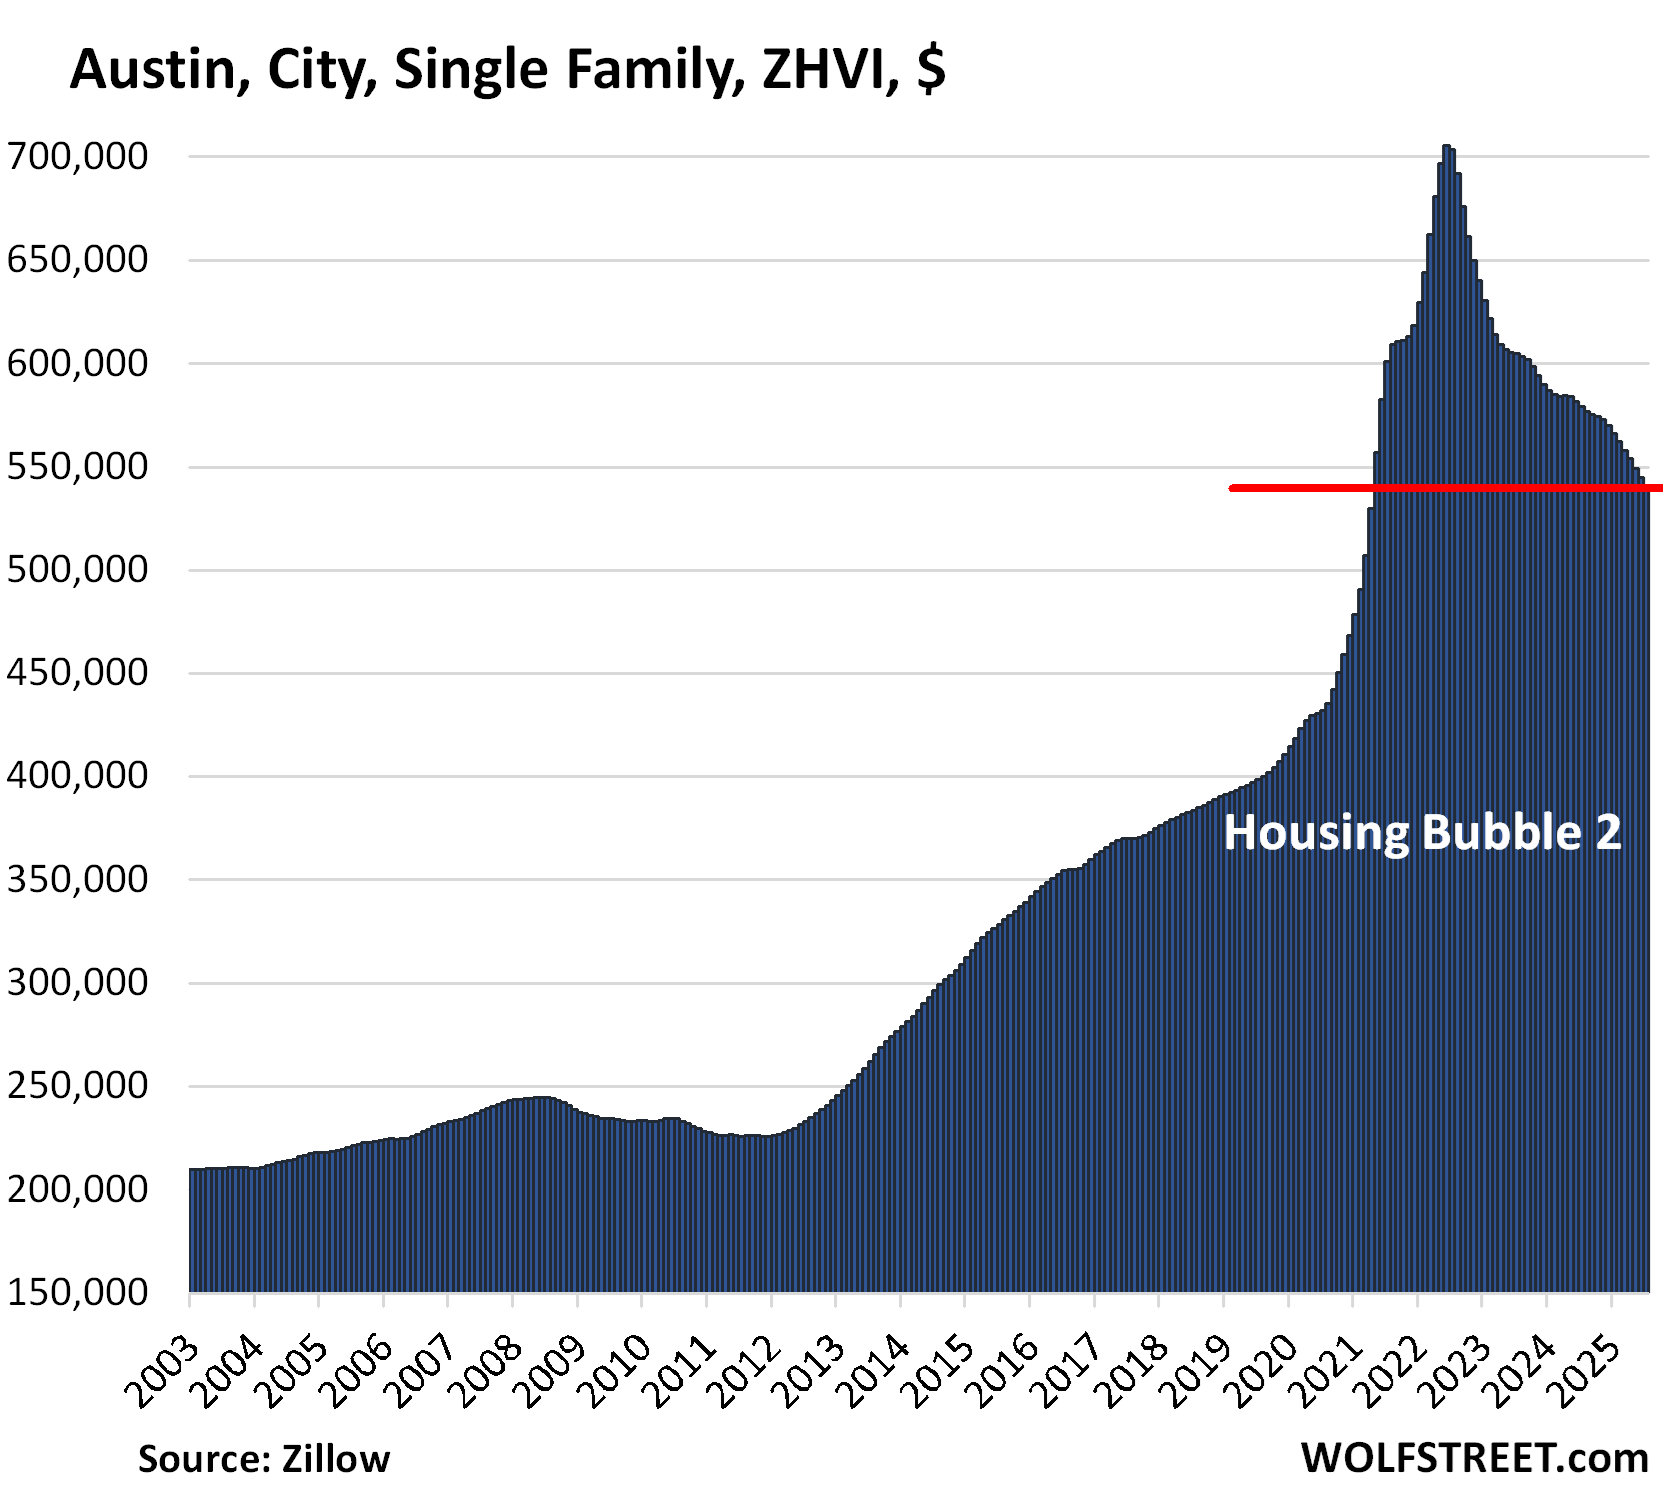
| Austin, City, Single-Family Home Prices | |||
| From Jun 2022 peak | MoM | YoY | Since 2000 |
| -23% | -0.8% | -6.7% | 168% |
Prices of single-family mid-tier homes exploded by 64% in two years between mid-2020 and mid-2022. They’re now back where they’d first been in May 2021, having wiped out 60% of the pandemic-era price explosion.
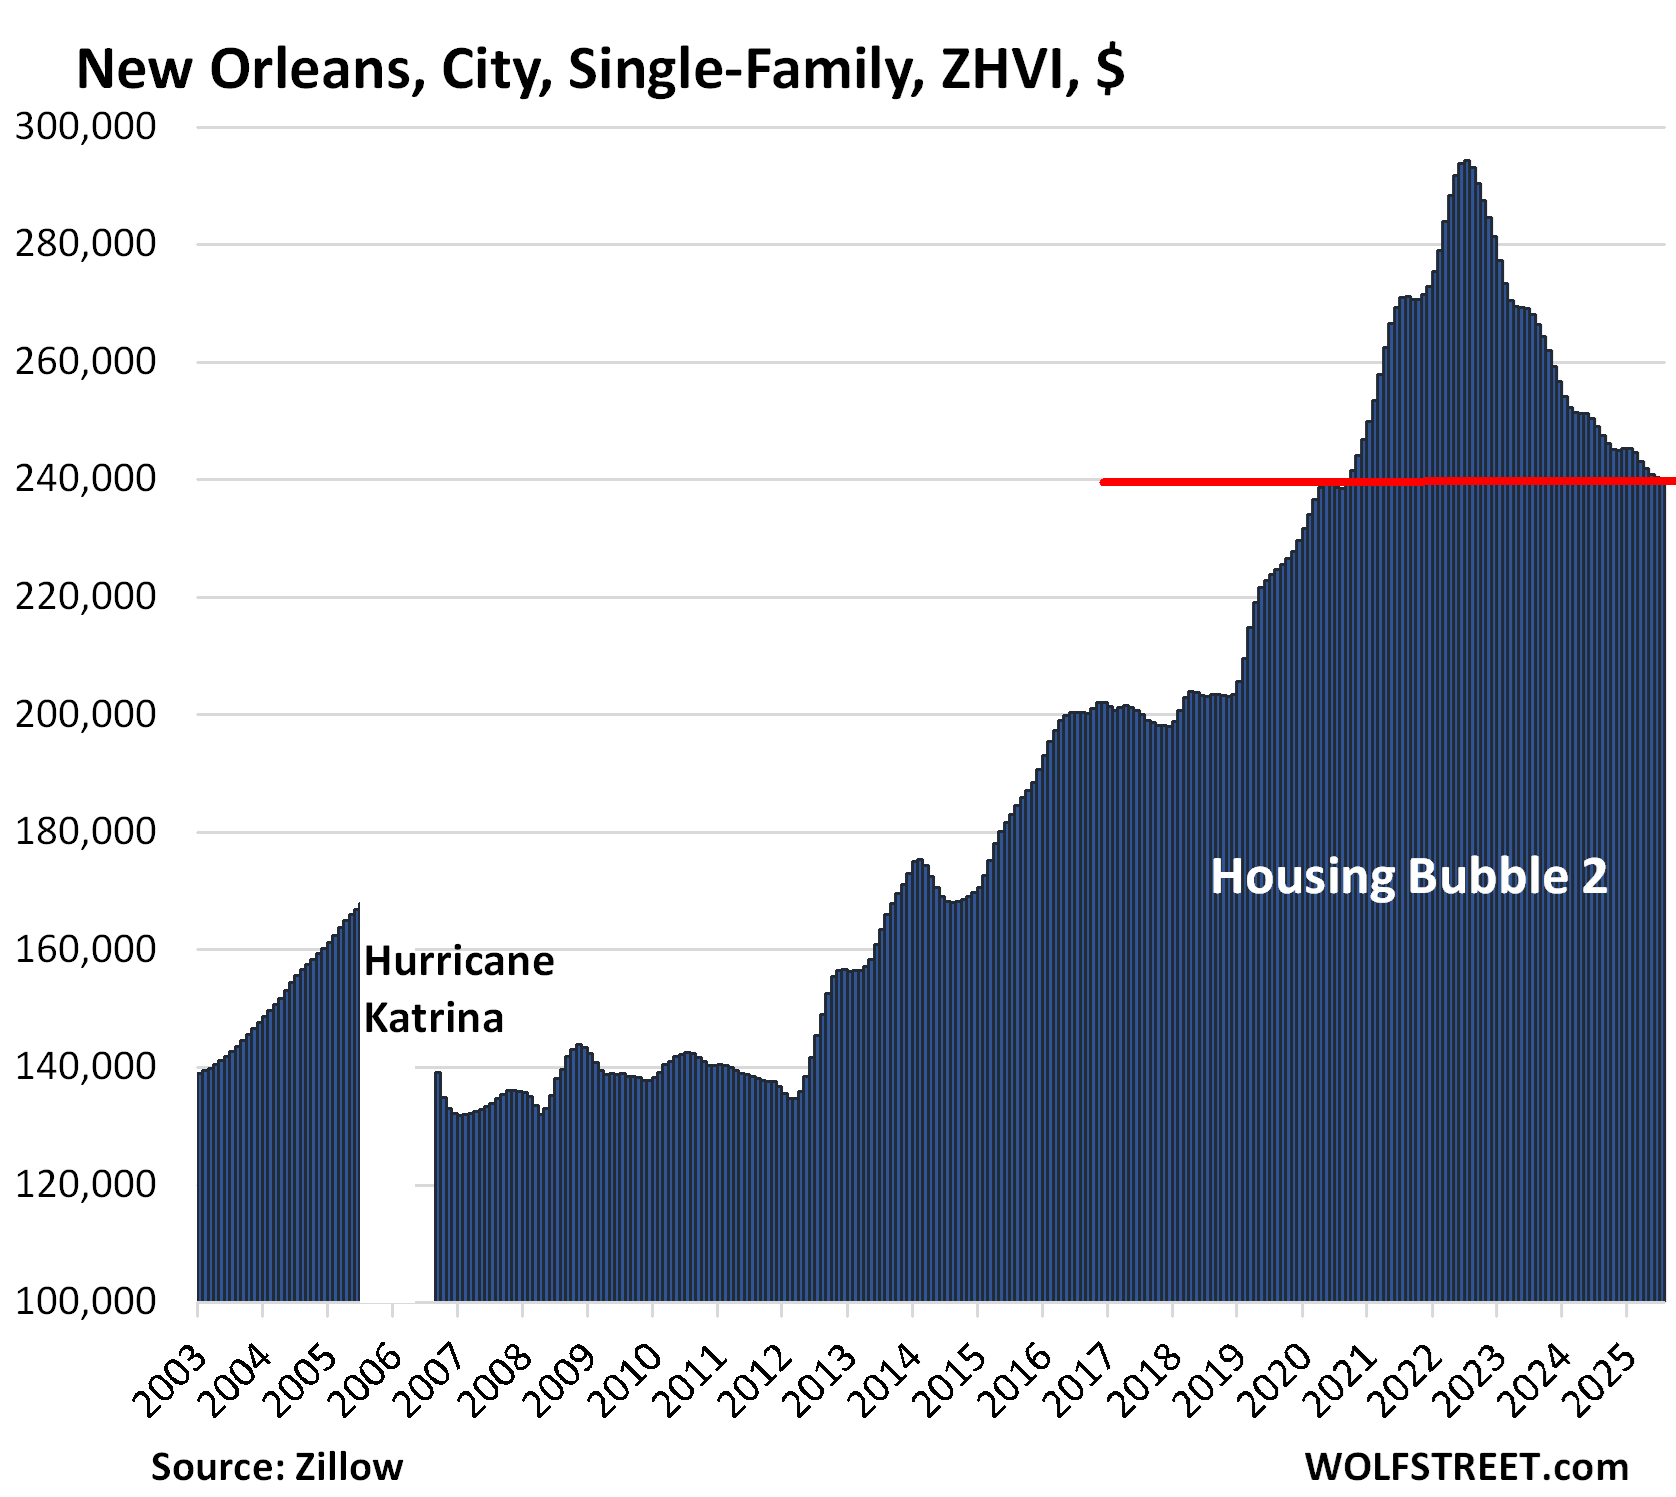
| New Orleans, City, Single-Family Home Prices | |||
| From Jun 2022 peak | MoM | YoY | Since 2007 |
| -18% | -0.1% | -3.6% | 108% |
Back to September 2020, having undone nearly 100% of the pandemic-era price spike.
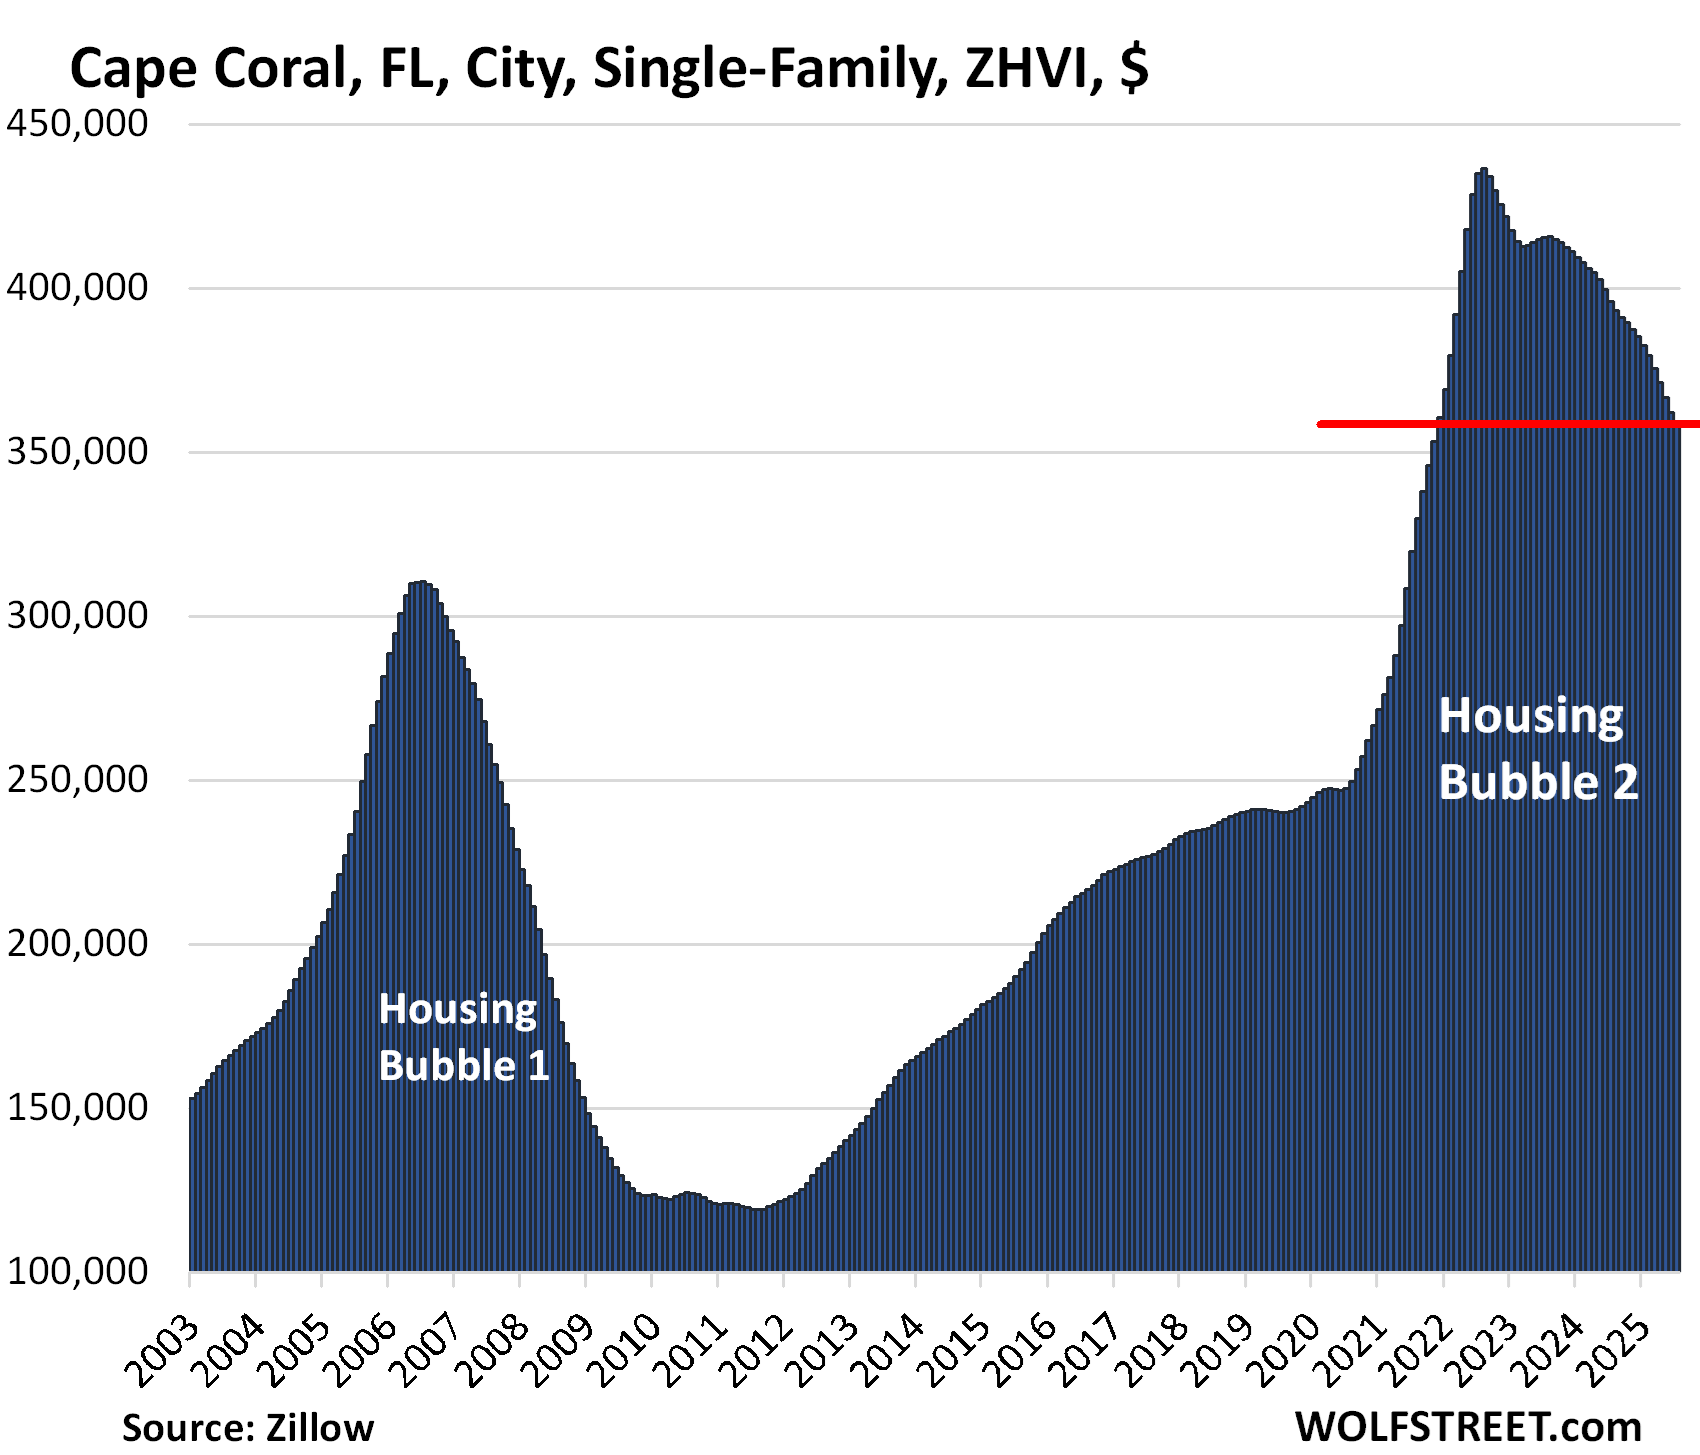
| Cape Coral, City, Single-Family Home Prices | |||
| From Apr 2024 peak | MoM | YoY | Since 2000 |
| -18% | -1.2% | -9.6% | 220% |
Note the 9.6% year-over-year drop. This is going fast.
| San Francisco, City, Single-Family Home Prices | |||
| From May 2022 peak | MoM | YoY | Since 2000 |
| -16% | -0.4% | -1.0% | 233% |
Prices of single-family mid-tier homes are back to where they’d first been in May 2018. The entire pandemic-era price spike plus some have been undone.
| Birmingham, AL, City, Single-Family Home Prices | |||
| From Jul 2022 peak | MoM | YoY | Since 2002 |
| -15% | -0.1% | -4.8% | 32% |
| Washington D.C., Single-Family Home Prices | |||
| From Jun 2022 peak | MoM | YoY | Since 2000 |
| -12% | -0.6% | -4.4% | 274% |
Lowest since mid- 2020, having undone the entire pandemic-era price spike.
| Fort Myers, City, Single-Family Home Prices | |||
| From Apr 2024 peak | MoM | YoY | Since 2000 |
| -12% | -1.3% | -9.8% | 195% |
Note the 9.8% year-over-year drop.
| Denver, City, Single-Family Home Prices | |||
| From Jun 2022 peak | MoM | YoY | Since 2000 |
| -10% | -0.6% | -4.4% | 213% |
Back to November 2021. From mid-2012 through mid-2022, prices had spiked by 174%.
| Portland, City, Single-Family Home Prices | |||
| From May 2022 peak | MoM | YoY | Since 2000 |
| -10% | -0.2% | -1.0% | 222% |
Back to June 2021
| Phoenix, City, Single-Family Home Prices | |||
| From Jul 2022 peak | MoM | YoY | Since 2000 |
| -10% | -0.5% | -4.4% | 250% |
From mid-2012 through mid-2022, prices had spiked by 339%, over half of it from April 2020 through July 2022, which was completely nuts.
| Sarasota, FL, City, Single-Family Home Prices | |||
| From Apr 2024 peak | MoM | YoY | Since 2000 |
| -10% | -1.2% | -8.4% | 234% |
And in case you missed it:
Condo Prices Already Dropped by 12%-26% in 21 Bigger Cities through July. Condo Bust Takes Shape
Enjoy reading WOLF STREET and want to support it? You can donate. I appreciate it immensely. Click on the mug to find out how:

![]()
Wolf, I know back in 2008 Great Recession, there was a chart about how much the adjustable mortgages would be reset in subsequent years.
Given the hey day of housing since 2020, and rising rates since 2023, I wonder if there is a similar chart out there ?
Thanks
Newly issued adjustable-rate mortgages are now about 9% of total new mortgage issuance (Mortgage Bankers Association). So that’s up from where it was during the 3% mortgage era, but it’s still pretty low.
ARMs are only a problem when interest rates shoot higher. But that phase has already happened. When interest rates decline, AMRs adjust downward.
During the 3% mortgage era, AMRs were a minuscule portion, and when interest rates shot higher starting in 2022, these folks had some struggles after the reset, and those already on floating rates, but the number was small, and the issue is now largely behind the market since rates have been high for several years.
The problem with adjustable mortgages is that if rates go up a lot, your new payments will cost you an ARM and a leg.
On a upbeat note:
A Mortgage is also known as a Death Pledge.
Enjoy your weekend!
☀️
chatGPT
Pose the query:
“The 12 Bigger Cities with the Biggest Price Declines of Single-Family Homes”
Even AI bows the knee to Wolf
(Artic) Wolf – picture a 747 jumbo jet full of people traveling at 500 mph at a 90 degree angle to the ground, at an altitude of 300 feet. Such is this current housing market. We all know the end result (‘we’ includes you). It’s too late to right the plane. There is no fix or solution. A 90 degree landing isn’t going to be pretty. Quite the opposite. Buckle up, ladies and gents!
A 45-degree landing is enough to make a mess.
I like that analogy, given each market moves at different speed and dynamic, since most SoCal areas are not yet on this list, I guess they are equivalent to being the back part of the plane instead of the front like Austin which already hit the ground?