Our Drunken Sailors and their Credit Cards.
By Wolf Richter for WOLF STREET.
Credit card delinquency rates improved further as our Drunken Sailors, as we lovingly and facetiously have come to call them here, are taking care of their business after a couple of stumbles.
The 30-day-plus delinquency rate on credit cards issued by all commercial banks declined to 2.87% at the end of Q2, the lowest since Q2 2023, according to the Federal Reserve today, based on data from commercial banks. This includes credit cards by subprime-rated cardholders.
The serious delinquency rate of 60-plus days at the end of Q2 for all bankcards, including subprime, dropped to 2.79%, the lowest since Q3 2023, per Equifax (blue in the chart).
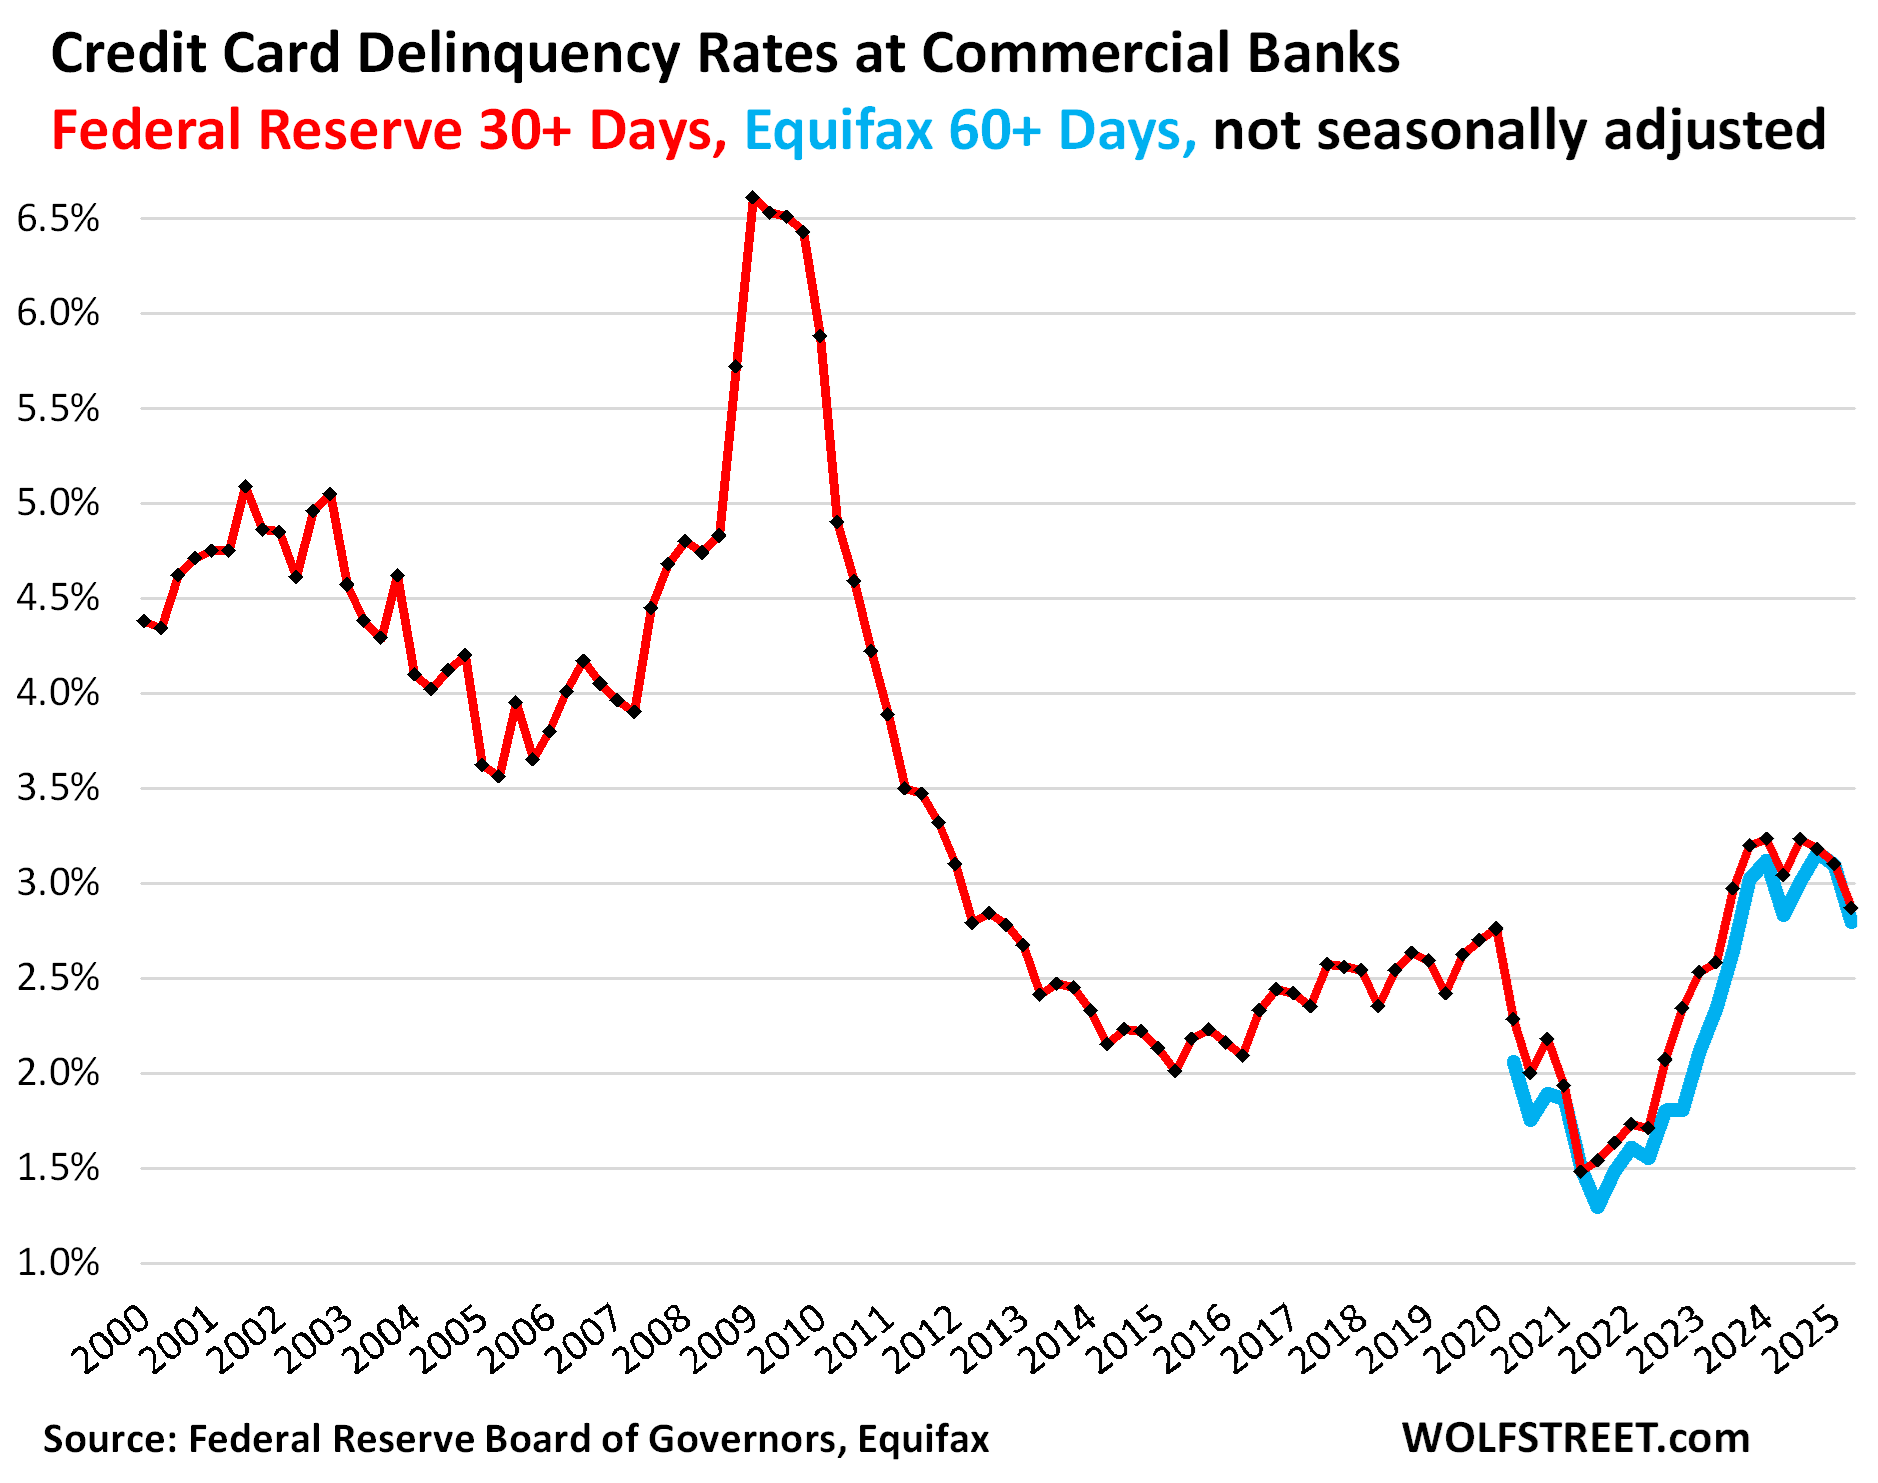
During the Free-Money era, delinquencies plunged for two reasons: the options to spend money on restaurants, flights, cruises, entertainment venues, etc. were limited, which caused credit card balances to plunge (see below); and some people used the free money to get caught up. But after the end of Free Money, delinquency rates overshot and peaked in Q2 2024, before declining again.
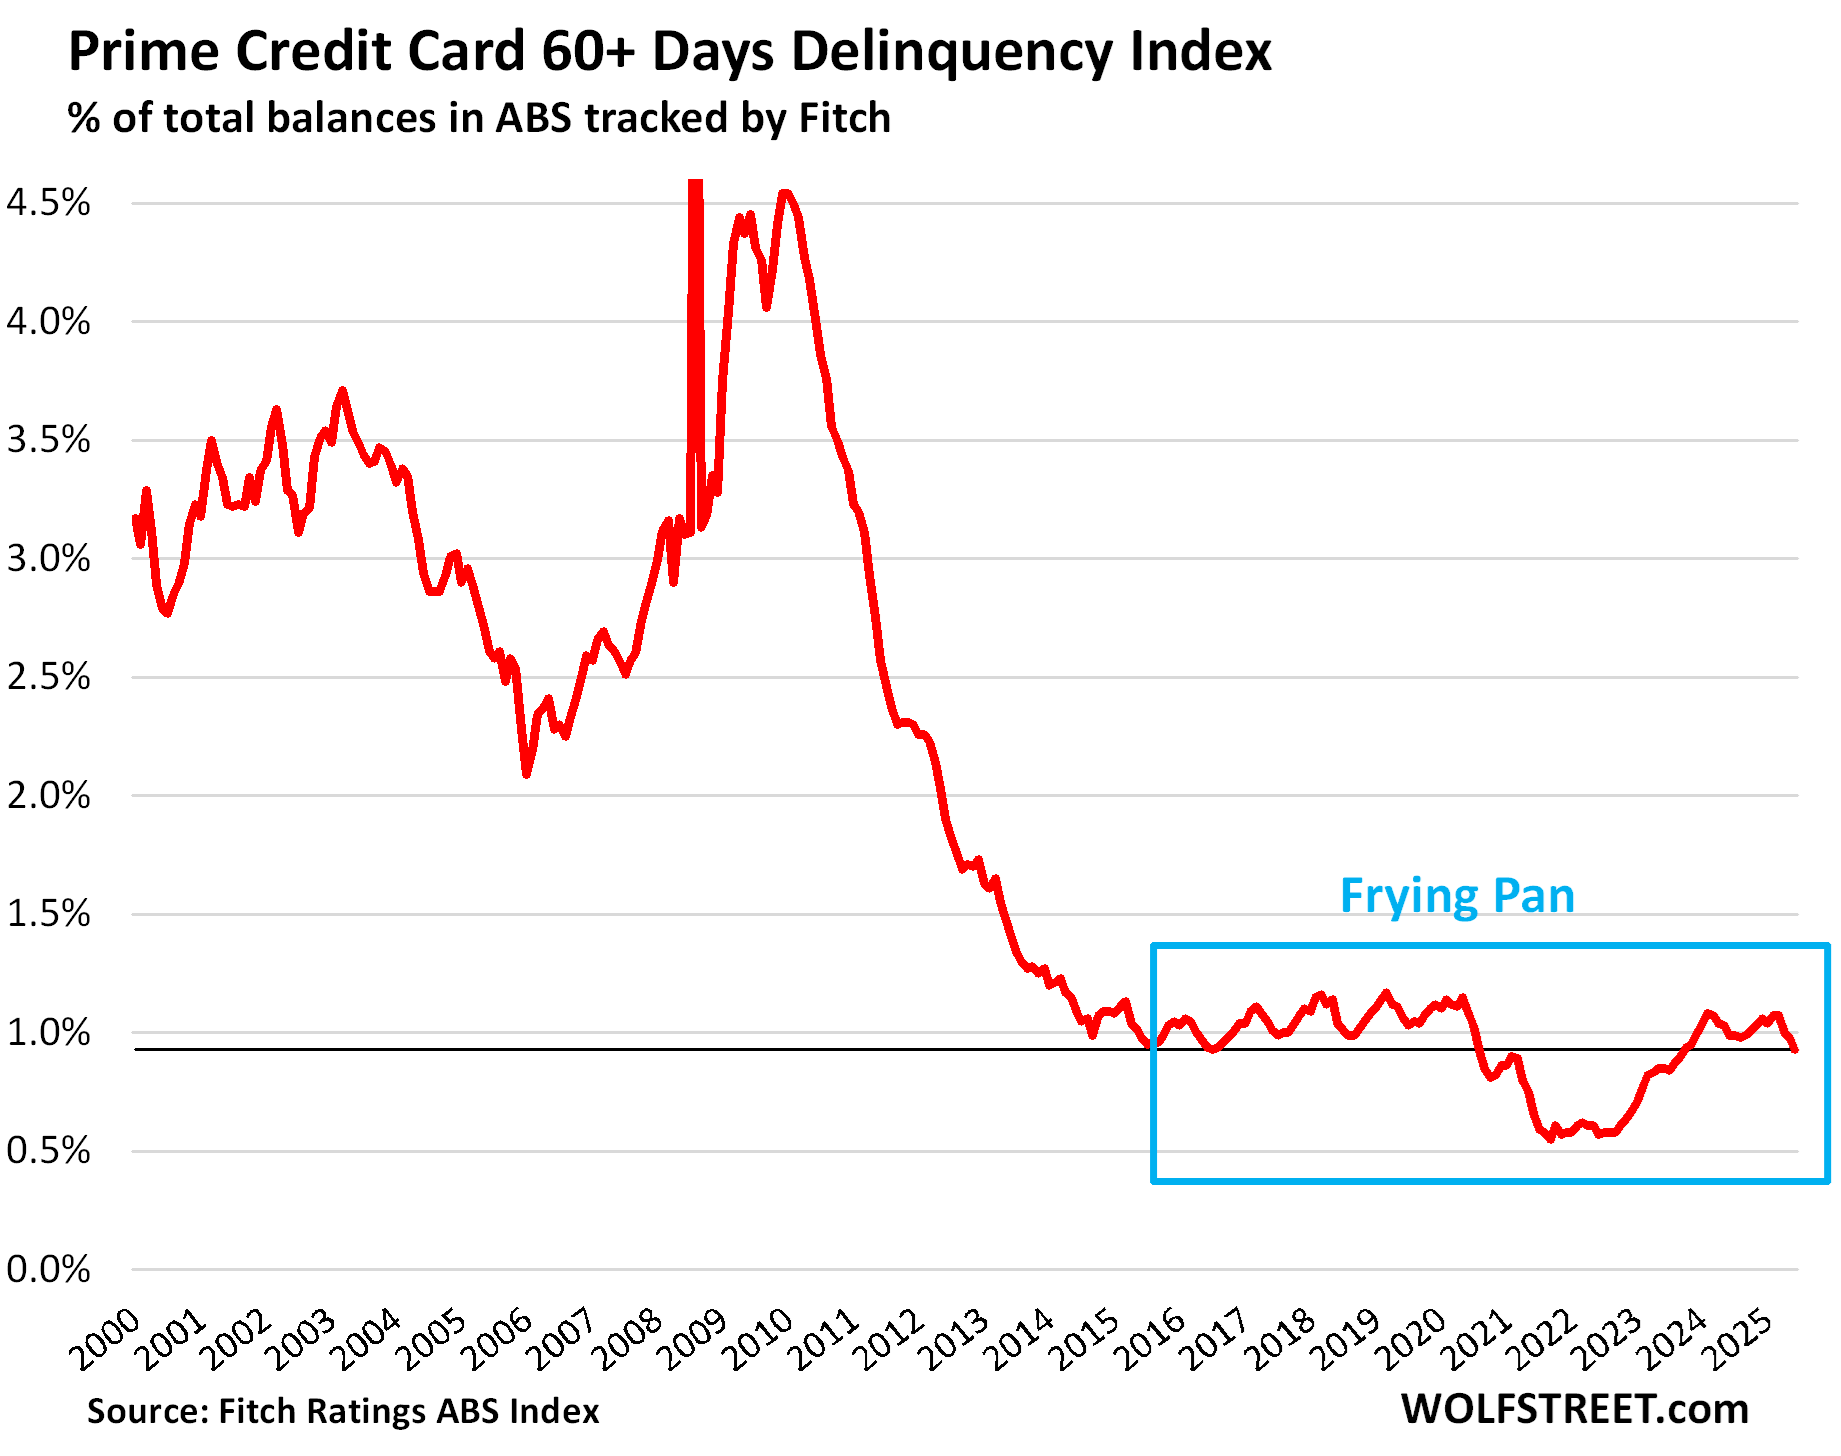
For prime-rated cardholders only, the serious delinquency rate of 60-plus days at the end of Q2 dropped to a pristine 0.93%, the lowest since Q3 2023, according to data from Fitch Ratings, which tracks the performance of Asset Backed Securities (ABS) backed by credit card balances whose holders had a prime credit rating when the accounts were opened.
This delinquency rate of 0.93% matches the record low before the Free-Money era in July 2016.
Note the “frying pan” pattern, as we have come to call it here, because we have seen it in so many other credit measures since the pandemic, during which the episode of Free Money altered everything, and when the Free Money was over, the metrics re-normalized.
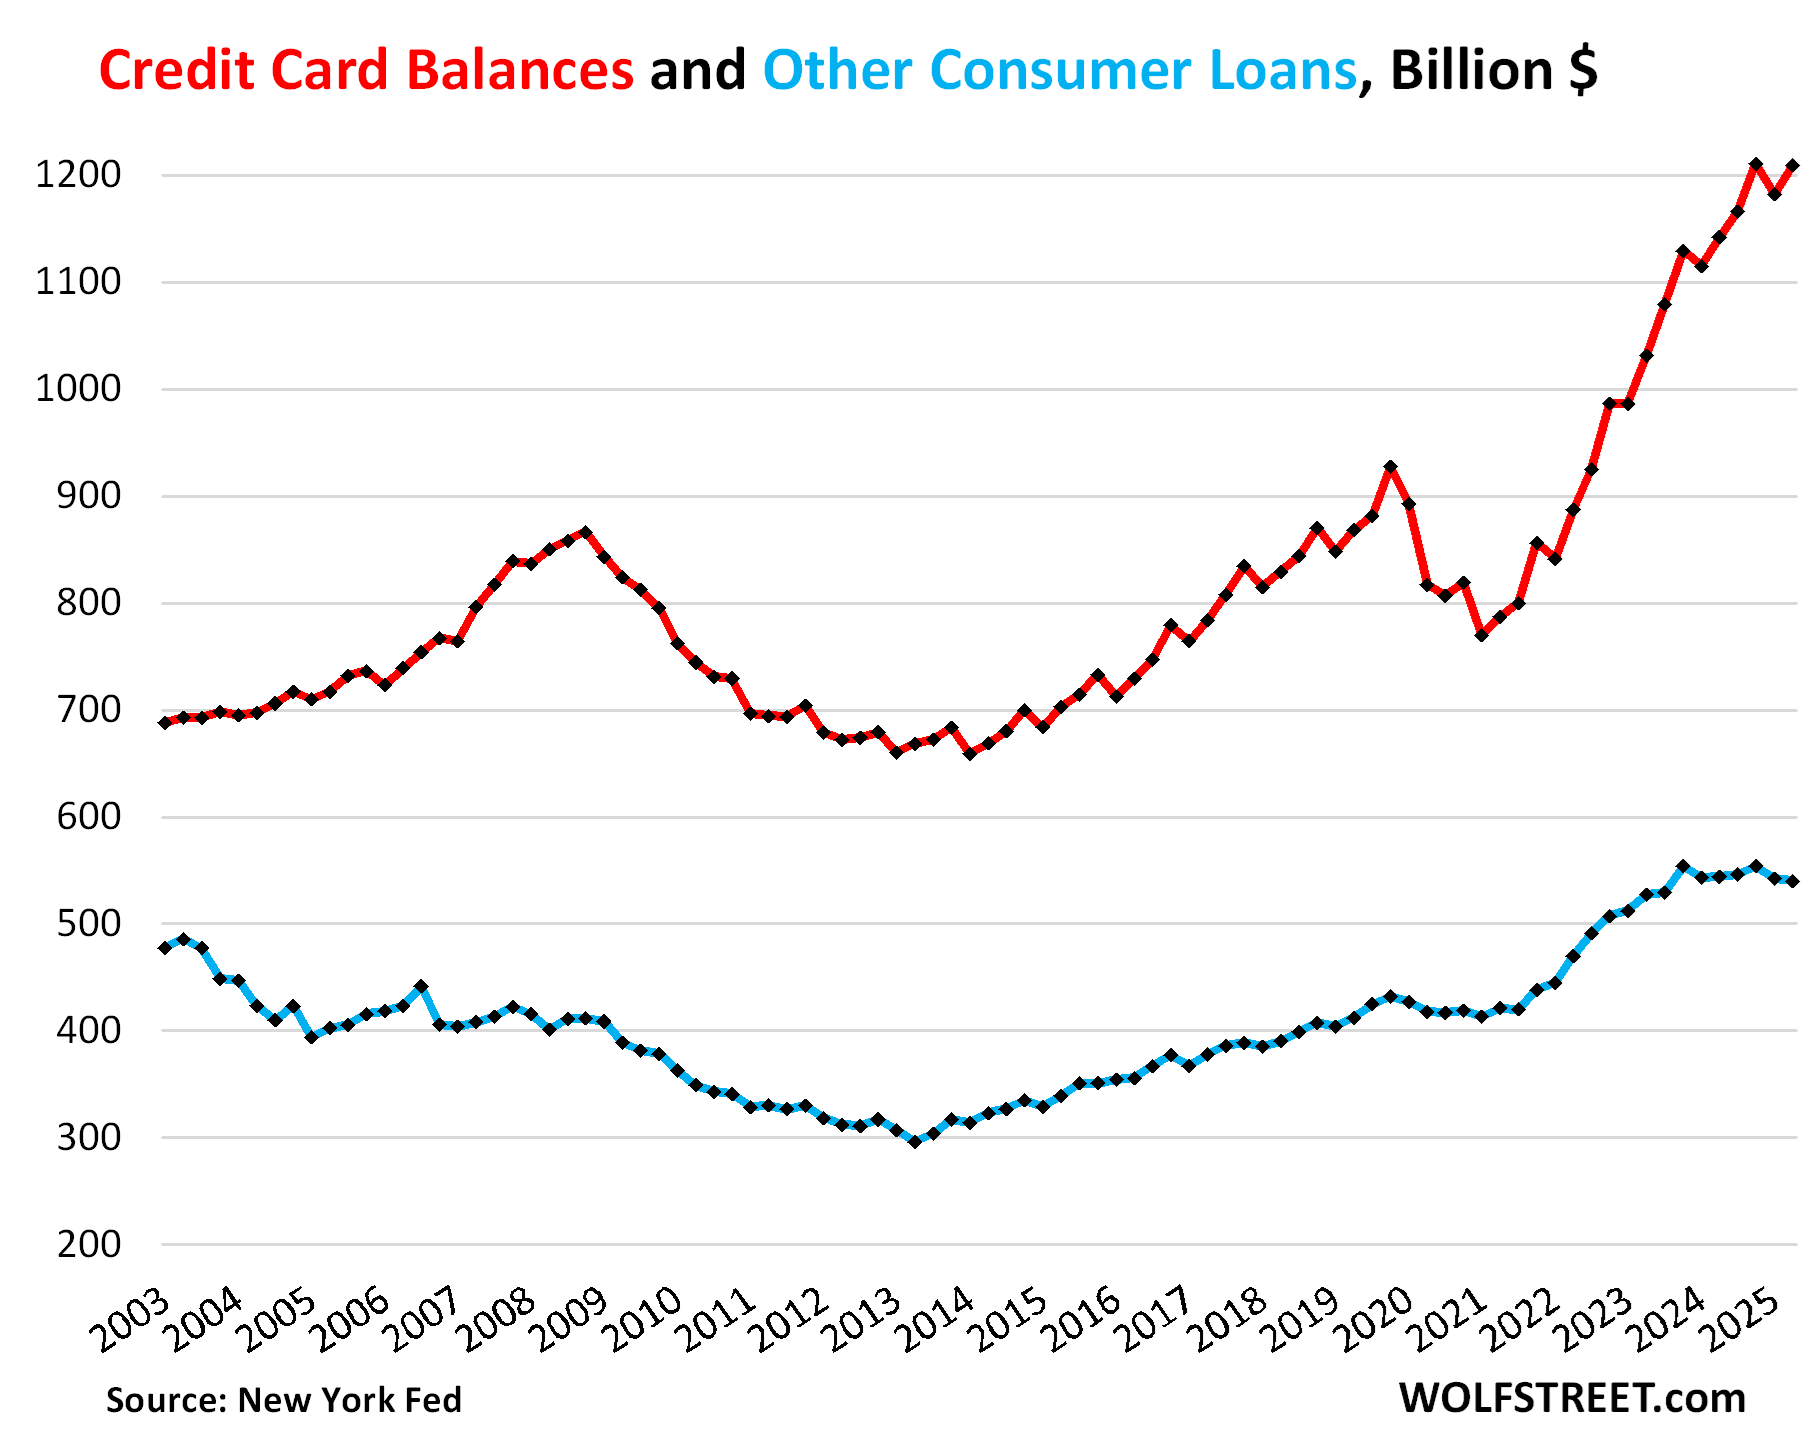
Credit card balances: a measure of spending.
Credit card balances (red line in the chart below) rose by $27 billion in Q2 from Q1, to $1.21 trillion, undoing the largely seasonal decline in Q1, and are back where they’d been in Q4, according to the New York Fed’s Household Debt and Credit report.
Year-over-year, credit card balances rose by 6.7% on growth in consumer spending and price increases.
Credit card balances are a measure of spending, not a measure of borrowing. Credit card balances are statement balances before payments are made. They reflect the fact that credit cards have become the dominant consumer payments method in the US and largely replaced checks and cash. Debit cards are the second most popular payment method. Credit cards are used to pay for anything, close to $6 trillion in transactions a year, from parking meters to business trips that get reimbursed. Most of these balances get paid off every month by due date and never accrue interest.
“Other” consumer loans (blue line), such as personal loans, Buy-Now-Pay-Later (BNPL) loans, and payday loans, dipped by $2 billion in Q2 to $540 billion, the second quarter-to-quarter decline in a row, and were down a hair from a year ago. Balances have barely risen over the past 22 years, despite the growth of the population, income, and spending over the period.
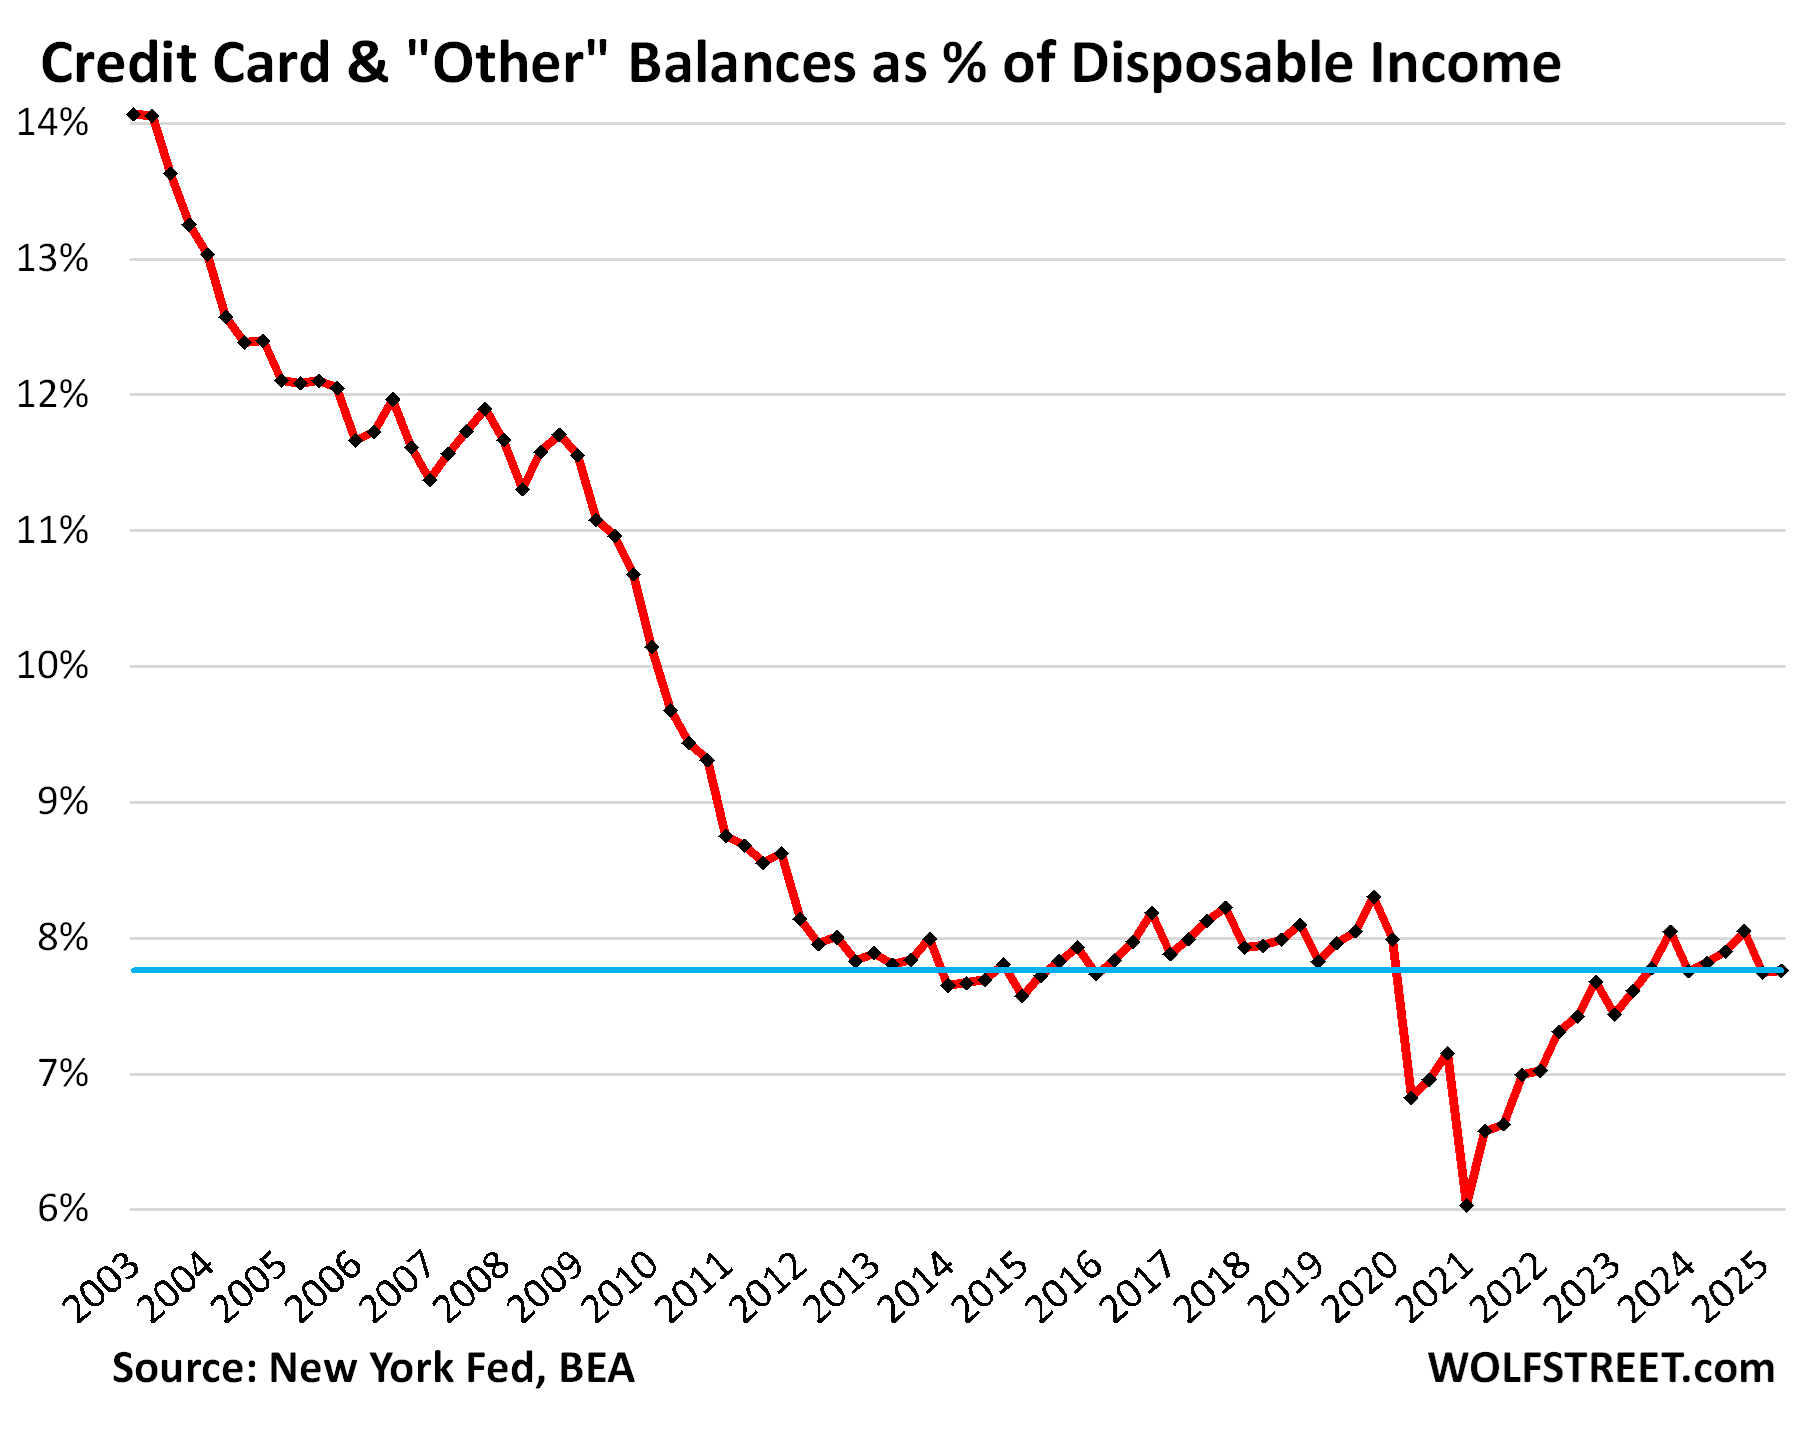
How much of a burden?
Credit card balances (red above) and “other” consumer debt (blue above) combined rose by $25 billion, or by 1.4%, in Q2 from Q1, to $1.75 trillion.
Year-over-year, they rose by $63 billion, or by 3.7%.
Debt-to-income ratios are classic measures of borrowers’ ability to deal with the burden of their debt. To track the burden of these combined balances of credit cards and other revolving credit on consumers overall, we look at their relationship to disposable income.
Disposable income, released by the Bureau of Economic Analysis, is household income from all sources except capital gains, minus payroll taxes: So income from after-tax wages, plus income from interest, dividends, rentals, farm income, small business income, transfer payments from the government, etc. Disposable income is essentially what consumers have available to spend and service their debts.
Quarter over quarter, disposable income rose slightly slower than the combined credit card & other credit balances, but year-over-year disposable income rose faster:
- QoQ: disposable income +1.25%, credit card & other +1.45%.
- YoY: disposable income +4.5%, credit card & other +3.7%.
So the ratio of disposable income to credit card & other balances inched up a hair to 7.76% in Q2, from 7.75% in Q1, but was lower than a year ago.
During the Free-Money era, when disposable income spiked in a grotesque manner, the ratio had plunged to just 6%. But the Free Money is over, and the ratio has now come back up to the very low end of the pre-Free-Money era.
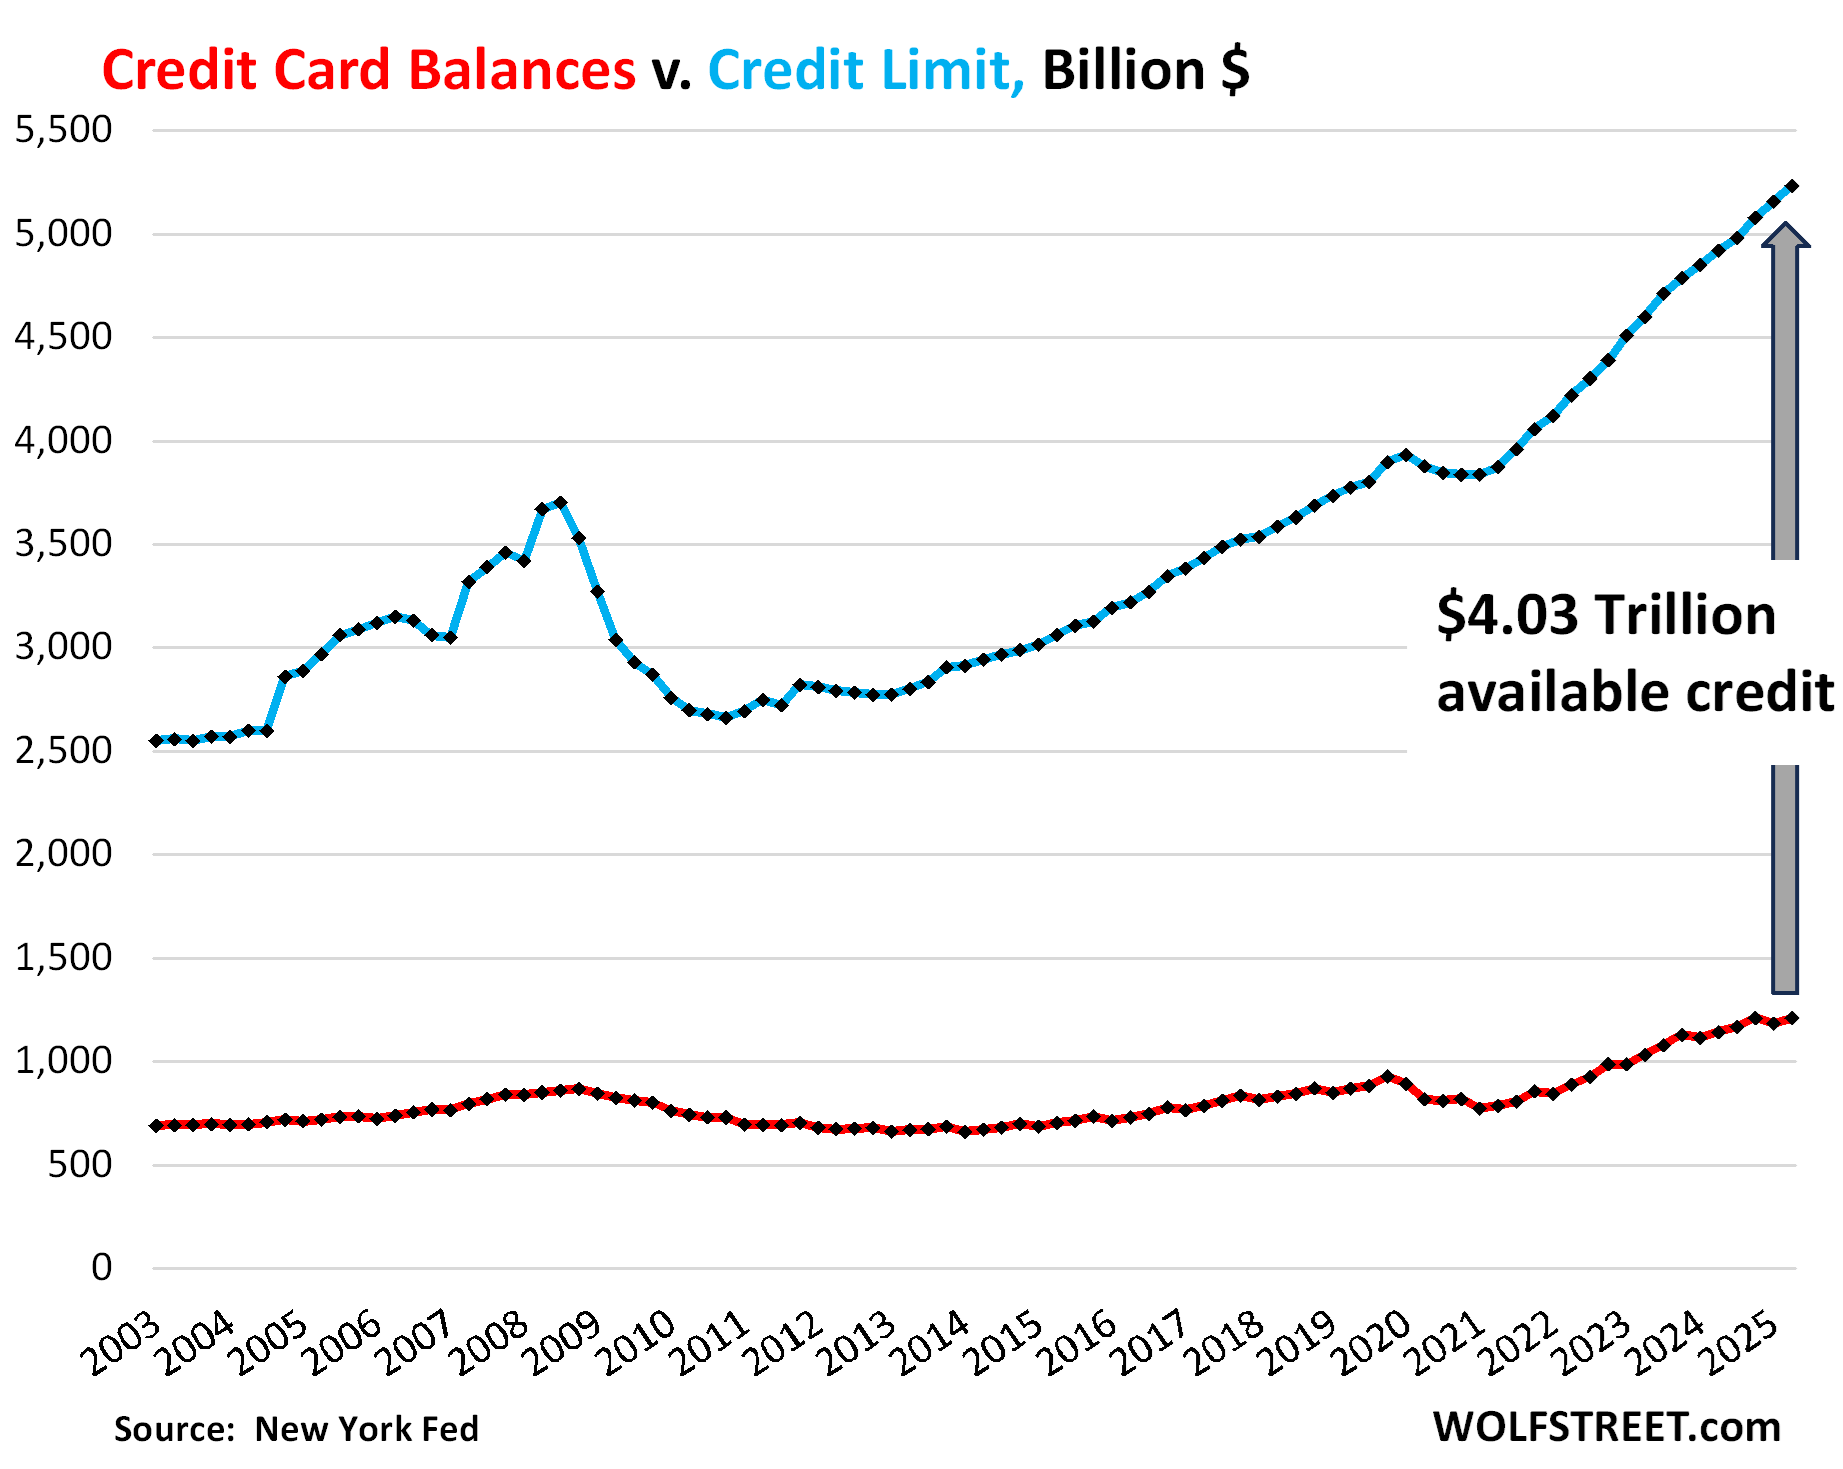
Credit Limits & Available Credit expand to new high.
To increase their income from swipe fees, banks are trying aggressively to get people to set up new credit card accounts, and they have raised the credit limits of existing accounts, and the aggregate credit limit has surged from record to record and in Q2 hit a record $5.23 trillion (blue in the chart below).
And thereby the total available unused credit – aggregate credit limit (blue) minus credit card balances (red) – rose to a record $4.03 trillion (gray arrows).
During and after the Great Recession, the teetering banks had cut credit limits and closed accounts to reduce their risk exposure, which caused aggregate credit limits to plunge by 28% through 2010. During the early parts of the pandemic, banks had also reduced their potential exposure to credit cards, creating another but smaller dip in credit-card limits.
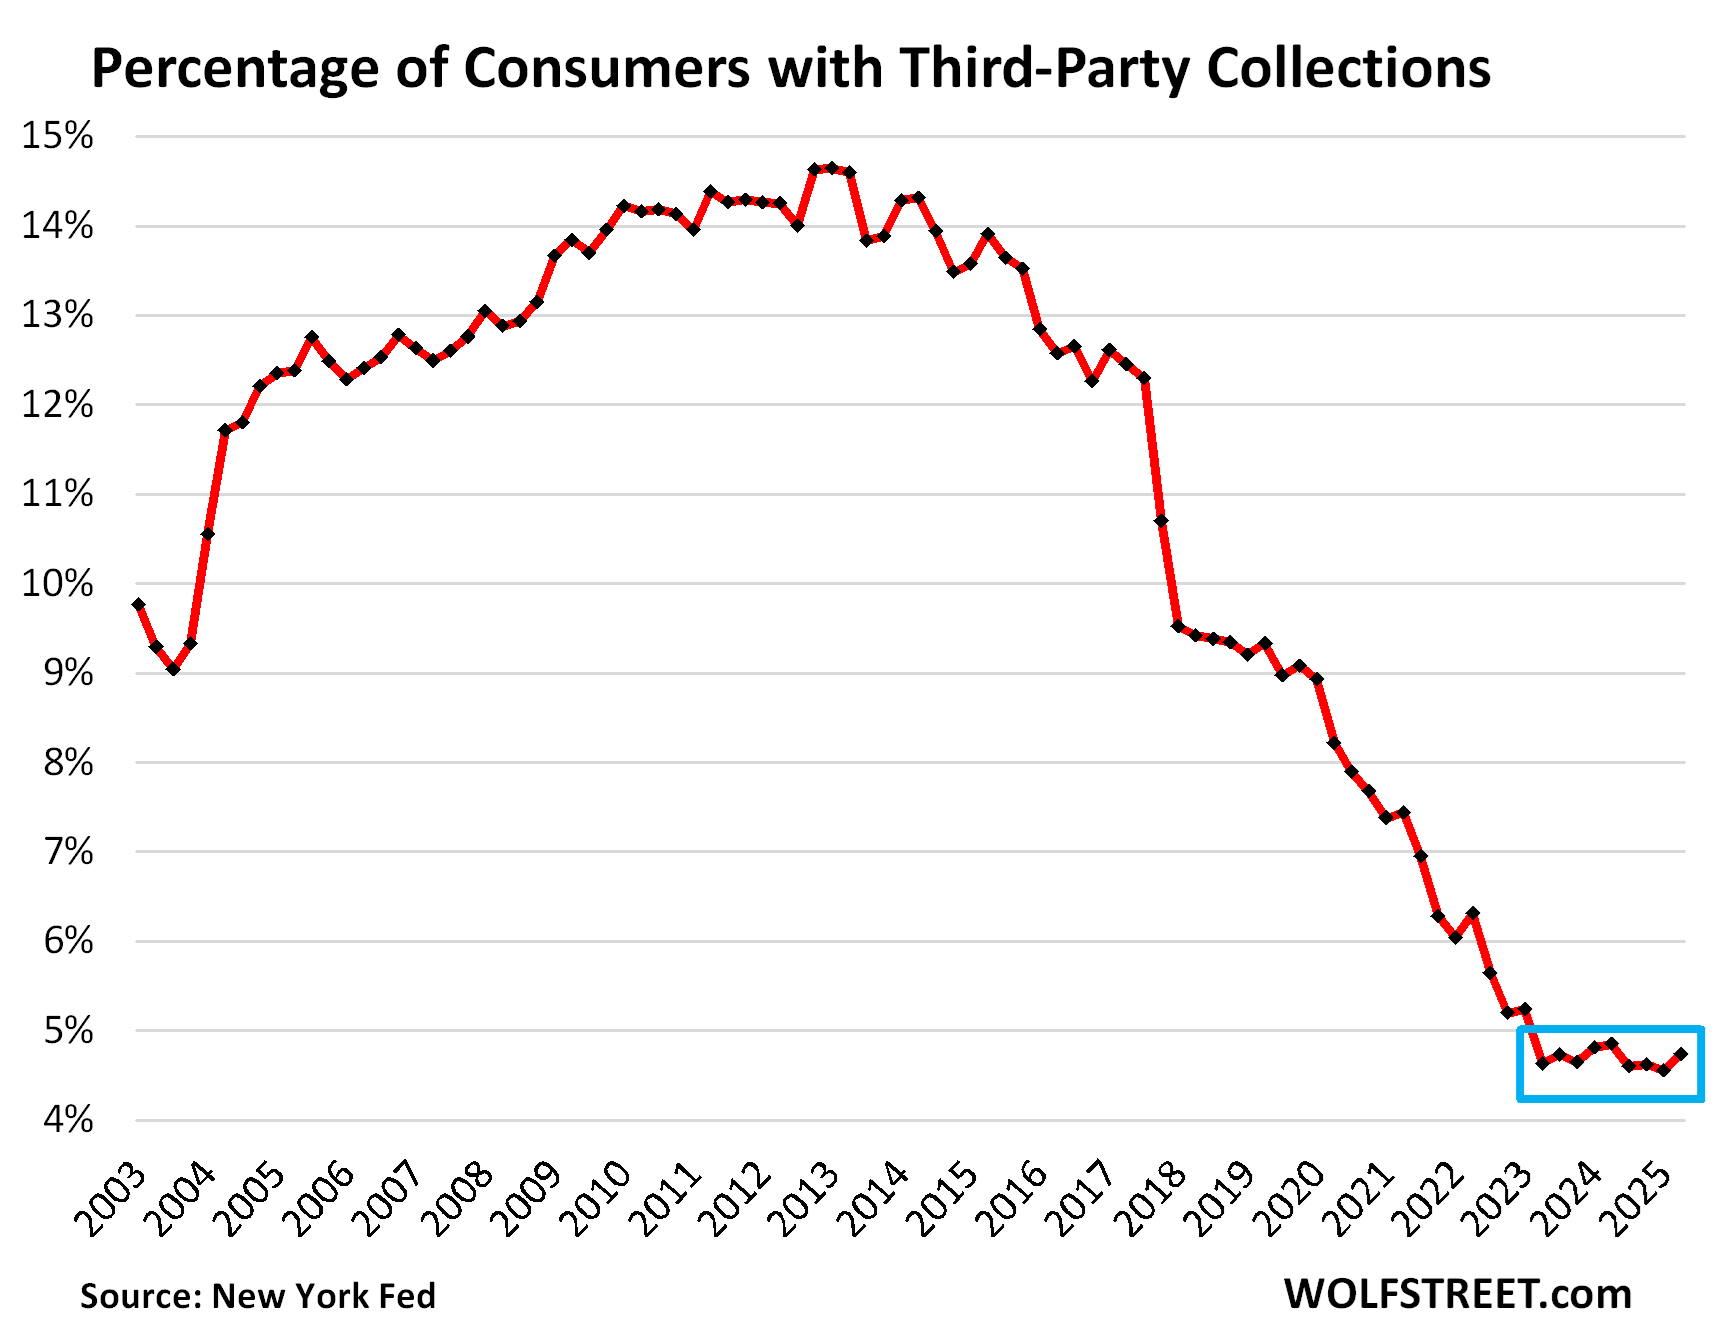
Third-party collections.
The percentage of consumers with third-party collections – where defaulted credit card & other balances can end up – rose to 4.7%, from the all-time record low in the prior quarter, after having declined from record low to record low during and after the Free Money era.
A third-party collection entry is made into a consumer’s credit history when the lender reports to the credit bureaus, such as Equifax, that it sold the delinquent loan, such as credit card debt, to a collection agency for cents on the dollar. The New York Fed obtained this data on third-party collections in anonymized form through its partnership with Equifax.
And in case you missed our reports on the other debts of Americans:
Serious Delinquency Rates for Subprime & Prime Auto Loans, their Balances, and their Burden: Our Drunken Sailors in Q2. Subprime is, as always, in trouble, which is why it’s subprime – high-risk-high-profit auto sales & lending that can entail steep losses.
Here Come the HELOCs: Mortgages, Housing-Debt-to-Income-Ratio, Serious Delinquencies, and Foreclosures in Q2 2025. Taxpayers and investors are mostly on the hook this time, not banks.
Household Debts, Debt-to-Income Ratio, Serious Delinquencies, Collections, Foreclosures, Bankruptcies: Our Drunken Sailors’ Debts in Q2 2025. The long-defaulted federal student loans come out of the shadows of government forbearance.
Enjoy reading WOLF STREET and want to support it? You can donate. I appreciate it immensely. Click on the mug to find out how:

![]()
Wolf, does any of this data also include Buy-now-pay-later?
Thanks!
Curious – I don’t think Wolf will let this one go through – but what most people don’t know is that when you have a credit card and buy something with it, the company is not loaning you money – they are loaning you credit, which is conjured up basically with a keyboard (out of thin air). But you do have to pay them back with real currency.
Amazingly, I have had a couple credit card offers sent to my home recently. The interest rates were crazy. 22 to 30% interest rates ‘depending on your credit worthiness’. How’s that for money from nothing?
Kyle,
You’re a patent-pending goofball. You don’t understand nada. What do you think the merchant gets when you pay by credit card? I tell you what they get: “cash” in their bank account. A credit card is just a money-transfer device, from you via some third parties to the merchant, with a delay built in. And how you want to pay for the charge is up to you, either cash out of your checking account when you pay off the statement balance, or convert it to an interest-bearing debt. But the merchant doesn’t care about that, and they don’t care if you default on your interest-bearing debt or not. They already got your cash in their account.
“I don’t think Wolf will let this one go through”
Nah, that patent-pending goofball stuff is just hilarious, so I let some of it through for entertainment purposes.
Where do you come up with such nonsense? Of course they are the means for YOU PAYING MONEY TO A VENDOR which means that they (credit card companies) are indeed LENDING YOU MONEY.
ctrl+f my guy
“Other” consumer loans (blue line), such as personal loans, Buy-Now-Pay-Later (BNPL) loans, and payday loans, dipped by $2 billion in Q2 to $540 billion, the second quarter-to-quarter decline in a row, and were down a hair from a year ago. Balances have barely risen over the past 22 years, despite the growth of the population, income, and spending over the period.
Apparently not curious enough to read the article in full
“Other” consumer loans (blue line), such as personal loans, Buy-Now-Pay-Later (BNPL) loans, and payday loans, dipped by $2 billion in Q2 to $540 billion, the second quarter-to-quarter decline in a row, and were down a hair from a year ago. Balances have barely risen over the past 22 years, despite the growth of the population, income, and spending over the period.
Curious,
Wolf is generous in his investment of time and knowledge, producing excellent fact-based analysis available for free. Now you want him to read it to you as well? I will never understand where he finds the patience.
Patience? Wolf?
Lol!!
💥🧨💣
WolfStreet.com on Audible, as read by Wolf.
Start your free subscription today.
In the past 8 to 10 years or so, almost all of our spending shifted from cash and check payment to credit card payment. All of it paid monthly before accumulation of interest charges. Sort of mirrors the migration of most purchasing shifting to on line. Even brick & mortar store purchases, mostly groceries, gas, and Home Depot type stuff are done with the CC. I guess we are part of that rise in the use of and credit card balances & spending.
What caused the large drop in 2017 in third party collections?
IDK the specifics on the specific time period (I’ll give a guess below though) but *you are asking the right sort of question* – why and how fast credit metrics can change.
The older part of the delinquency chart is the important part – because it shows just how fast these credit metrics can change (for good or ill – usually for ill).
In Housing Bust 1, things looked perfectly ideal delinquency/default wise immediately pre-bust.
1-2 years later the wheels have flown off and Geithner’s looks about ready to commit suicide on ntl TV.
My guess re 2017 is that since hiring was finally really ramping up past pre-bust levels (actually starting in 2016) people who had been barely getting by financially finally had the breathing room to pay off long over due debts.
See also Pandemic giveaways and similar decline – after years and years…financially stressed people had some cash to pay off long-accrued debts – so they did.
Thanks Wolf,
Any idea what that big drop was from 2017 to 2018 for third party collections?
I had the same question but posted it wrong…
End of 2017 tax cuts and jobs act.
National consumer assistance plan, and most of that was medical debt apparently
Excellent review, as always, thank you.
This sailor is currently on his third shift beer on main deck. Just don’t tell the captain or mate.
Thank You Wolf ! 🍻
Regarding collections, the note indicates values are reflective of debt being sold to collectors for Pennie’s on the dollar. But what about contingency accounts? Ex. My tenant left without paying and owes me $5K. I assign this to a collection agency for 40% contingency to go after them. Does that show up in collections or just the deeply discounted purchases?
This data is third-party collection entries on Equifax credit reports.
Wolf,
When does the BNPL defaults cause a problem ?
Right now people keep buying everything on BNPL without any concerns.
People have multiple BNPL accounts and have zero intention on paying the money back.
Why should they default? They have no reason to default. It’s convenient, and it’s free for customers (zero interest), and it’s very short-term. The merchants love it because it costs them less than the credit-card swipe fees. It’s a payment method that beats credit cards for both merchants and customers. It’s subsidized by the BNPL companies and their investors. The BNPL companies may never make any money, but that’s not my problem, it’s their investors’ problem.
BNPL has been around for many years now. What do you expect to change to cause a problem tomorrow that is not a problem today?
Why would BNPL be afflicted when other unsecured credit is not?
A wise man once said, “I’ll gladly pay you tomorrow for a hamburger today.”
Often mocked before beef credit became a hedge against inflation.
I’ve enjoyed sharing Wolf’s articles the past couple years when people tell me the majority of US consumers are living in dire straits and so many people are living on their credit cards and eating cat food for dinner using their credit cards. They stop talking nonsense pretty quickly.
Does disposable income include money taken out via a loan? If so, could this throw off the data?
1. NO good grief since when is a loan income???