Drunken Sailors going about their lives, spending money, moving the economy forward.
By Wolf Richter for WOLF STREET.
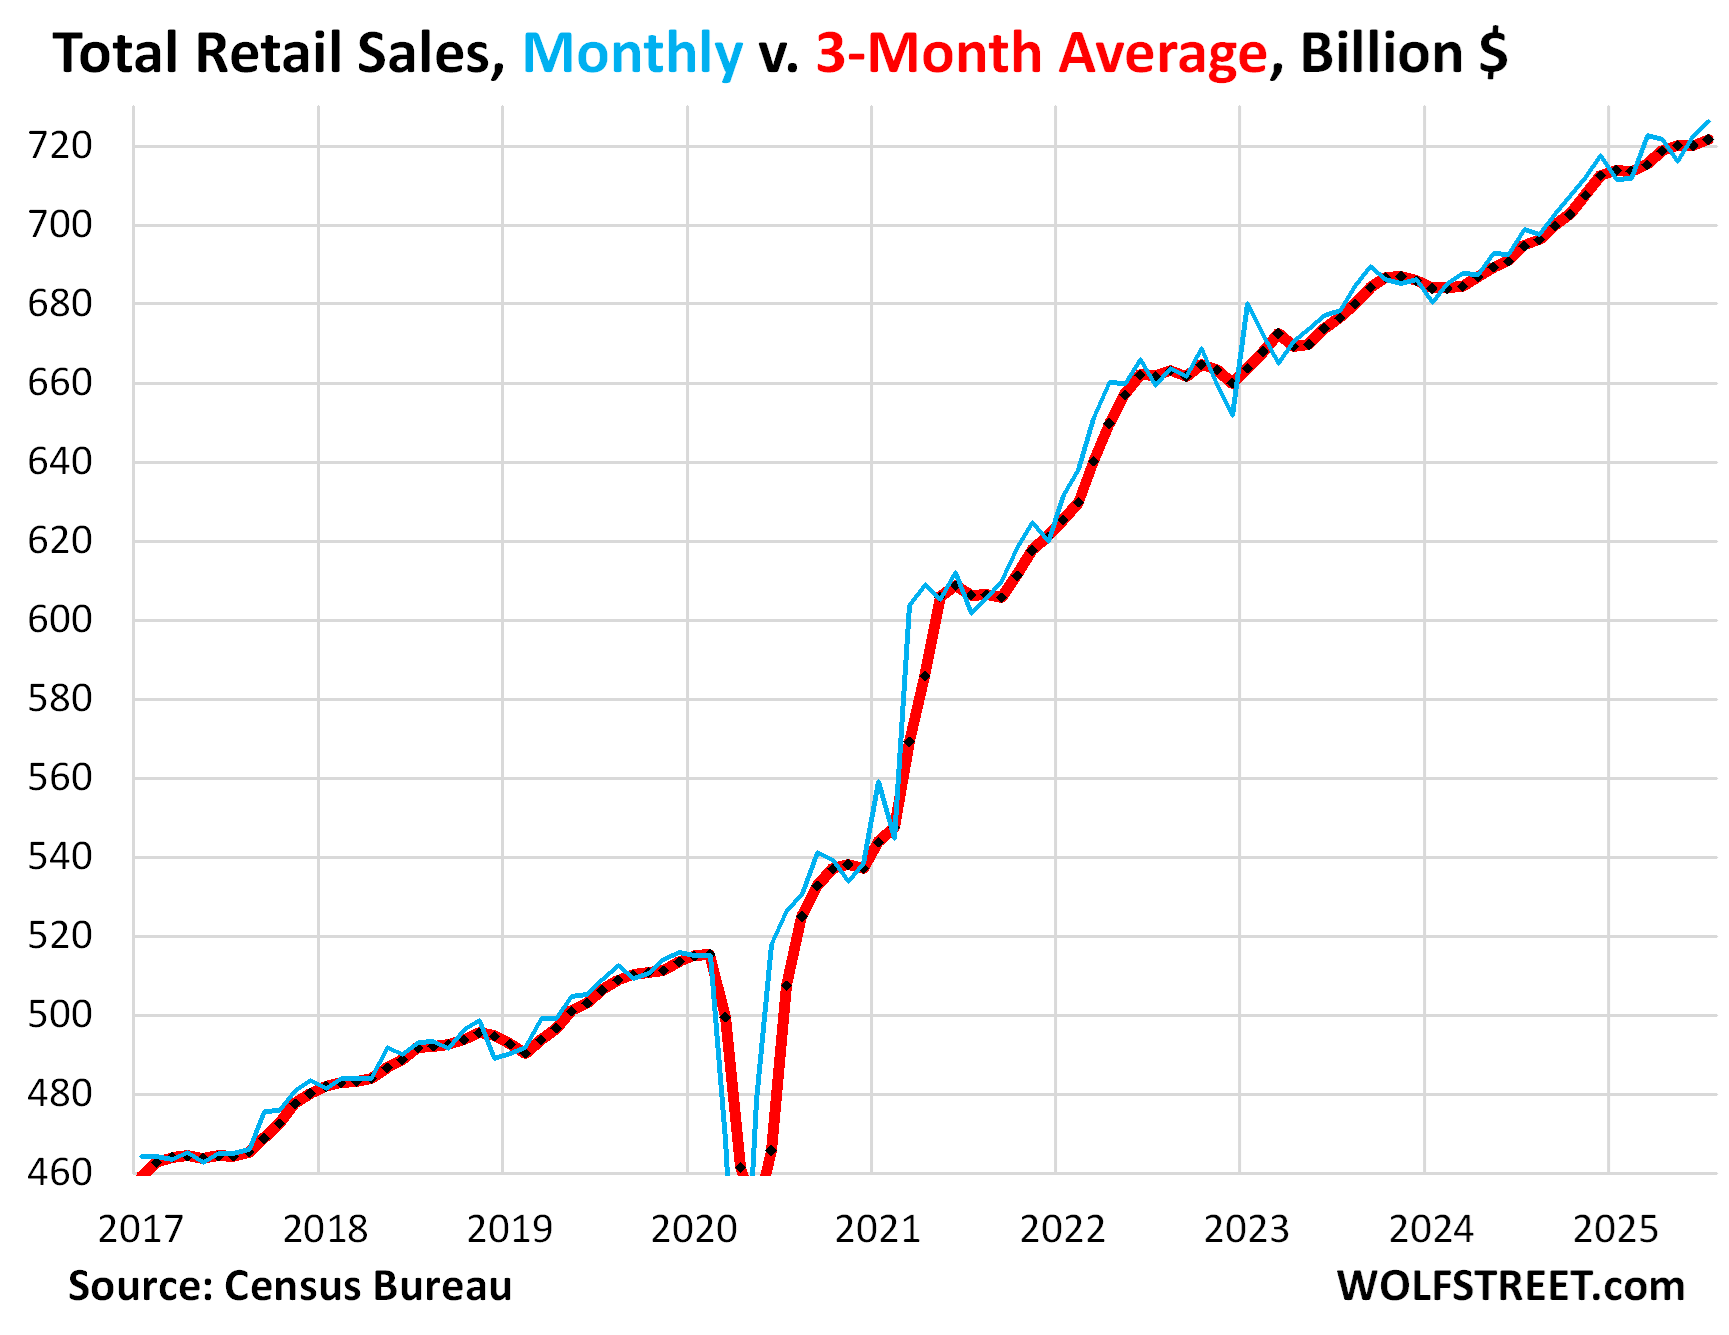
Retail sales rose 0.5% in July from June, and June’s growth was revised up to 0.9%, seasonally adjusted. That’s solid growth.
But retail sales have gone through some gyrations so far this year, month-to-month: In January, they plunged from December, in February they were up just a hair, in March they spiked, in April they dipped, in May they plunged, in June they spiked (as revised higher today), and in July, they increased solidly.
These gyrations this year were caused by massive sales at auto dealers in March, due to tariff front-running and a strong tax-refund season (down payments). Auto dealers are the largest category of retailers (19% of total retail sales), and they move the needle. Then, auto sales backed off from that spike, which caused month-to-month retail sales to sag in April and May. And in June and July, consumers reverted to the solid-growth trend.
Year-over-year, retail sales in July rose 3.9% seasonally adjusted. And not seasonally adjusted, they rose 4.3% to $744 billion, according to the Census Bureau today.
The three-month average (red in the chart below) irons out those gyrations. For July, it includes the big drop in May, and still rose by 0.2%. Year-over-year it was up 3.9%. This is solid growth.
Inflation plays only a small role in retail sales because inflation in goods that retailers sell has been relatively subdued this year. Inflation is in services which dominate consumer spending, but services are not part of retail sales. Prices of some goods categories are down year-over-year, others are up.
The CPI for durable goods (motor vehicles, consumer electronics, furniture, appliances, sporting goods, etc.) rose 1.2% year-over-year. The CPI for nondurable goods (food, gasoline, apparel, shoes, household supplies, etc.) is up only 0.5% year-over-year (details and many charts here).
The three-month average shows the solid relatively steady growth. There is nothing wrong with US consumers. They’re just fine; employment is at a record, they’re making more in wages and salaries than ever before; unemployment is historically low, layoffs are low, asset markets are soaring, and the $4.6 trillion that households have in money market funds are still earning around 4% in interest. So there isn’t really anything surprising about consumers continuing to spend money at a solid pace at retailers.
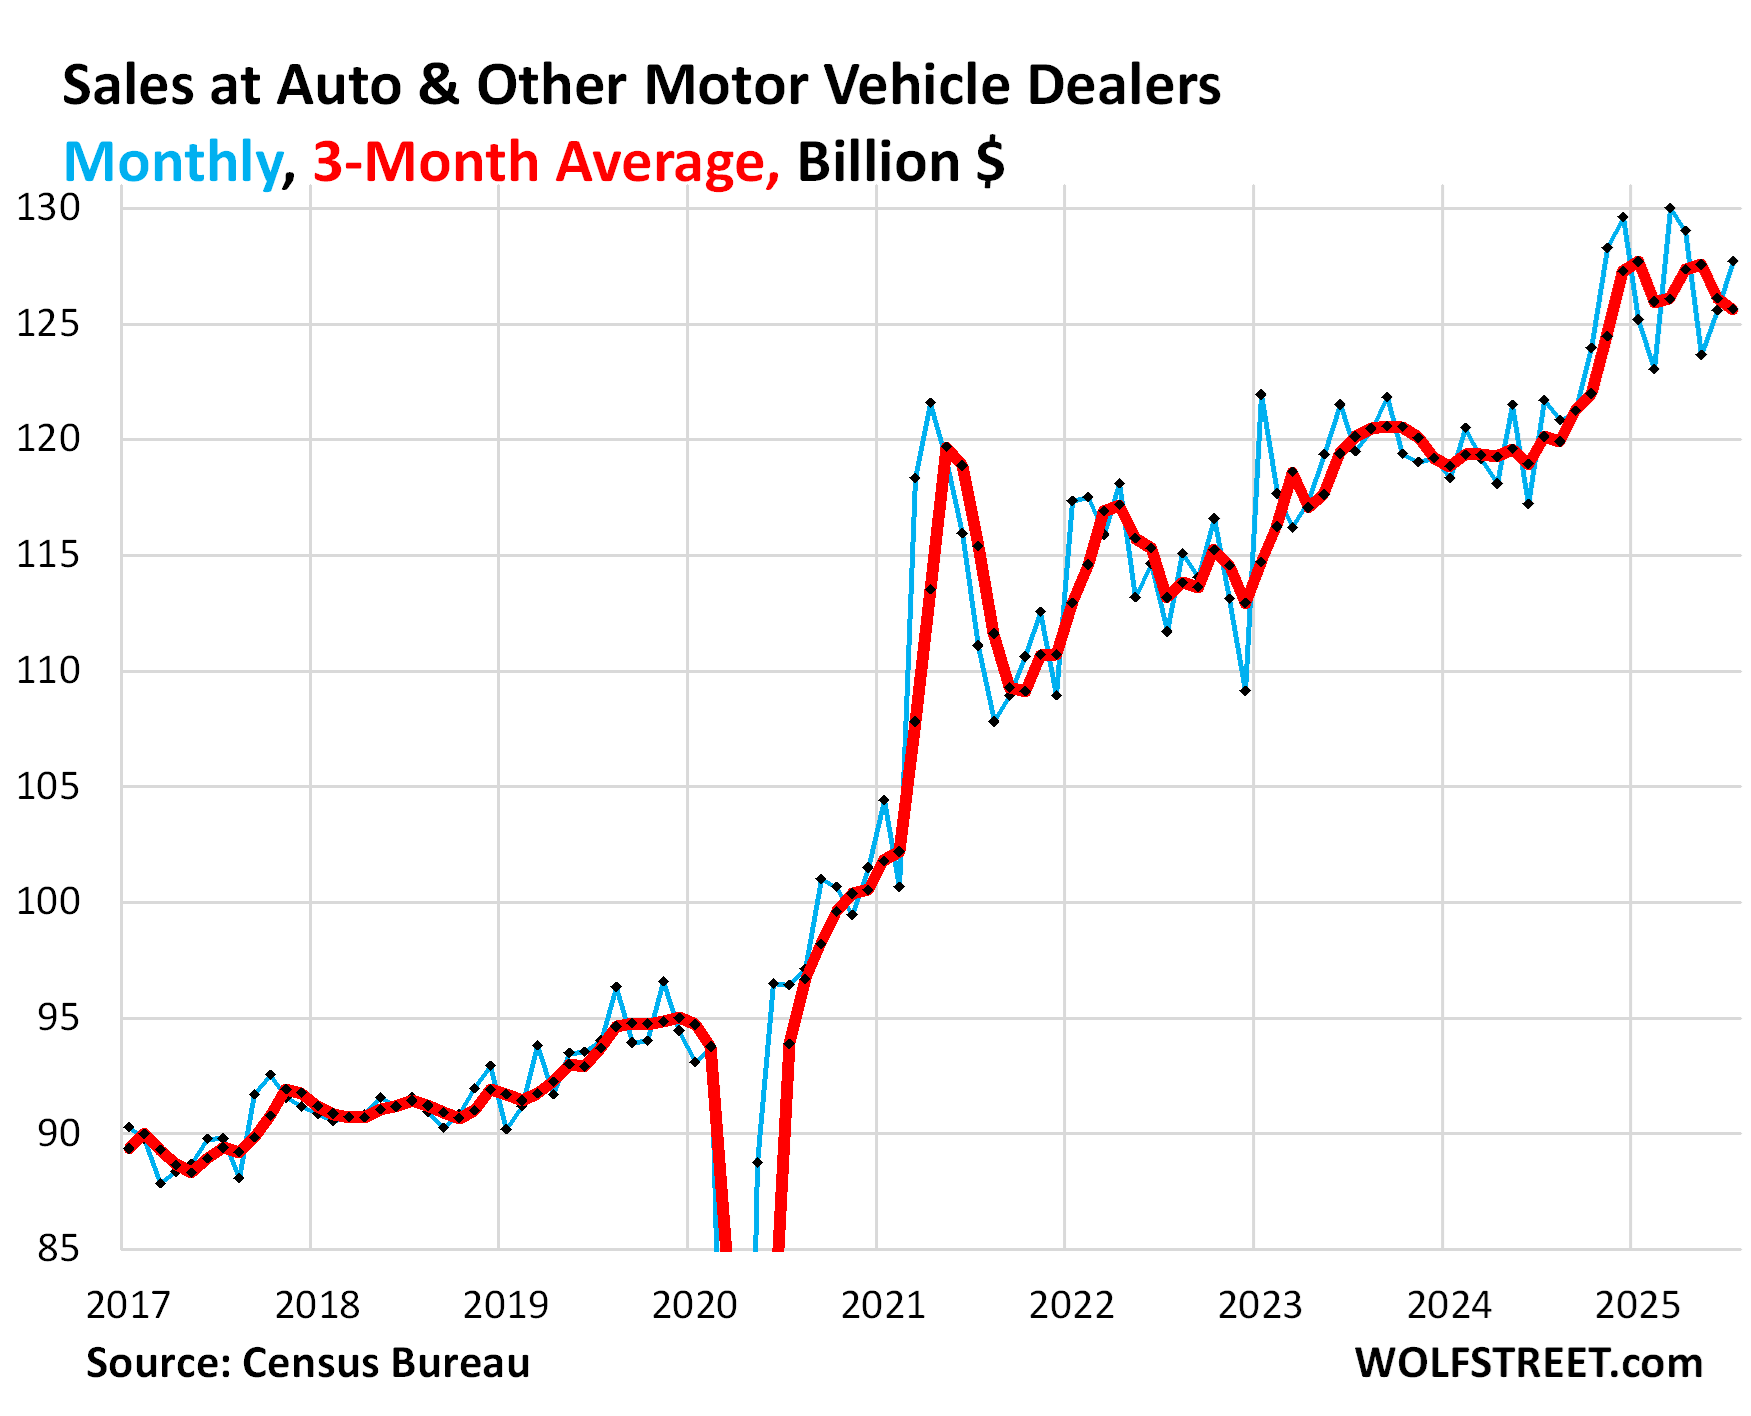
Sales at auto & other motor vehicle dealers – new & used vehicles, RVs, motorcycles, ATVs, snowmobiles, etc. – jumped 1.7% in July from June to $128 billion, seasonally adjusted, and were up 4.9% year-over-year. Note the gyrations of the month-to-month sales this year (blue line in the chart below).
This does not include parts dealers. With sales at parts dealers included ($11 billion), sales at Motor Vehicle and Parts Dealers rose 1.6% for the month and 4.7% year-over-year, to $139 billion, accounting for 19% of total retail sales.
The three-month average (red) irons out only part of those gyrations:
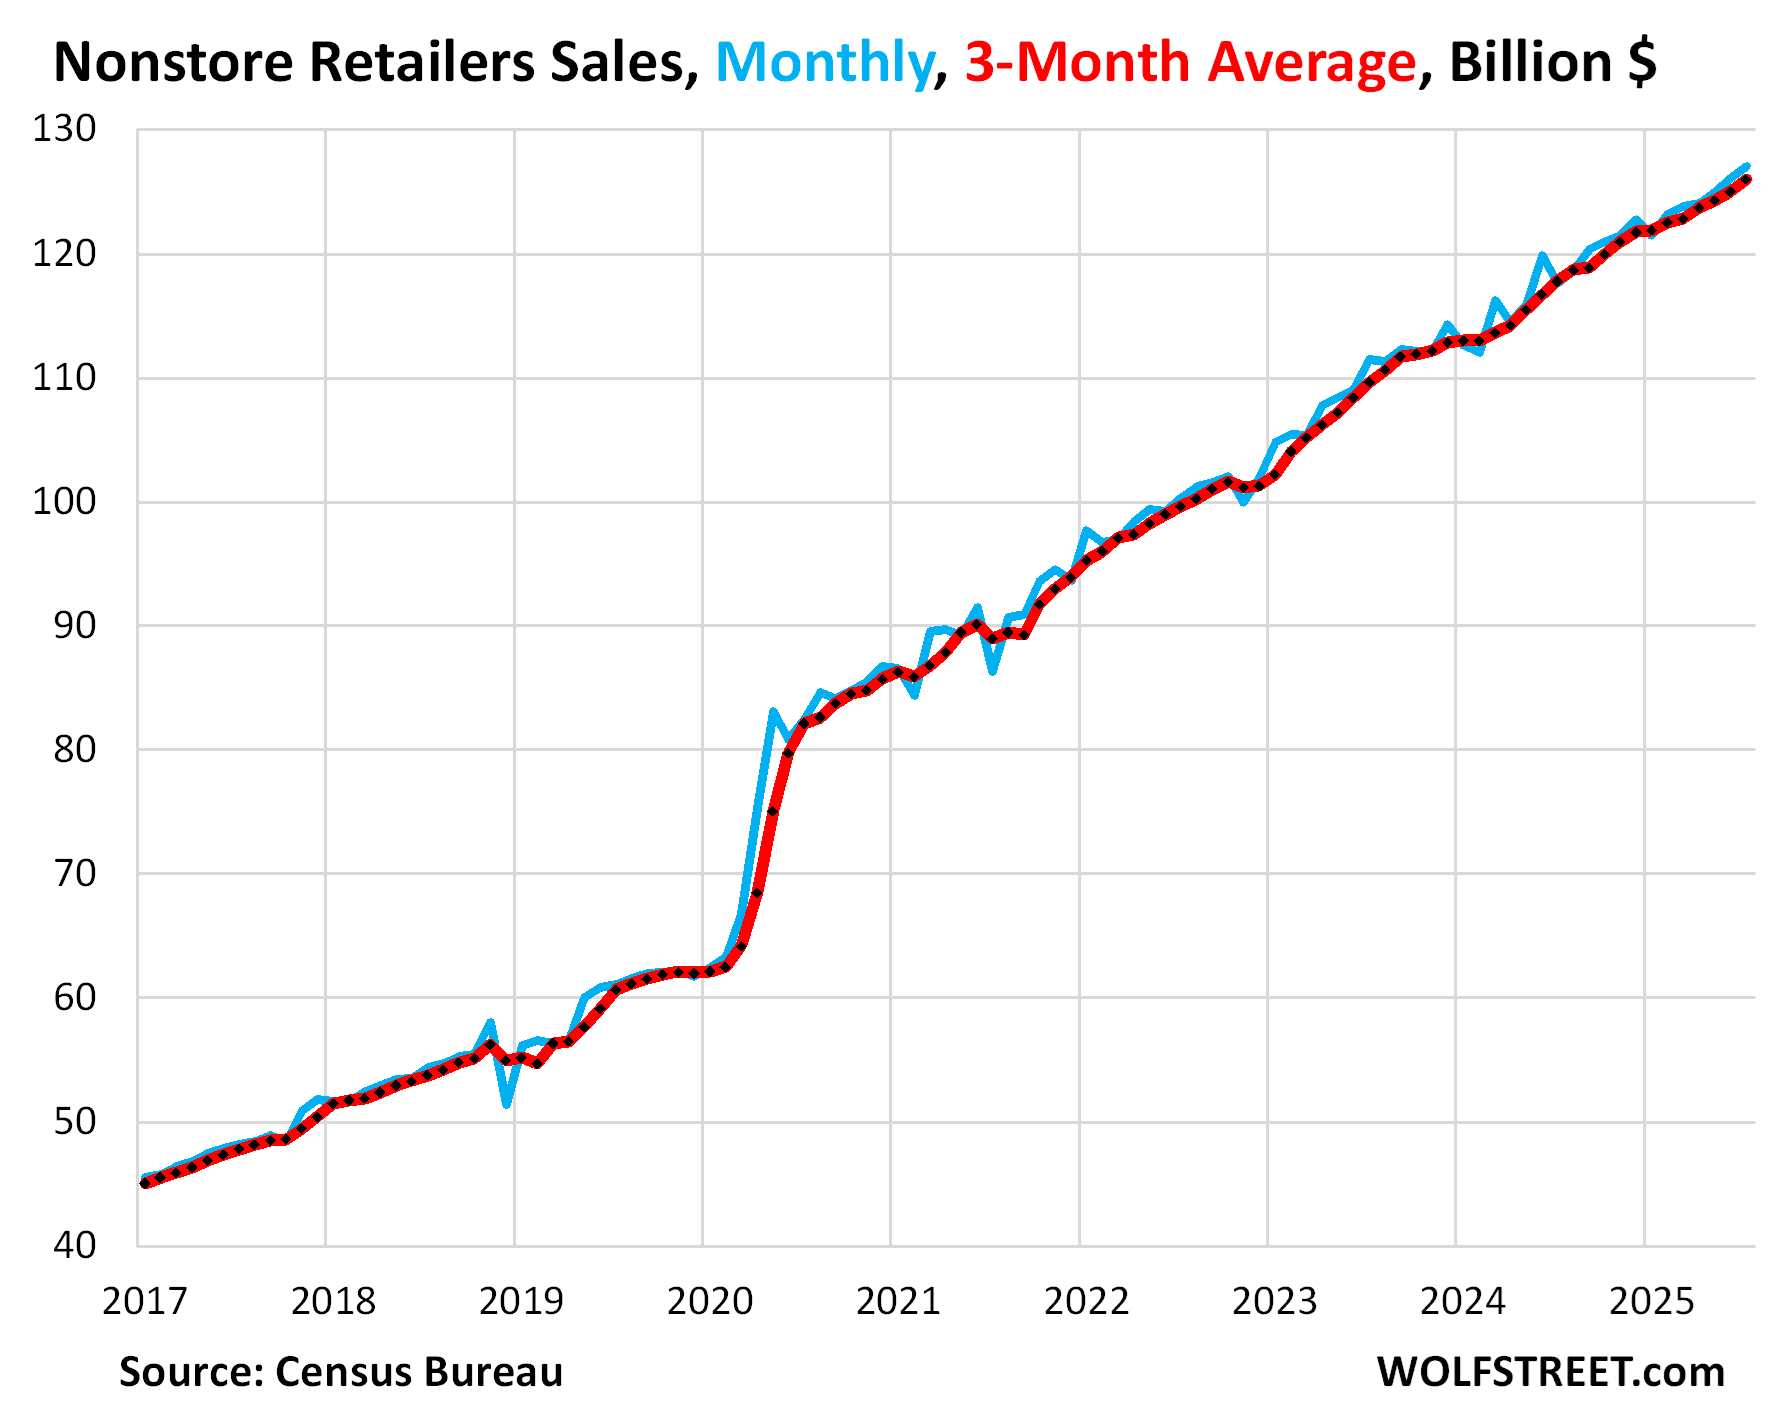
Ecommerce (#2 retailer category, 17% of total retail) has been growing at a strong pace and continued to do so in July, up by 0.8% from June, seasonally adjusted, and up by 8.0% year-over-year, to $127 billion.
Three-month average sales: +0.8% month-to-month and +7.0% year-over-year.
No sign of consumer weakness here, just growing at a relentlessly strong pace, as more and more of the retail trade shifts to ecommerce from brick-and-mortar stores:
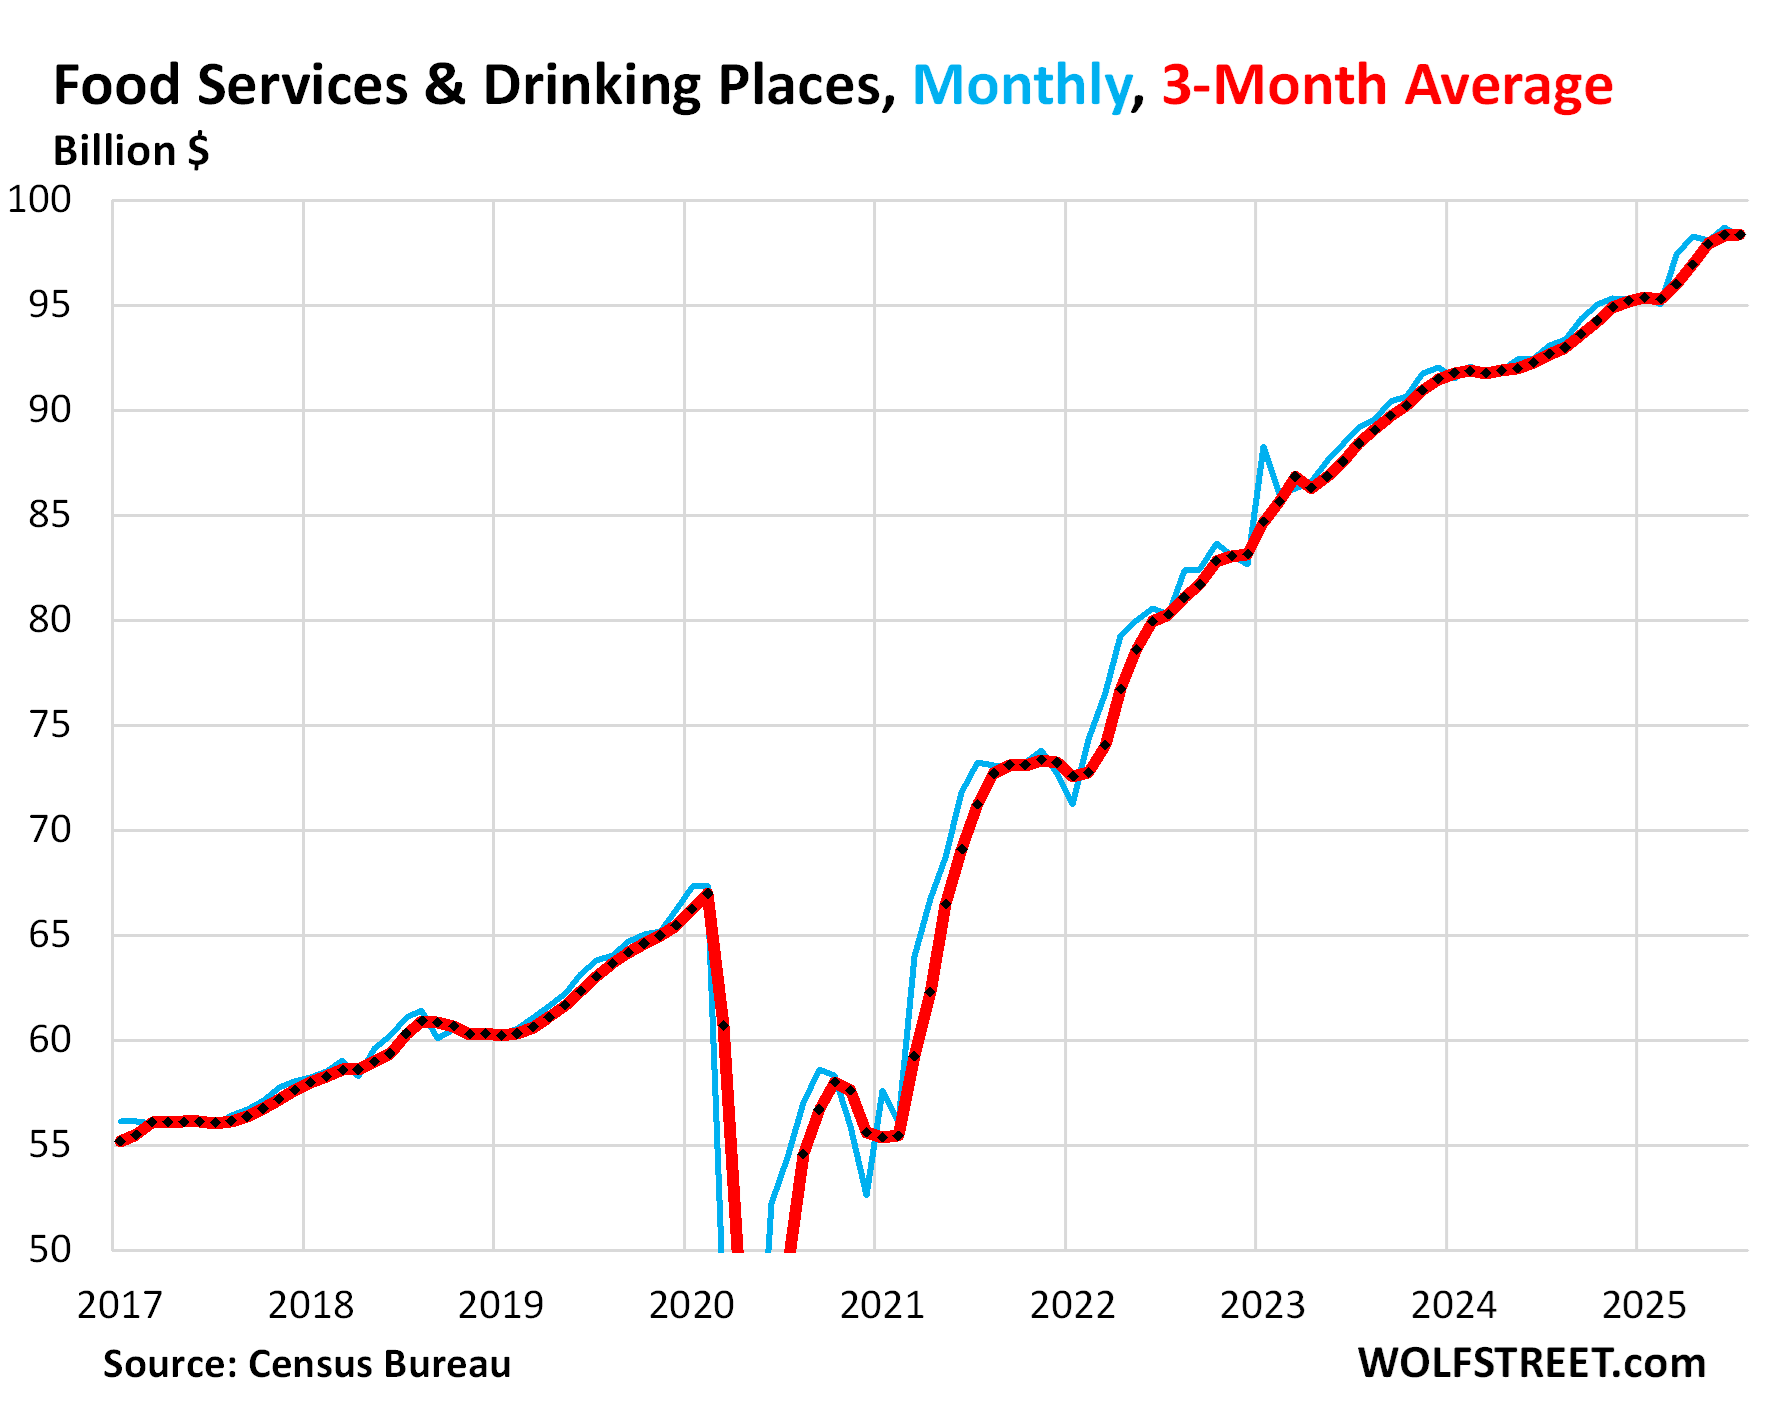
In restaurants and bars (#3 category, 13% of total retail), sales dipped by 0.4% month-to-month, from the record in the prior month, to $98 billion, and were up 6.6% year-over-year.
Three-month average sales: +0.01% month-to-month and +6.1% year-over-year.
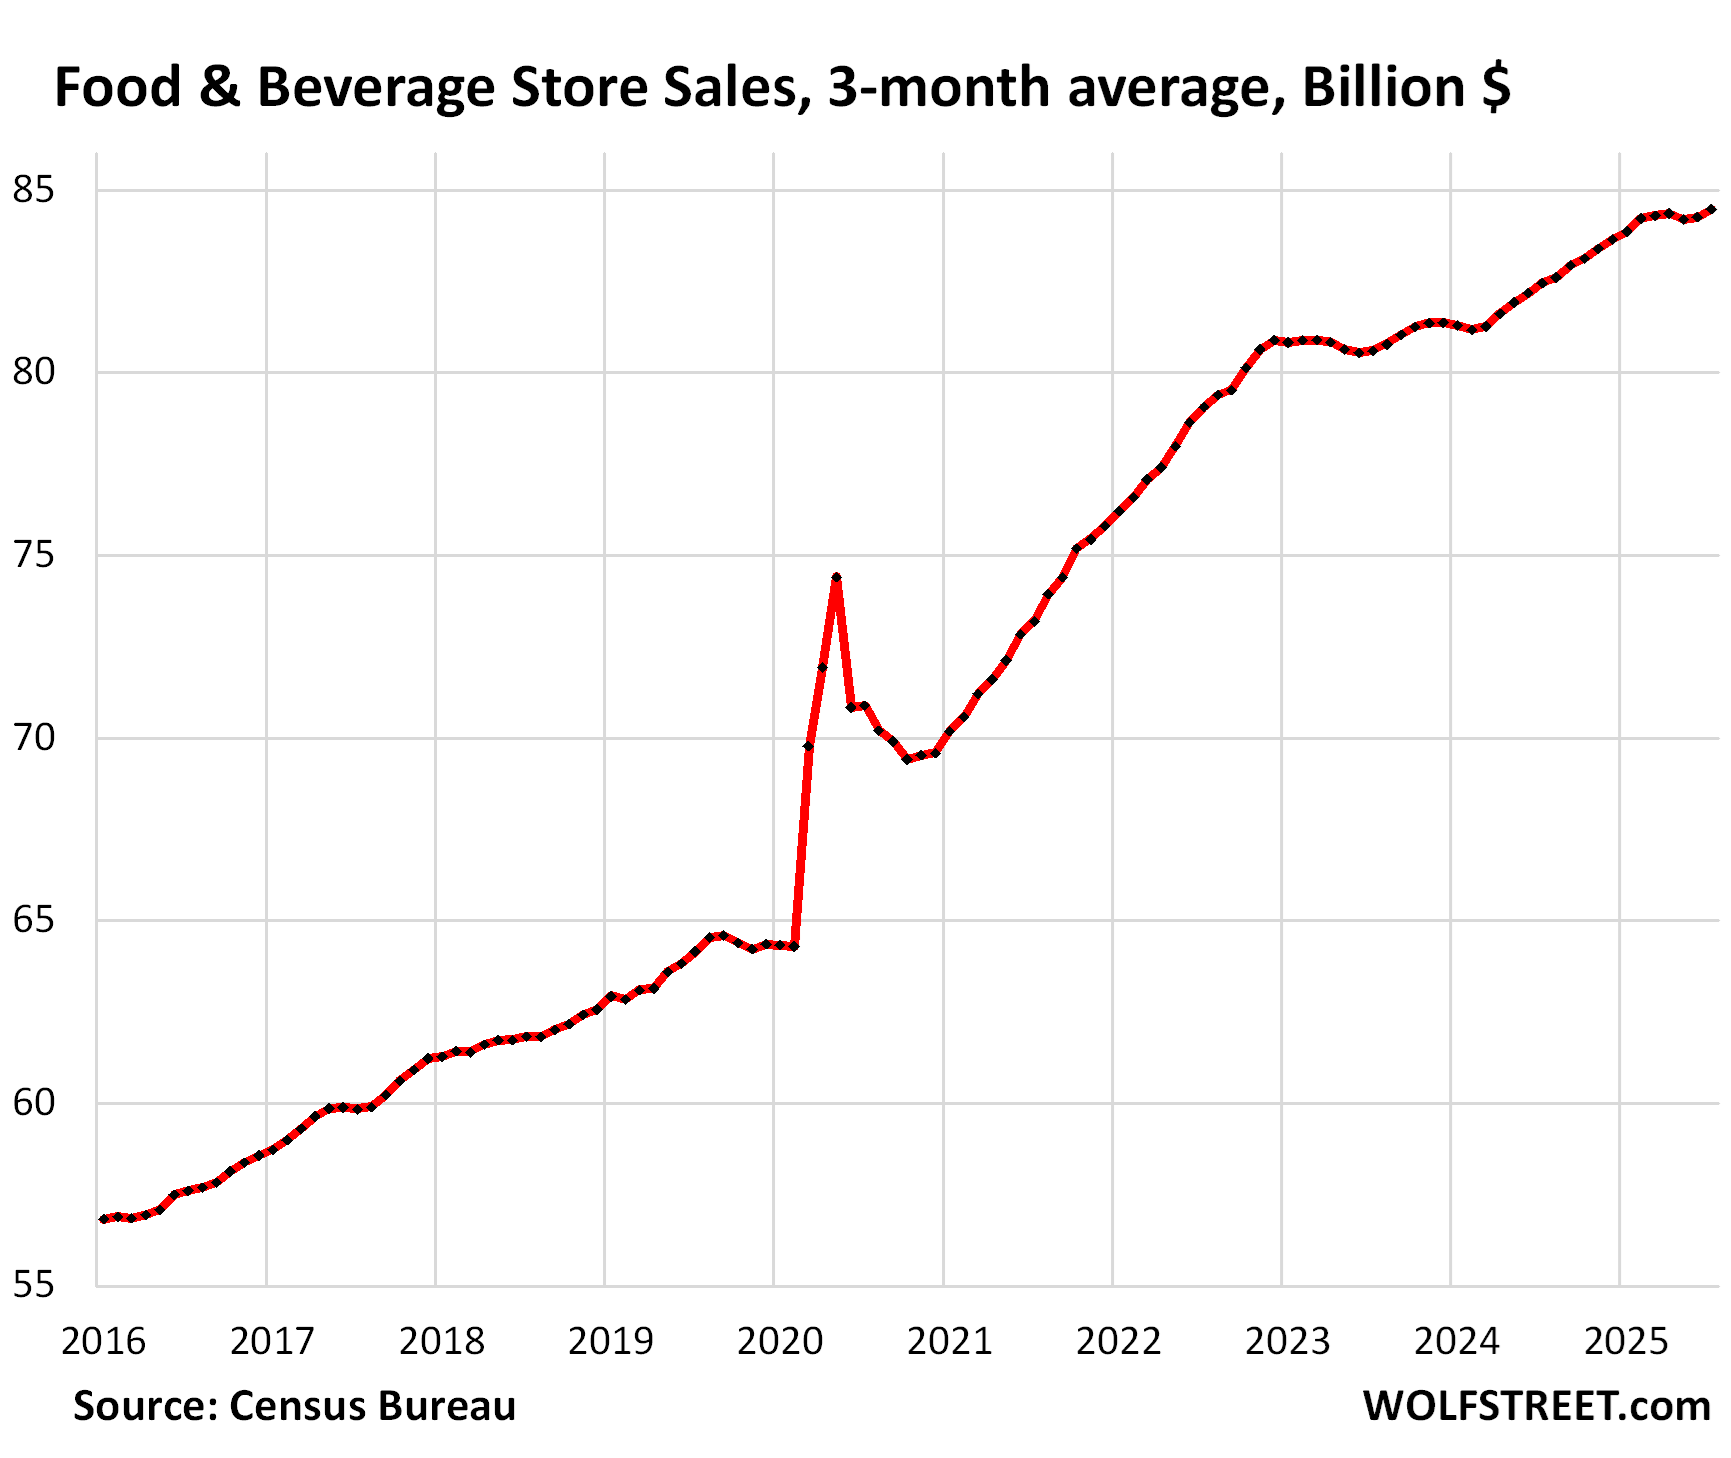
At food and beverage stores (#4 category, 12% of total retail), sales rose by 0.5% month-to-month to $85 billion, and by 2.5% year-over-year.
The three-month average sales: +0.3% month-to-month and +2.4% year-over-year.
More and more grocery sales have wandered off from grocery stores in this category to general merchandise stores, such as Walmart and Costco (see “general merchandise stores” below) and to ecommerce (see “nonstore retailers” above).
Food purchases have also wandered off to restaurants, a trend that has been playing out for decades as our Drunken Sailors, as we’ve come to call them lovingly and facetiously, have turned eating into an outside-the-home event (see “restaurants and bars” above).
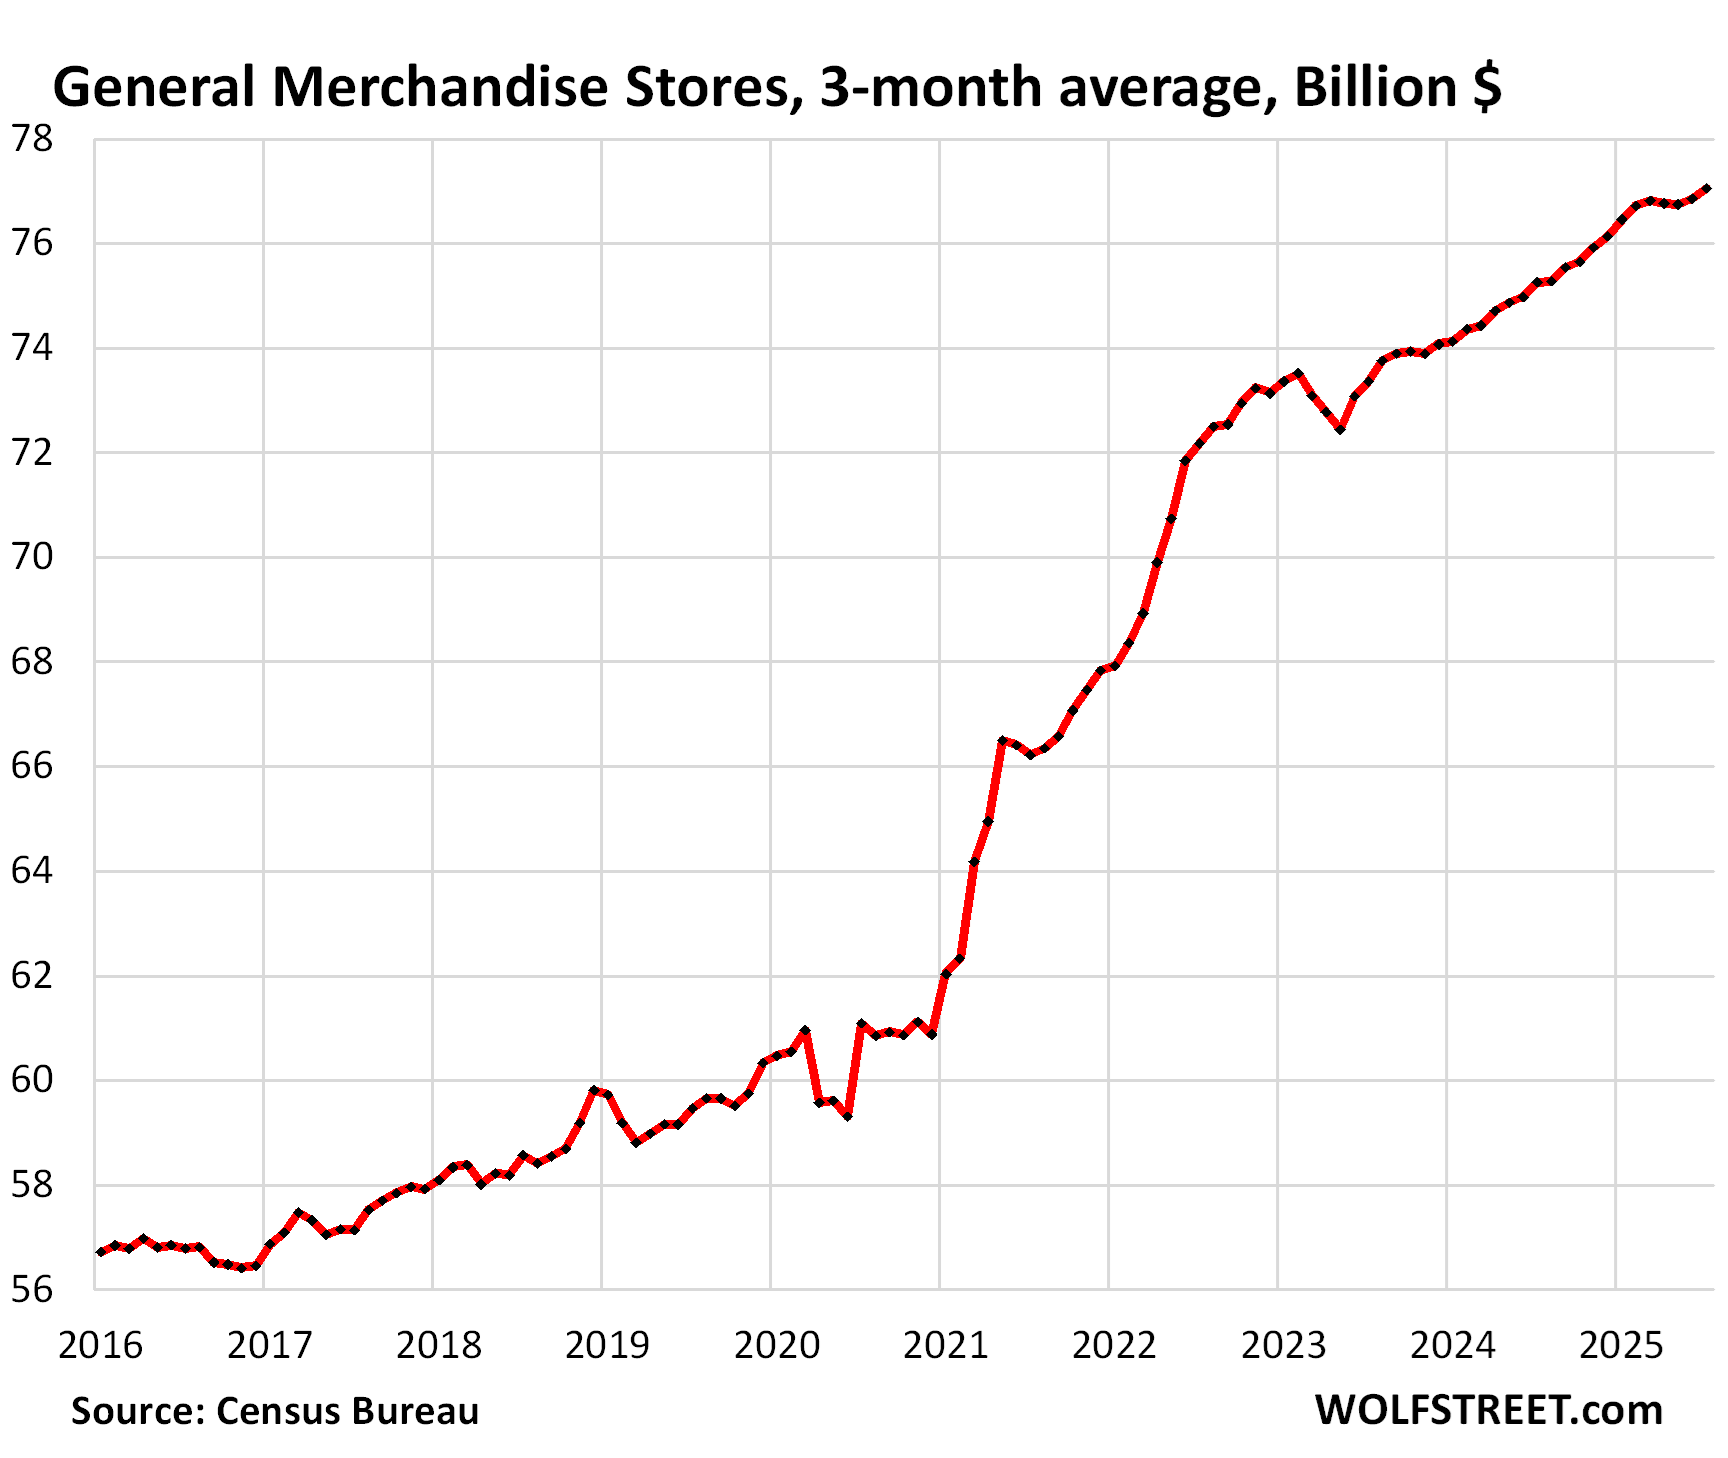
At general merchandise stores (#5 category, 11% of total retail), sales rose by 0.4% month-to-month to $77 billion, and by 2.3% year-over-year.
Three-month average sales: +0.3% month-to-month and +2.4% year-over-year.
Walmart is the largest grocer in the US, and its grocery sales are included here. But its huge ecommerce operations are included in “nonstore sales” above:
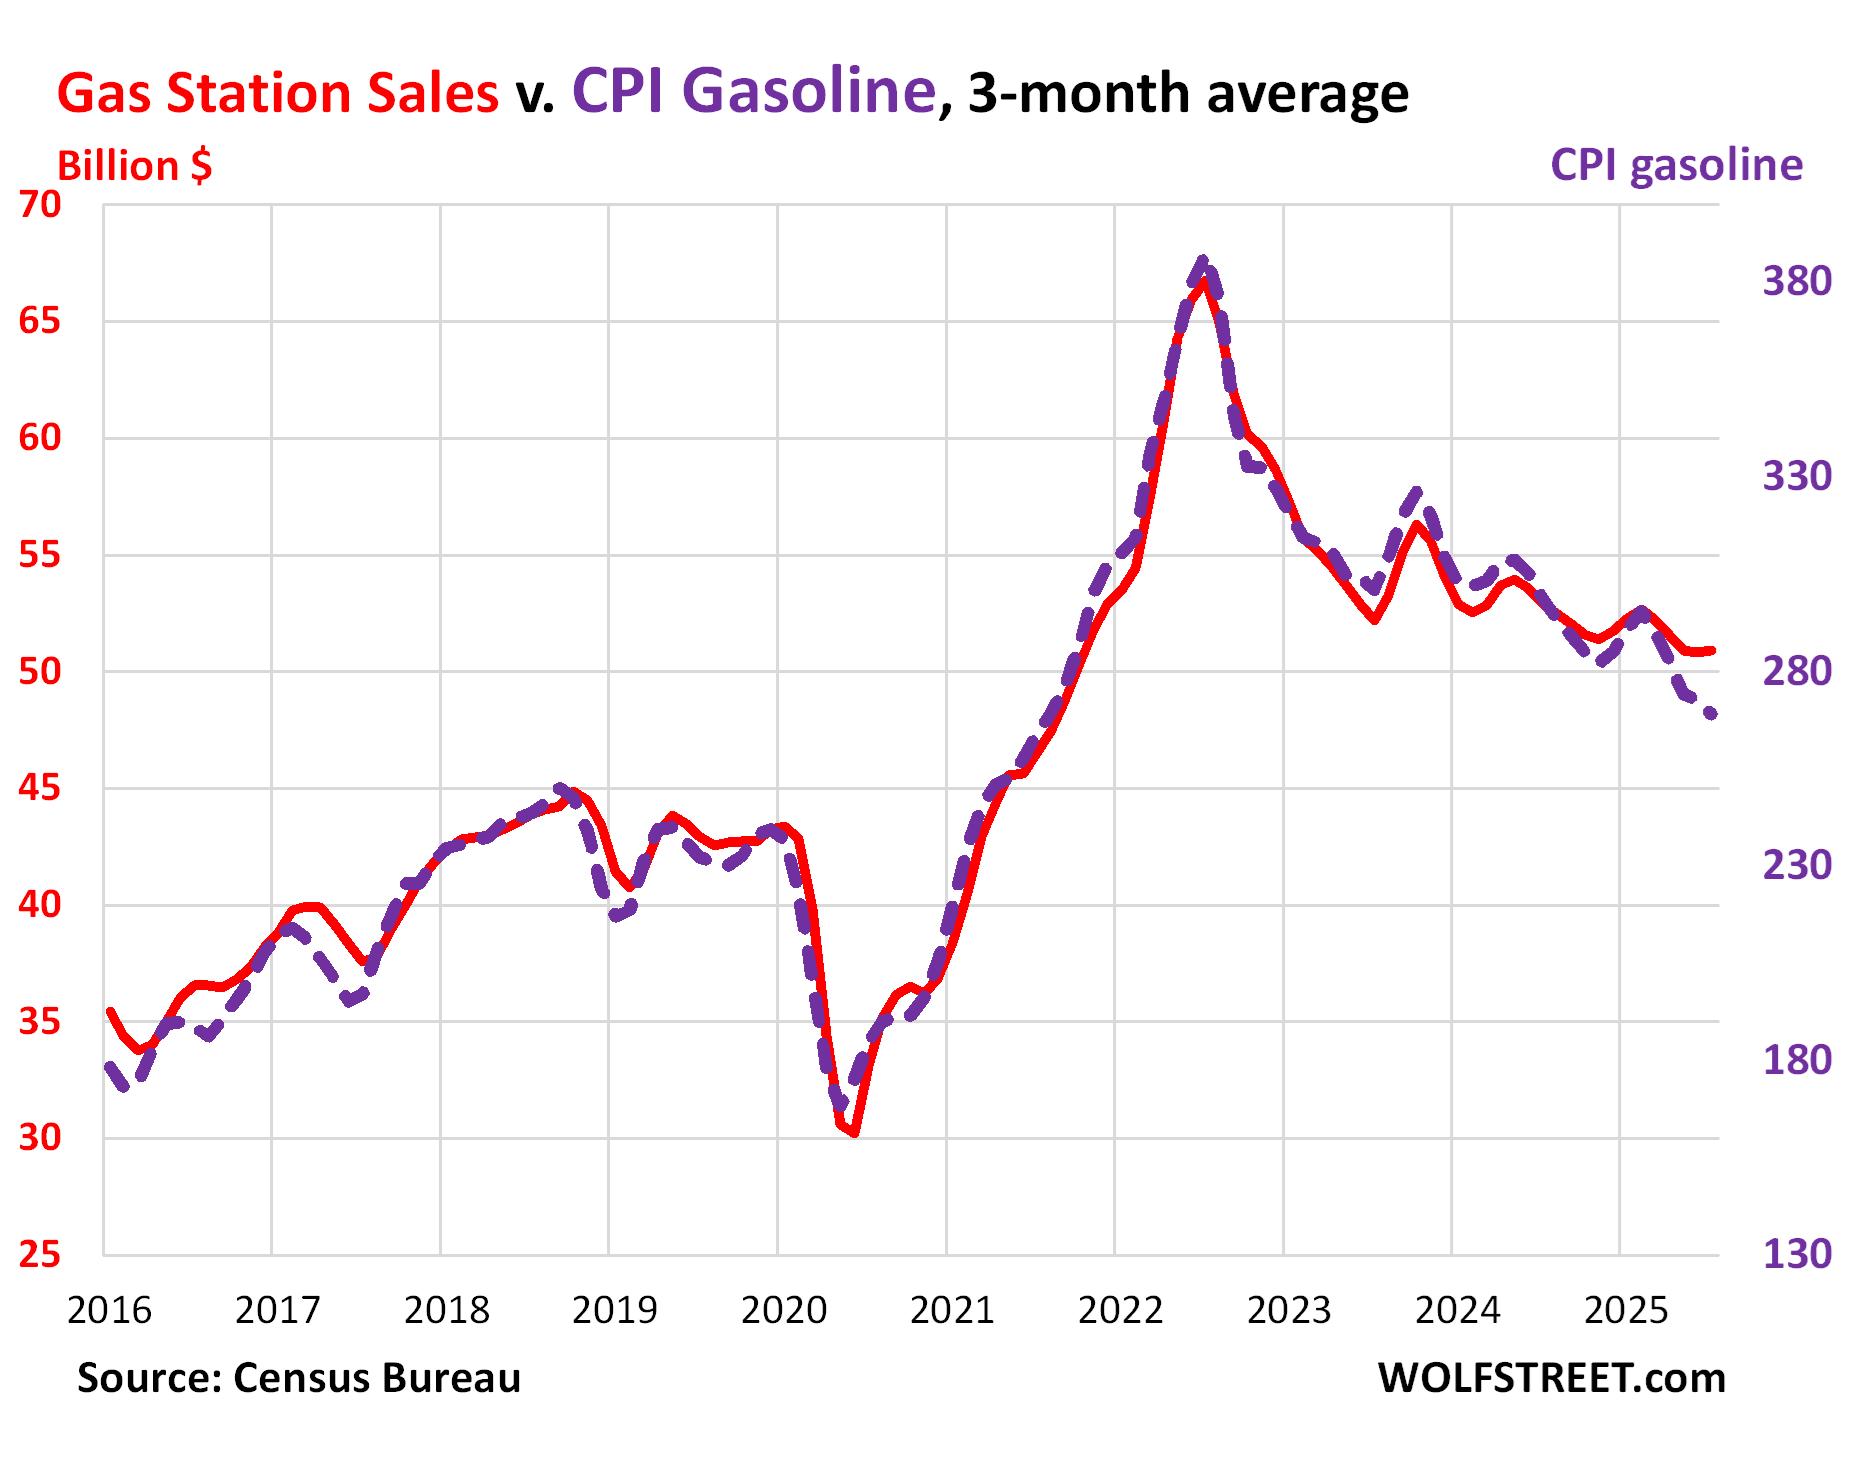
At gas stations (#6 category, 7% of total retail), sales move in near-lockstep with the price of gasoline. The price of gasoline started plunging in mid-2022 and then continued to zigzag lower. And gasoline sales in dollar terms have followed the price down.
The three-month CPI for gasoline plunged by 1.2% in July and by 9.9% year-over-year (dotted purple).
Three-month average sale: +0.2% month-to-month and +3.9% year-over-year, to $51 billion (red).
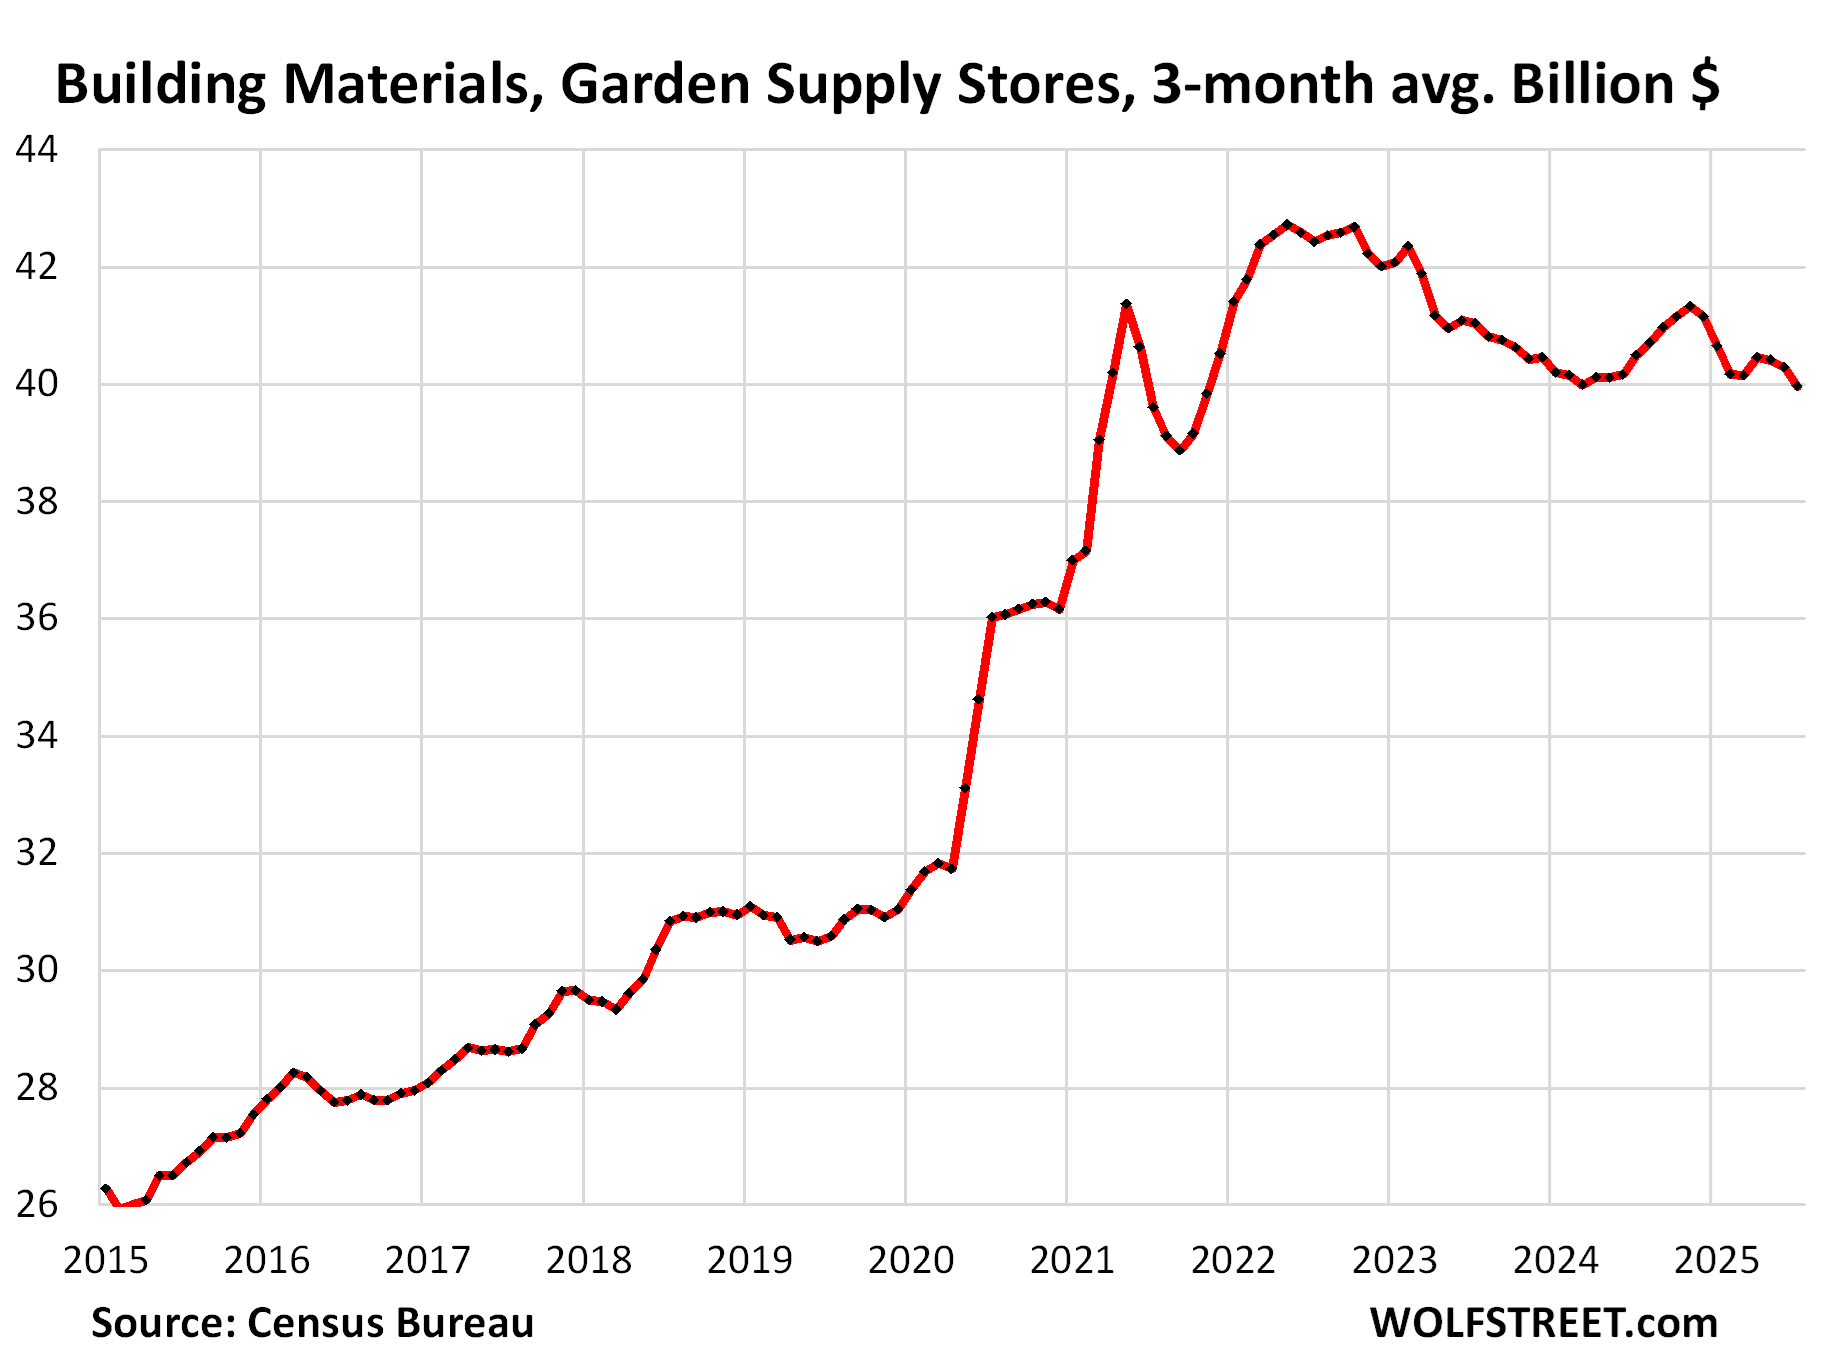
At building materials, garden supply and equipment stores (#7 category, 6% of total retail), three-month average sales: -0.8% month-to-month and -1.3% year-over-year to $40 billion.
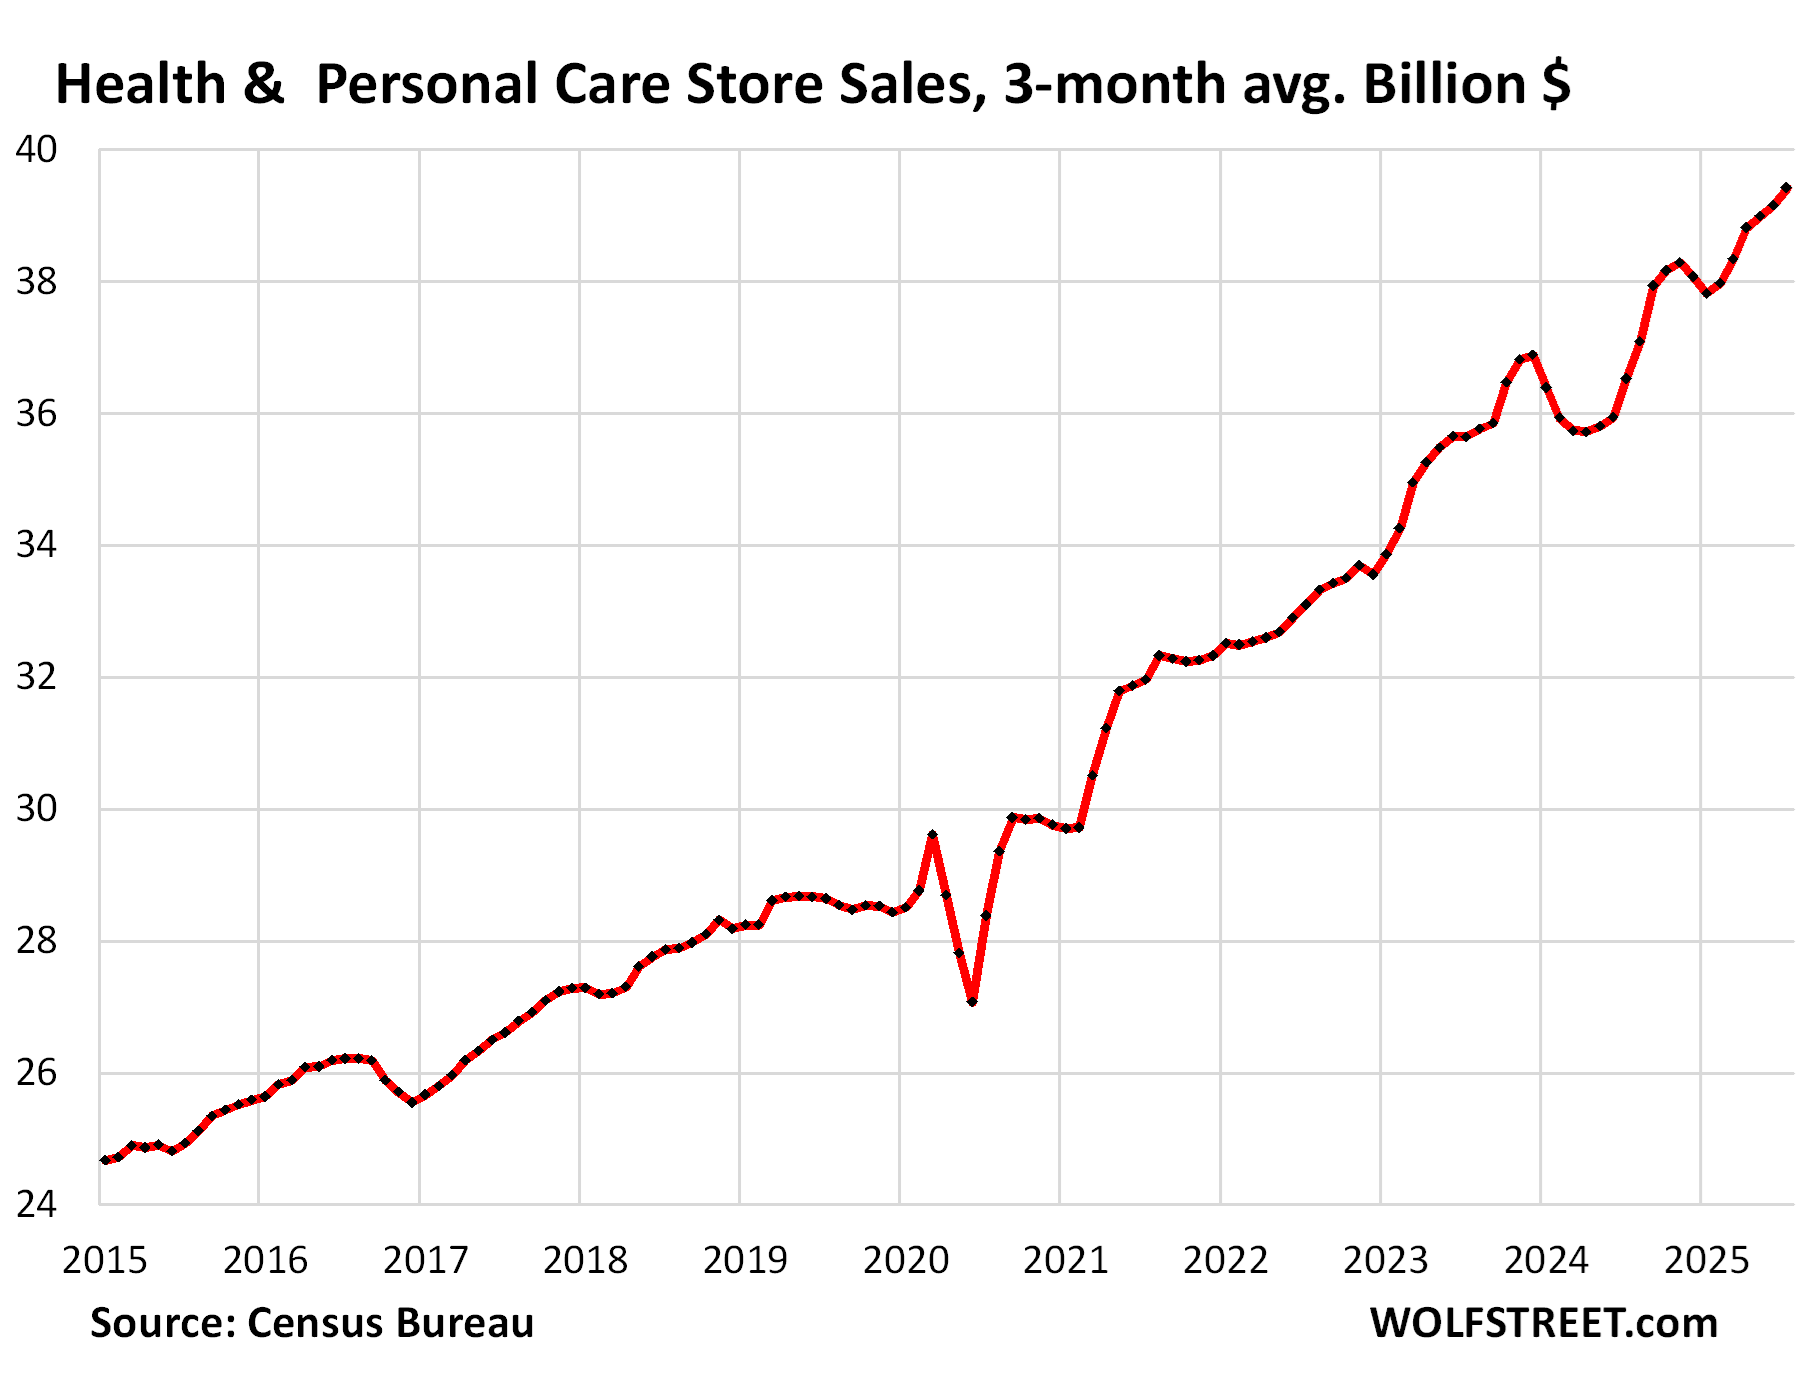
At health and personal care stores (#8 category, 5% of total retail), three-month average sales: +0.7% month-to-month, and +7.9% year-over-year to $39 billion.
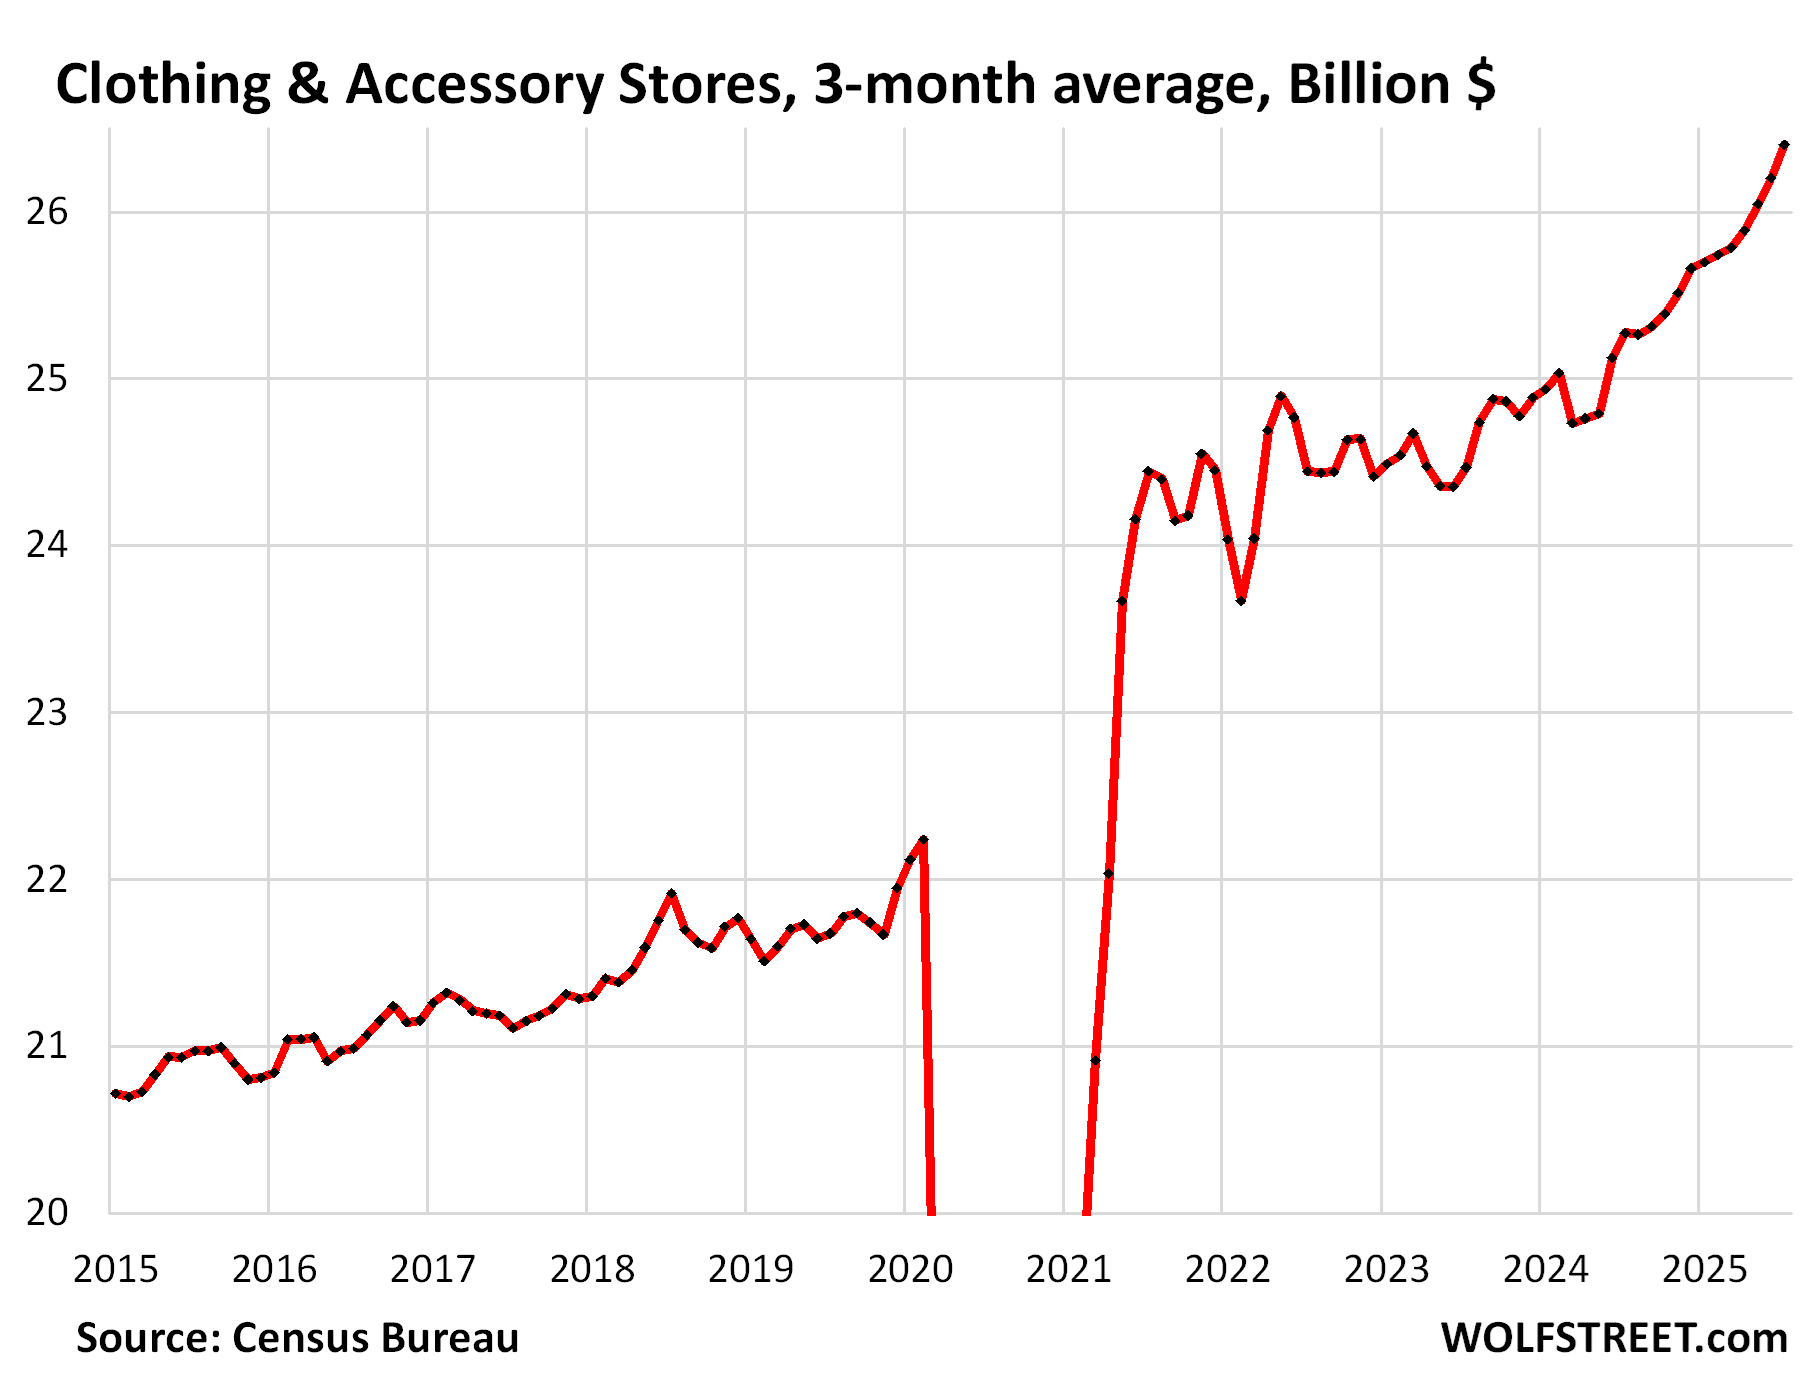
At clothing and accessory stores (#9 category, 4% of total retail), three-month average sales: +0.8% month-to-month and +4.5% year-over-year, to $26 billion.
Our Drunken Sailors are out there spending, even if they’re in a sour mood. And why shouldn’t they? Employment is high, wages are rising, and their credit is in good shape except for student loans that suddenly count again as delinquent. They’re sitting on trillions of dollars in interest-earning cash, and asset prices have soared, and unless something big changes, they’re going about their lives and moving the economy forward.
Enjoy reading WOLF STREET and want to support it? You can donate. I appreciate it immensely. Click on the mug to find out how:

![]()
Modern day financial Sodom and Gomorrah,
If it pumps the dopamines….Charge it…..Worry about the financial damage later.
Have a fantastic weekend ! 🍻
It’s not quite that bad.
Sure, I do think there should be much stricter consumer lending standards, ones strict enough that a good proportion of people wouldn’t be able to borrow at all.
But the US consumer, as a whole, is in much better shape than it was in the 2000s. Wolf has put graphs with this on this site.
You don’t read any other articles?
209er
🤣 consumers’ balance sheet are in great shape. I told you where the spending money is coming from: record employment with record salaries and wages. And consumers still save some. Soaring asset prices also help with big-ticket items, such as cars. Read the article.
Here is the household debt to income ratio:
https://wolfstreet.com/2025/08/05/household-debts-debt-to-income-ratio-serious-delinquencies-collections-foreclosures-bankruptcies-our-drunken-sailors-debts-in-q2-2025/
That chart just shows how nuts the great financial crisis was. Holy hell.
Yes, it was bad all around, which is why we got the GFC.
Now it’s the federal government with a high debt to income ratio.
Wait, huh? I don’t see any charts which show the 2008 GFC, I only see the ridiculously stupid money-printing COVID era.
Stop calling that a “crisis” because it wasn’t. A financial product was created that broke ~150 years of contract law (MBS), yet no one went to prison. That is FRAUD, not a “crisis”. MBS are still on the Fed’s balance sheet, Wolf has documented this and it’s complete bullshit. Those entities, including their management, should have been made to choke and die on their own creation, not be rewarded with primary dealer status (as Goldman Sachs was). There were plenty of mechanisms to protect the system from and deal with the distressed assets. Everyone involved in facilitating TARP and TALF should be executed for treason.
Securitization is perfectly legal and widespread, not just mortgages, but nearly all other debts can be and are securitized, including credit card balances, auto loans, commercial loans, all kinds of stuff. Securitization divides a loan into different slices where the lowest-rated slice with the highest yield takes the first loss (higher risk, higher potential return), and the highest rated slice takes the last loss, and usually no loss even when lower slices get wiped out. And so they have the lowest yields (low risk, low return). And investors can choose what risks they’re willing to take. If they take a lower-rated slice, they’ll get a higher yield, like investing in junk bonds.
The real issue with securitization is that it separates the lender from the long-term risks of the loan, which now investors carry. It’s good for banks, because they’re off the hook. But investors can lose their shirts.
During the Financial CRISIS, banks didn’t crater because of MBS. They cratered because they held actual mortgages that imploded because homeowners stopped making payments, and home prices (collateral values) had collapsed.
Bond funds imploded because they held MBS.
The MBS that are now on the Fed’s balance sheet have zero to do with the Financial Crisis. The Fed sold all those by 2018 and made a profit on them (they were in the Fed’s “Maiden Lane” accounts).
“Cause when life looks like easy street, there is danger at your door.”~ Uncle John band, Grateful Dead~Robert Hunter lyrics
D Diamond – a big driver of history’s wheel, esp. when a culture’s children are raised on fables ending in: “…and they lived happily EVER AFTER…”. (…was Cassandra in ‘The Iliad’ the first documented SWOT-analyst?).
may we all find a better day.
Speaking only for myself, I’ve achieved all of my 2025 investment goals already, so I think some retail therapy for “pumping the dopamines” is in order! Also making sure I have spare cash for my next donation to Wolf…
Have a great weekend, everyone!
Most credit card holders use credit cards as a monthly payment mechanism and pay off their balances in full every month.
Clark Howard (the consumer guy) recently stated that there are 2 types the credit card companies cater to.
1. The cash back crowd, these people work to get their cash back rebates from spending a ton on Everything! The best of these people hop cards left and right to maximize their bonuses. They never hold a balance and CC companies gain no interest from them. They do however gain fat transaction fees.
2. The people with their backs to the wall. They hold large balances of CC debt. Mostly they make their CC payments monthly. The CC companies have their knives out for these people and treat them rough, like the prisoners they are.
“You want a what?! A lower APR? get back in your hovel you scum!”
CC companies make a ton of interest off of these customers.
Credit card companies make the most off the people that use their credit cards for nearly all purchases to earn cash back or miles or whatever, and then pay them off every month, and never pay interest. Banks earn the swipe fees on close to $6 trillion a year that people run through their credit cards, nearly all of which gets paid off every month.
From Merchants Payments Coalition:
“High swipe fees, which have jumped 70% since the pandemic and hit a record $187.2 billion in 2024, contribute to enormous profits for the card industry. Profits are even higher at Visa, which had quarterly profits of 56% as of April, and Mastercard, which had 45% as of May. By contrast, net profits for merchants average about 3%.”
Banks make a smaller amount on the interest they charge on the relatively small balances that accrue interest.
We have one card that gets us 2% cawh back on everything (with no max) and the Amazon card that gets us 5% back on Amazon purchases. We don’t “work” to charge a lot but we charge more per “two months” on average than I made per “year” on average when I craduated from college in the early 80’s. Anyone know of a 3% on everythong card?
I use cash.
And I pay with exact change.
Not many people like me left on this planet.
@apartmentinvestor Robinhood gold does 3%. I haven’t tried it (I’m still suspicious of RH), but there it is.
Apartment Investor
The Amex Blue Cash preferred isn’t bad.
It’s kind of grocery and tv app streaming focused. Plus a bit for gas stations (old school standalone ones).
So 6% back on your first $6,000 worth of groceries a year.
6% back on all tv apps, and a special extra $10 a month back for a Disney type bundle.
3% back on transit, Taxis, Ride share, uber? Buses
1% back on all other purchases.
When you get your statement you pay the minimum and then they give you your rewards. Just put them back towards the rest of your statement amount.
Prob can have your spouse sign up also if you go over the grocery $ amount for an extra $6,000 amount of 6% discounts. (6,000x.06=360$)
There is an annual fee though, so sorta have to work it to make the math work.
They do cool promos too that have a lot of value, one right now is 10% off an insurance bill up to $20 back.
I try to shop around at a lot of grocery stores, some people on YouTube are real pros at this kinda thing. They will get 10 items worth $50 for about $5. It’s wild to watch them go about it.
Beginning very soon everything I purchase, at certain businesses, will be cash or check as some are charging a 3% credit card fee. My cards are free, not the high end type so do not return 3%!
Every one has offered one of the fee type but I’m like Bubba and don’t bite.
Mr. Wolf: “I told you where the spending money is coming from: record employment with record salaries and wages.”
This is exactly where the services inflation originates.
Yes, there’s that dynamic too.
For some reason though, most people I’ve spoken to feel like they’re worse off than in 2019. They might be objectively wrong, but that’s how people seem to feel.
If you are trying to buy a home, you are much worse off, 30-50% higher price plus twice as high on interest rates for much of the country, and if you are lucky, pay is up 20%. But be patient, prices are moving down now in lots of places.
Because the gap between the obscenely wealthy and everybody else is bigger than ever, and big ticket items/assets, etc. have never been more expensive.
I trust Wolf and his charts more than anybody else, but for some reason I think they’re not capturing the true financial pain that a large percentage of people are feeling due to inflation.
@Depth Charge I’m pretty close to “obscenely wealthy” but I still feel like I am worse off than 2019. On paper I may be better off (with ammost every property worth at least a million more) but I have less cash flow (with expenses going up faster than rents).
Depth Charge
Look, we had an inflation shock from late 2020 through mid-2023 or so, when there was a lot of inflation 5%,7%, up to 9%, then 7%, 5% etc. During that 3-year period, prices rose by 25%. All my inflation charts show that. Some prices rose a lot more, such as used cars (50%+), insurance, auto maintenances, beef, coffee, etc. Some prices rose less. This is all documented in my inflation charts.
Wages rose too during that time from late 2020 through mid-2023, but not nearly enough, so wage earners fell behind. And that’s brutal, that’s a reduction in the standard of living, and that was clear in all my charts that dealt with it.
But then prices rose much more slowly, inflation was running in the 3% range, some prices actually fell by quite a bit, and wages grew faster than prices increased, and wage earners started catching up.
Then there’s another issue: age.
Younger workers, workers in their prime, got promoted, got trained, switched jobs to get better jobs, got poached and recruited away from current jobs, and changed industries, during the labor shortages, and they had big pay increases, and caught up some time ago.
But older workers often don’t get raises anymore, they’re getting aged out of the workforce. Younger managers try to get rid of them. Companies try to get rid of them by not promoting them, by not giving them a raise, by making them miserable, by making them feel lucky to even have a job. And when they get laid off, they cannot get a job anymore. They’re ignored.
That’s especially true in tech. This has nothing to do with the economy. It’s age discrimination, the most tolerated and often encouraged form of discrimination (though it’s illegal). And it has been around forever.
So many older people (many readers here) did not benefit from the wage increases – they just got the price increases without the wage increases. And that’s where a lot of the pain is. And that’s very typical. That’s why older people hate inflation so much. But inflation is a much lesser issue for younger people. Quite a few of them doubled their pay over a three-year period by switching jobs multiple times, they blew right through this inflation.
But again that’s age discrimination, and it has always been that way, and it has always been painful. My dad went through it, my wife’s dad went through it, now friends of mine are going through it.
The people that might do better and be happier when they’re still working at an older age are people at the top of the corporate hierarchy, politicians, and people who have their own shops.
But this site isn’t about social studies or social justice. It’s about the economy and finance, and that’s how the economy has always worked, that’s the dynamics of the American economy, rampant age discrimination is part of it, that’s not new, and everyone knows it. And that kind of stuff doesn’t belong into my articles.
@Wolf, my Dad (who didn’t graduate from college) spent over 30 years at the same big corporation and was forced out in his 50’s. It was super painful for the family and is probably the main reason I’ve been self-employed for most of my life. Do you really think it is “age discrimination” that makes companies want to get rid of older employees? I could be wrong but is seems to me that most companies always want to replace high paid workers with lower paid workers (especially if the lower paid workers work longer hours and get more work done). More often than not the 55-year old guy makes more than the 35-year-old guy and it seems to me the main reason older people are getting pushed out is more related to the bottom line than any kind of “discrimination”
Older workers getting paid more is only the case in work environments that pay by seniority, such as unionized organizations with a seniority-based wage scale. At your dad’s time, that was a bigger part of the working population.
But in other environments – and they dominate now – the younger people are getting hired in at higher salaries, get bigger raises, get promoted, get promoted past the older people, and make more money and then try to get rid of the older people.
There is a performance aspect to it though. Some older workers are stuck in their ways and don’t want to adapt to new technologies, processes, methods, etc., which gives ALL older workers a bad reputation, though many older workers go with the flow just fine. And younger people get impatient with them and try to get rid of them.
In the trades that are physically hard, there is also the aspect that older workers have worn-out bodies. If you’re in those trades, you want to get to the point where you can use your knowledge and thinking and let younger bodies do the hard work under your guidance.
We have been affected by the new IRS rules which make self employed people report every nickel they make. That income gets lumped on with your other income and gets taxed at almost 40% after State, Local, Federal, Self Employment taxes are figured in. So we are in the workforce in order to pay 40% back to the government and getting nothing back. Never used to be like that. You can thank Yellen and Bambam for these changes. At the same time property taxes are up 300% over the last 2 decades. No way to escape that.
DC,
I’m one of those drunken sailors by spending to replace items in the last 3 months: stove, headphones, earbuds, phone. Spent at least $3K very reluctantly. Still need tires and some work on the car.
Where I disagree with Wolf is on the increasing income. Ours is going to be down for the 3rd year in a row.
Wolf, Great comments about age discrimination and the varying impacts of inflation on different age groups.
Neither of these get discussed as much as they should and appreciate the detailed insights.
Ok, so if the economy is doing so well, and here is the 64 dollar question, when does the FED raise interest rates?
Swamp Creature
I think you are incorrect on that tax stuff sir. All I am seeing is there is an extra 7.65% for self employed people and you can deduct that for a 33% cash back refund. And that extra is just going to pay YOUR social security and Medicare. So you get it back later if you live long enough.
And while you may not like Yellen. She is prob brighter than anyone on this website by a long long run.
I have 2 sets of friends.. one set with no assets no home and decent job.. they are faring worse than 2020.
Second set having lot of stocks and multiple homes are doing awesome.
Just my own personal observation.
Yes. Life is great for those with many millions of assets, as assets have increased way more than consumer inflation. But the flip side is that the working man, even those who have gotten raises, have a harder time obtaining assets. Meaning that retirement is going out of reach.
Oh yeah,
Most careers had what a 25-35% inflation of their pay.
Think adding a $100 to a blender and 3oz of water. That’s inflation baby. Watered down money.
And most hard nosed employers didn’t say “hey Bert, get on in here to my old office, let’s have a chat Bert. Well Bert since we think this inflation stuff ain’t right, well we’re going to give you back everything it took. Bert you can stop happily sobbing now.”
Always blame the workers.
People hate the workers.
Meanwhile Bezos could buy the moon.
Atlantic: The American Car Industry Can’t Go On Like This
Ford is taking drastic steps to compete with China’s cheap EVs. Even that might not be enough.
Last year, Ford CEO Jim Farley commuted in a car that wasn’t made by his own company. In an effort to scope out the competition, Farley spent six months driving around in a Xiaomi SU7. The Chinese-made electric sedan is one of the world’s most impressive cars: It can accelerate faster than many Porsches, has a giant touch screen that lets you turn off the lights at your house, and comes with a built-in AI assistant—all for roughly $30,000 in China. “It’s fantastic,” Farley said about the Xiaomi SU7 on a podcast last fall. “I don’t want to give it up.”
Farley has openly feared what might happen to Ford if more Americans can get behind the wheel of the Xiaomi SU7. Ford was able to import a Xiaomi from Shanghai for testing purposes, but for now, regular Americans cannot buy the SU7 or another one of the many affordable and highly advanced EVs made in China. Stiff tariffs and restrictions on Chinese technology have kept them out of the U.S. If things changed, Ford—along with all other automakers in the U.S.—would be in serious danger. Chinese EVs can be so cheap and high tech that they risk outcompeting all cars, not just electric ones. In the rest of the world, traditional automakers are already struggling as Chinese cars hit the market. In Europe, Chinese brands now have roughly as much share of the market as Mercedes-Benz. “We are in a global competition with China,” Farley said earlier this year. “And if we lose this, we do not have a future at Ford.”
It appears obvious why Ford (Found on Road Discharged) is now failing so very badly. I would suggest that Jim Farley go drive a few BMWs to find out what cars are all about – or else just close down their doors for good.
As someone who owns and drives a BMW, in Europe as well as in USA, I can only say that the Chinese cars are so good that they are taking market away from German made cars in Europe. I’ve driven several, and there’s a learning curve to doing that, but they are amazing.
Both my local BMW and MBZ dealers now sell Chinese (although on separate lots.)
The Chinese are smart. They will get into the US market. And the result will be the same as when the Japanese and Koreans came in. Detroit will try to unionize the shops (although adding robots to the union may be an issue), they’ll attempt to make and sell stuff that doesn’t compete (which is why Japan makes cars and Detroit makes pickups), and they will lose market share. Maybe this time the Gov’t won’t bail them out, but I doubt it.
I worked for GM as an engineer in the 80’s and left (partly) because I could see the Japanese were kicking our tails. I love cars and the auto industry but then came the Koreans. They make some very nice automobiles now. So suddenly the Chinese are exploiting the “electrification” of personal transportation at levels the US manufacturers never anticipated. Self-driving, automated everything. I’ve read that the self-driving cars in China are so prevalent that they are moving towards a signal/indicator that robot cars are without a driver. With Chinese industry being one of the worst climate affecting countries for smog and awful air breathing quality, it’s hard to argue with their move away from ICE.
I love America but I don’t see how anything we are doing now is going to make us a car making powerhouse in the next 10 years.
@Chase D I graduareed from college in 1984 and bought a new 4cyl Porsche 944, a friend bought a 1984 4 cylCamaro that was such a piece of crap I was certain America was doomed. My girlfriend at the time who also graduated bought a 1984 Honda CRX that had even higher quality than the Porsche and Camaro. I bought my first American care ever a few years back when I bought my wife a Lincon Navigator and it is a nice car (with a LOT more space & seats than her old Range Rover). American fars are a LOT better than the 80’s but still not as good as Japanese cars and German cars (I have two Japanese SUVs two German cars and a British SUV (that is lower quality than even the worst American car – but I still love it)
The last American car I ever bought was a 1978 Mustang off a used car lot. This car was a pile of shit. It almost put me into bankruptcy because I was poor back then and could never get the car to ever run properly. Ford destroyed their reputation by putting such pile of junk on the road. I never purchased an American car again after that experience, and I never will.
The BMW X7 blows the Navigator away and if you want even more you can get the BMW Alpina BX7.
@SoCalBeachDude I wish we didn’t need such a big car (to transport so many people and dogs in crates) but the X7 only has about 10% more space behind the front seats than a Range Rover compared to the Navigator with close to 50% more interior space. I joined the BMW CCA when I had a 2002 in college (and I got my “40 Year Member” pin a few years ago). Even if the X7 was bigger I would have a hard time buying one since I think the massive “pig snout” grill is ugly (I has an E24 Gray Market Alpina B7 in the 90’s that I still think is one of the best looking cars ever made with the slim body color euro bumpers).
…kinda makes one wonder, reflecting on this ’80’s state of U.S. auto-manufacturing affairs, how ‘The Shining City on the Hill’ became such a meme of national entitlement/hegemony by seemingly not much more than also embracing the one of ‘Murican Exceptionalism’…
(…moving to the present, Wolf’s most-excellent establishment remains an invaluable aid in one’s recon in our everpresent smoke…).
may we all find a better day.
People have dismissed Chinese Science and Engineering capabilities as not up to par with the West. That they are just really good copiers. Well, I got bad news for those people. As an engineer I see products coming out of China that have no equal anywhere. Yes they copied but now they are innovating and creating at a fast pace and I don’t think the West can keep up. The really bad news will be for our defense and armed forces. Gee, those men who transferred our technology and production from our country to China were real geniuses (sarc). Our children and grandchildren will pay the price for this.
Do you think the greedy old codger CEO who farmed the toothpaste out to China really cares that his grandkids are being poisoned? ‘I got mine, so f**k ’em’ is his mentality. He’d sell his own newborn for a buck.
Technically that mentality started with Jack Welch and has proliferated to his copies.
Dumb dumb dumb
A great satire of his ilk is Alex Baldwin playing on that Tina fey show.
It all comes down to China’s willingness to invest in academic science and technology. 20 years ago, biology papers from China were rare and looked at with skepticism. Now it is not unusual to see innovative breakthroughs coming from the major academic and research institutions. American exceptionalism requires investment and immigration of the brightest young minds. It was a good run
AD – …would suggest inserting the words: ‘serious domestic’ ahead of ‘investment’…
may we all find a better day.
Chinese are really good at copying things and making things much better and of course it takes a degree of innovation. In China R&D is received and duplicated.
Name few things in last few decades which are used widely which came out of China ?
One cant name even a single thing today.. may be after few decades.
The culture of innovation is very strong in usa and it enables people to try new things fail and get up and try again .
But I dont see this happening a lot in usa in the coming future as cost of everything has gone up a lot due to financialization of all things essential for life. This financialization happened due to Fed artificially suppressing the rates and thus forcing others to look for yield elsewhere.
China has had a rover on the moon, Jade Rabbit, for some time. They recently sent up a replacement crew to their orbiting space station. They just had the world’s first foot race of humanoid robots,
All this ‘Chinese stuff must be junk’ reminds me of the 60′ & 70’s opinion of Japanese cars. And we know how that turned out.
Don’t get me wrong: I hope the US led West continues to back Taiwan and also push back on China’s bullying of all its smaller neighbours. The fundamental challenge for China is moving on from the CCP, beginning with taking the portrait of Mao off the currency.
The Lucid Gravity has a 926-volt architecture. As I have commented before, my dream car would be a small and light weight Lucid sports coupe that wold be quick in acceleration, but also agile. Agility and mass are somewhat mutually exclusive. A 2,500 kg vehicle that’s quick off the line has no appeal for me.
As reported by Patrick George on 7 May 2025 from the Shanghai Auto show: BYD has a 1,000-volt architecture car that has “Megawatt Charging.” 1,000 volts delivering 1,000 kilowatts of electric power that will juice up the batteries for a 200 mile range in 5, yes 5, minutes.
First, BYD developed 1,500-volt silicon-carbide power chips, redesigned electric motors and the motor controllers. The challenges to this system are electrical, magnetic mechanical and thermal. In other words, a shit load of physics problems all combined together.
The batteries are 100 kWh lithium-iron-phosphate units. They have less power density than nickel manganese cobalt batteries, but they last longer. The batteries also have a unique set of electrolytes, separators and electrodes that reduce internal resistance. Internal resistance during charging = heat.
If you’re following this so far, add in another step that’s needed. The whole system has to be cooled, or refrigerated very efficiently and with a huge amount of thermal energy pulled out of the batteries while this super fast charging happens.
Mr. Farley, is Ford doing this? Because automotive engineers in China are not only doing it, they’re working on making cars that can be manufactured at reasonable prices with this. Hello?
Back to my dream car; the power, quickness, speed and agility that I get riding my six year-old, 209 kg Tuono V4 is what I want from a car. I won’t hold my breath waiting for one though.
When I ride her at 50 mph in second gear, Thunder (Tuono in Italian) is Lightning – ready to strike! Yes, I know. I’m silly.
Some credit to Ford should go out, though. Check out Max Verstappen and Chris Harris in the new Mustang GTD. This machine bends the laws of physics between mass and agility.
Okay, so I just heard something similar to what I wrote five days ago about giving credit to Ford. On the brand new review of the 1,930 kg Mustang GTD from Top Gear’s YouTube posting, check out the comment at 19 minutes into the 21 minute video:
“For a car like this to exist, you need a CEO that is going to ignore the financial, the logistical problems with bringing it into production and just keep on pushing it through. So a huge amount of credit has to go. Jim Farley, the CEO, for driving this car into existence!”
Wolf, if you were still running a Ford dealership, I reckon you’d want to take one of these for a spin! (The MSRP is around $330k though.)
I’m happy with our Ford Fusion Hybrid that gets 50 MPG when I’m trying to trick it into maximizing its electric system. That’s all the thrill-while-driving that I want to handle these days 🤣
The stupidest idea of a lifetime was to kill the Fusion Hybrid (2020 was the last model year). That decision was made under Farley’s predecessor, Jim Hackett, in 2018, or maybe even by his predecessor Mark Fields in 2017.
After making a long list of stupid-ass decisions, Fields got kicked out in 2017. After making a long list of stupid-ass decisions, Hackett got kicked out in 2020. Historically, Ford’s biggest problems were always its top executives.
Still waiting for Farley to turn the company around. But he already made a series of stupid-ass decisions, including by focusing the EV strategy on higher-end luxury vehicles designed to be profitable at prices over $80,000. Ford is a mass-market brand, and there are not that many people that want to drive a luxury vehicle from Ford. Everyone knows that.
But they saw Tesla start out that way, and they followed, but without Musk’s panache and Tesla’s cool, and so it failed. You just cannot sell a lot of $80,000-plus Fords in the US. So now Farley had a come-to-Jesus meeting with Jesus himself apparently, and decided to skuttle that strategy and refocus on the lower-end of EVs, the less than $35,000 arena where other automakers are now making hay, and the Chinese are totally cleaning up. That’s a decision they should have made 5 years ago. Now it’s very late in the game.
Farley also made the decision to make Ford dependent on Chinese battery technology and production, and that bit him in the ass.
The next words from Jack Rix as he concludes the video review, “I know. It’s silly. And preposterous.”
I can relate to that.
Wolf,
Thank you for the great reply back! As I read your ecommerce comment about brick-and-mortar grocers, and combined with, “That’s all the thrill-while-driving that I want to handle these days,” I thought of this silly behavior that I did thoroughly enjoy this morning.
As I left my favorite Cub Foods store riding on Thunder (in perfect conditions), my backpack was loaded up with 10 kg of groceries. The laws of physics kicked in – only to be countered by the Aprilia ‘wheelie-control’ system. You see, with me being 1.91 meters tall, the backpack significantly raised the center of mass on the bike. And since the exit from the grocer leads out onto I-35 W in an uphill switchback ramp, it’s the perfect place to let Lightning strike!
However, I should have leaned forward a bit more, because I was not expecting that the wheelie-control would kick in for a split-second as I hit 3rd gear (which was a good thing). Oh yeah, I love that bike!
Yup, Ford now makes a two-metric-ton machine that costs one-third of a million dollars. A few silly things for a few silly people, I guess.
YMMV
Not silly, powerful. I’m in awe of you, always have been. And envious, too.
BMWs are vastly superior to everything that Lucid has to offer.
S C B D,
That’s a pretty strong and generalized statement. Without driving a new top-end Lucid Gravity vs the best BMW SUV, I have no way of making any determination in that regard.
I do know this: my older car and motorbike have fresh sets of the best (for street performance use) Michelin tires on them. The M4 got them in spring 2024 & the bike this past April. For not a whole lot of money, this makes a huge difference. To upgrade a motor vehicle, that’s the first place to start.
The limiting factor on performance with my car and motorbike is using them on public roads. On the other hand, the limiting factor on performance with my Bianchi is me.
BMWs are not vastly superior to the Chinese cars available in Europe. They are vastly more expensive, and even that’s an issue as the Chinese vehicles come with such high tariffs.
The Germans, and French, and everyone else west of the Urals, is terrified of the cost and quality of Chinese cars and trucks.
“…has a giant touch screen that lets you turn off the lights at your house, and comes with a built-in AI assistant”
A giant computer on wheels – sounds absolutely miserable to work on.
I wonder if the wiring insulation is soy based, too, to attract all the critters.
And it’s not just automobiles that the Chinese are going to challenge “American Exceptional ism”. They want a slice of the pie in many of the lucrative industries of the future. I don’t think most Americans realize the competition that it will face in the not to distant future.
Peter – this. (would posit the future has been ‘now’ for the PRC and the rest of the world for the decades since ‘Nixon went to China’…).
may we all find a better day.
Wolf – i sure wanna get a massive pair of rose colored glasses. Where did you buy yours?
Walmart.com, 100% organic plastic, three lenses, the center lens for extra bright-rose vision, AI-powered nose-pads, crypto-enabled, on sale for $1.99. Walmart ate the tariffs.
That’s why I’m always so offended when people call me permabear. I just don’t get why these people can’t see my rose-colored glasses.
Wolf, you slay me. Haters gonna hate. It is rough living in a world where data that contradicts people’s n=1 experience must be dismissed as hallucinations (or glasses of the rose variety). I laughed, twice, reading your response.
I don’t see drops in retail spending anytime soon.
With the housing market essentially locked up those dollars are being funneled elsewhere.
Government is pressing harder on the debt pedal so it’s kind of hard to have a recession.
FED hasn’t got Inflation under control yet and can’t raise interest rates otherwise borrowing costs go up; can’t really lower them either.
If and when the Government has to stop just the $2 trillion overspending the real pain will begin and I think they know that.
Monetary flows, the volume and velocity of means-of-payment money, the 10-month rate-of-change in the proxy for R-gDp, is still positive (courtesy of BCA in Canada). The latest Atlanta GDPnow estimate is 2.5 percent.
My personal feeling is that the consumer is in great shape, and their balance sheets are in great shape, because all of the pain has been transferred to the federal debt.
All of the federal dollars that are borrowed every year (approaching $3 trillion now) ultimately end up in someone’s wages, or in the wealth of the rich. The latter spends that money, and that ends up in someone’s wages.
Try and join a country club…….and see how long the wait list is….
and the entry fee increase from just 4 years ago.
That is a great wealth indicator…….
The “big beautiful bill” making the tax cuts permanents will keep the money flowing. Lower income households don’t benefit much from it, but they have to spend every penny anyway no matter what (perhaps having to cut back on MacDonald’s now), middle income earners benefit somewhat and can continue to spend (maybe they have to contend with a used truck now, instead of a brand-new 100k+ rig, but still, life is not bad), and for the higher income brackets life is the best it ever has been, and they can gamble even more recklessly (Ethereum is hot).
Yep. The top 1% has about 50% of the wealth, and a lot of political power, so investors believe Congress and the Fed will jump in to bail out the stock and housing markets, if need be.
Obviously, the Federal Reserve will do no such thing when housing prices fall as they are and will and the Federal Reserve has nothing whatsoever to do with the equity (stock) markets.
Cutting back on McDonald’s — cutting spending there to zero — is one of the best things anyone can do for their health. And Americans are starting to get it maybe.
Plant and eat from a garden. If you do not have one buy a lot and work it on weekends. This will add ten years to your life.
Andrew p – …and don’t forget supplement with that boiled-frog soup simmering on the stovetop…
may we all find a better day.
Did you read about the Japanese at McDonald’s?
Apparently they bought thousands of happy meals for the Pokemon cards. Then threw the crappy food away and kept the cards!
Drunk sailors indeed
The top 40% of the population has about 75% of the income. They can keep the economy rolling all by themselves. The bottom 60%, trying to survive on just 25% of the income, are struggling and will continue to struggle. Choose your parents wisely.
Median household income = $80,000. Median means the value in the middle = 50% of the households earn more than $80,000, and the other 50% earn less than $80,000. But households includes singles living alone, etc.
The median income of married couples = $119,400 = 50% of married couples earn over $119,400 and 50% earn less than $119,400.
With higher and higher portions of the population in the retired age groups, stats like this are increasingly meaningless. My parents’ income is basically social security and their RMDs and they’re quite happy living on that. They still travel and dine out when they feel like it, but they’ll admit that’s less and less these days (I live a short 8 miles away). They own their house and car and don’t “need” a higher income; they’re not “struggling” despite being below median household income.
Better to go with median household income for ages 25-55 or so.
How can anyone look at these charts and think a rate cut is warranted because rates now are “restrictive”?
Every seller of residential RE looks at those charts and sees justification for a rate cut that will help them move their overpriced homes. It’s always the rates, never the prices.
Wolf …
any comments on the Cantillon Effect?
It seems the money supply doubling in ten years and certain asset prices doubling in ten years is a strong connection.
@just asking:
Look at the 10-year real interest rate yield.
https://fred.stlouisfed.org/series/REAINTRATREARAT10Y
The asset a borrower gets for borrowing on real estate is much more valuable than “certificates of confiscation”.
Treasuries, what an oxymoron.
I have seen money supply numbers, but never money stock by itself and money velocity by itself. Perhaps Mr Wolf could get this for us in chart form for the last decade or so.
Money stock and money supply are the same thing. The Fed calls it money stock, others call is money supply. It’s currency in circulation (paper dollars, much of it hoarded overseas), reserves, and cash in certain types of accounts, such as checking accounts, savings accounts, small CDs (less than $100k), money market funds, etc., plus cash in the process of being transferred, etc. There is nothing magic about it.
The footnotes 1-8 explain the categories that are included:
https://www.federalreserve.gov/releases/h6/current/default.htm
In the broader sense, there isn’t even any agreement what “money” is. It has something like 20 definitions.
A word to Swamp Creature
I have been driving my 2007 Mustang for 18 years and 100,000 miles and the ONLY failure was the wiper motor. The 4.0 L motor still runs perfect.
Ervin – a ground-truth YMMV! (…I’ll be grinning at this all day…).
may we all find a better one-
The economy has been ok for years. Something big did change. How it will affect what was a good situation remains to be seen.
An interesting observation on Manheim. EV prices are up year over year by 8.3.%. We haven’t had a ton of pre-owned EV’s, so people have been snatching them up fast. We don’t have to discount them if we price them right. Also, we have less new EV’s hitting the lot, so we haven’t had to discount them as heavily. It will be interesting to see what happens after September when the $7500 EV Rebate goes away. MB has already announced that they will be lowering prices for the 2026 models pretty significantly.
You’re in a MB franchise, if I remember right. The pre-owned EVs you’re talking about, are those MB models, or other brands? Are they trade-ins or auction buys?
Correct. Mostly off lease EVs. If you didn’t lease them new, you lost the $7500. The EQS SUV has been in particularly in high demand.
Thanks.
‘Renaissance Macro Research head of economic research Neil Dutta also shared an astonishing statistic with the WSJ: that capital expenditures for AI have contributed more to the growth of the US economy so far this year than all of consumer spending combined.’
This is from a site: ‘Futurism’, its AI bit sent to me by a journo friend.
The rest of the piece is about the rapidly receding expectations of the industry to make a profit that is anywhere near justifying this investment.
Looking at this again: surely it means AI capex exceeds the growth in consumer spending, not total consumer spending?
The key word is “contributed to.” That’s a GDP term, how much of an activity contributes to the GDP growth rate of, for example, 3.0%.
We know these companies and AI investors are spending a huge amount of money on this stuff.
I have said for a while that we won’t get a recession until the AI-spending bubble implodes.
AI related capital expenditures go into the GDP formula under “private fixed investment.” There was a big jump in Q1 but it stayed there in Q2. We might get another jump in Q3.
4th chart down:
https://wolfstreet.com/2025/07/30/whacked-down-by-plunging-inventories-and-whacked-up-by-plunging-imports-gdp-grows-by-3-0/
Spending on salaries for AI people, and on buying out AI startups at ridiculous prices doesn’t go anywhere in GDP until the recipients spend this money – and they are spending some of this money in bits and pieces, and it shows up in increased consumer spending.
I think AI investment is more about defending market share than expanding profit. Big tech companies have to invest hundreds of billions or another big tech firm will take their business. This is an arms race, costly for all involved.
For Google, AI is an existential threat that could wipe out their search profits.
I predict a big tech stock price crash ahead, as investors realize AI is more cost than opportunity.
Disclosure: I own zero big tech stock.
I wasn’t drunken-but definitely under the influence of Novocaine as my wallet was greatly lightened, after my prior efforts at self-dentistry went awry.
Winter Time comes, I love reading those Anton Chekhov short stories, as i go to bed.
My daughter is the top salesperson at a luxury new car dealership in one of the largest auto malls in the country. Sales dropped off a cliff a couple months ago has continued grinding downward. This is in southern California but may not be representative of the nation. However, it does seem significant.
People seem to have shifted to ‘cautious’ when it comes to big ticket items. This doesn’t mean they aren’t spending like crazy on other crap.
Not representative of anything. New-vehicle sales have been pretty good. In July: 1.37 million units, +6.6% yoy. SAAR 14.4 million, +7.1% MoM; +3.7% YoY
Is Wolf man on vacation? I pay for
my newspaper, gosh darnet! Why didn’t it come today?
The newspaper had some inexplicable technical issues. But now hot off the press, monster article with something like 50 charts, fun to just scroll through:
https://wolfstreet.com/2025/08/18/the-most-splendid-housing-bubbles-in-america-july-2025-the-price-drops-gains-in-33-large-expensive-metros/
Just wait for August numbers! Those school supplies lists are no joke.
But retail sales are seasonally adjusted, and most of the back-to-school sales jump is adjusted away as seasonal. It’ll show up in the not seasonally adjusted figures.
It won’t be just the school supplies. Not sure how many states participate but Ohio had a two week sales tax holiday this year 8/1 to 8/14 – the stores were packed! I do believe it was limited to items under $500.