Listings YoY: Orange County +50%, San Diego +44%, Los Angeles +38%, Riverside-San Bernadino +38%, Sacramento +37%, Fresno +33%, San Jose & Silicon Valley +29%; San Francisco metro +21%.
By Wolf Richter for WOLF STREET.
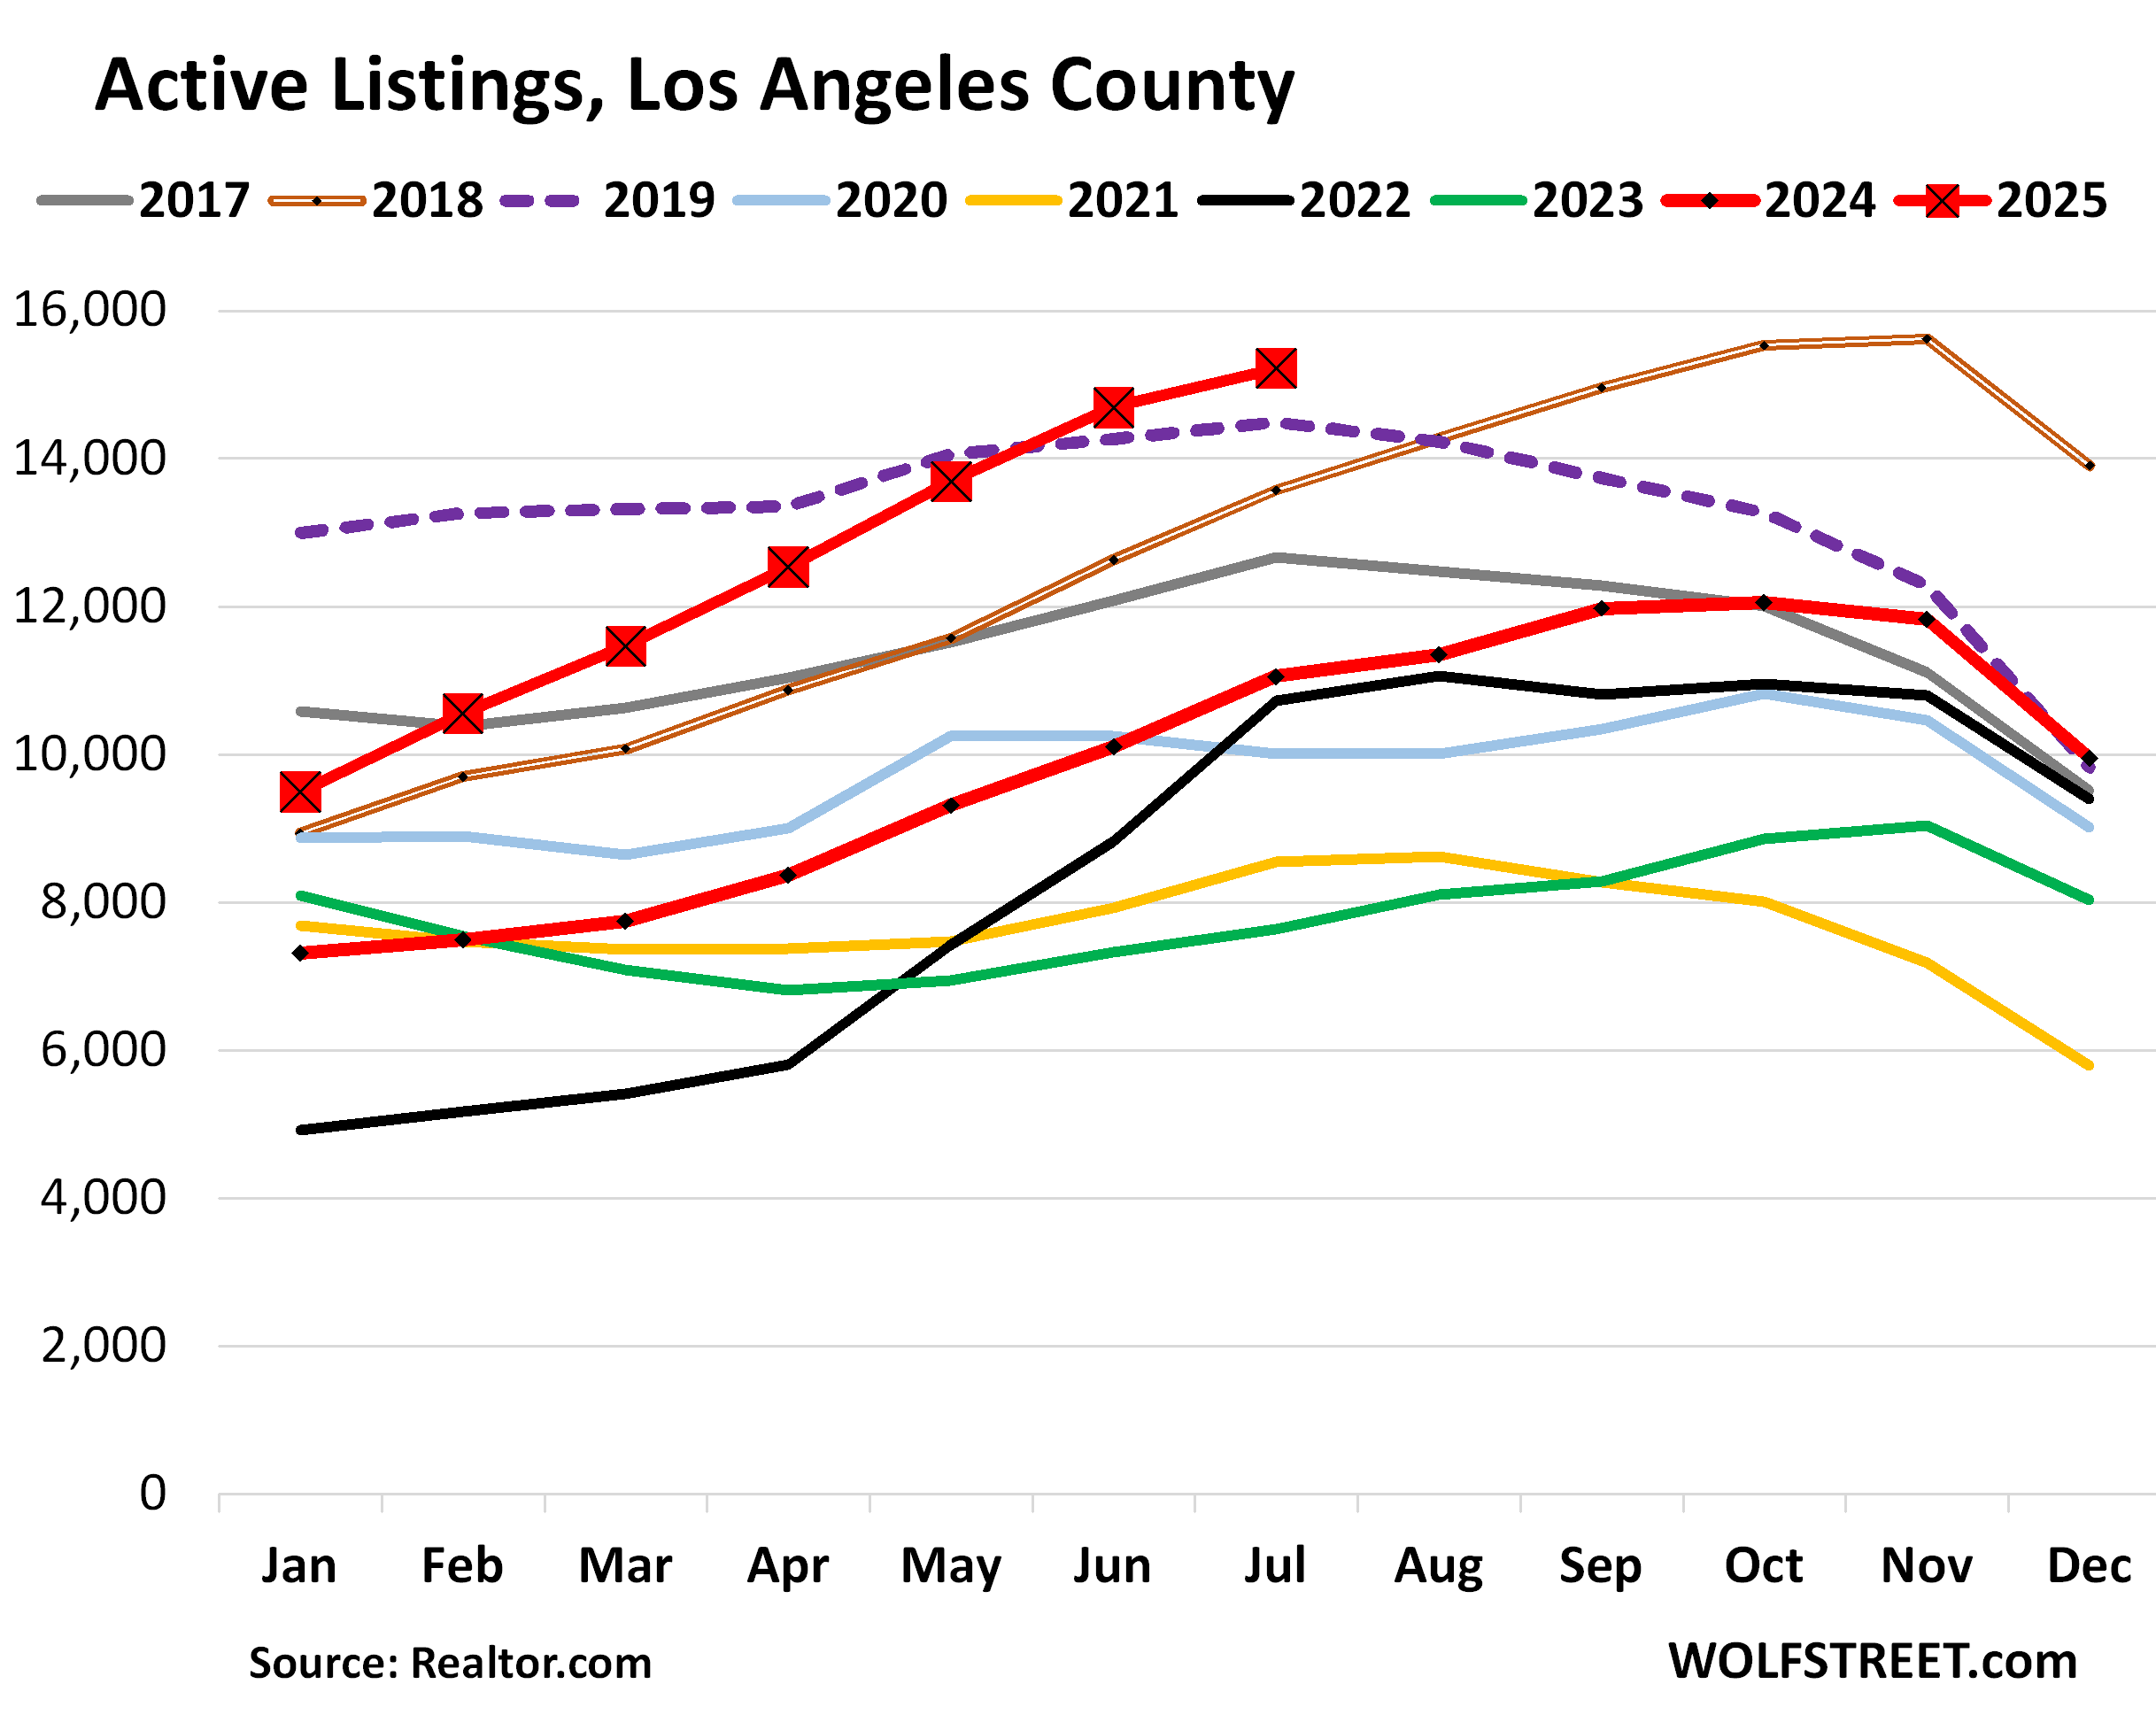
In Los Angeles County, active listings soared by 38% year-over-year, to 15,219 homes for sale, the most for any July in the data from Realtor.com, which goes back to 2016, further leaving behind the previous #1 year, 2019 (dotted purple line).
In 2018 (brown double-line) and through July 2019, inventories were piling up amid the Fed’s hiking cycle when the average 30-year fixed mortgage rate rose and briefly hit 5% by November 2018. In July 2019, with inflation below target, the Fed cut its policy rates, by which time mortgage rates were already meandering lower.
But in the fall of 2024, when the Fed cut interest rates by 100 basis points, mortgage rates rose by 100 basis points, driven by the bond market’s inflation fears.
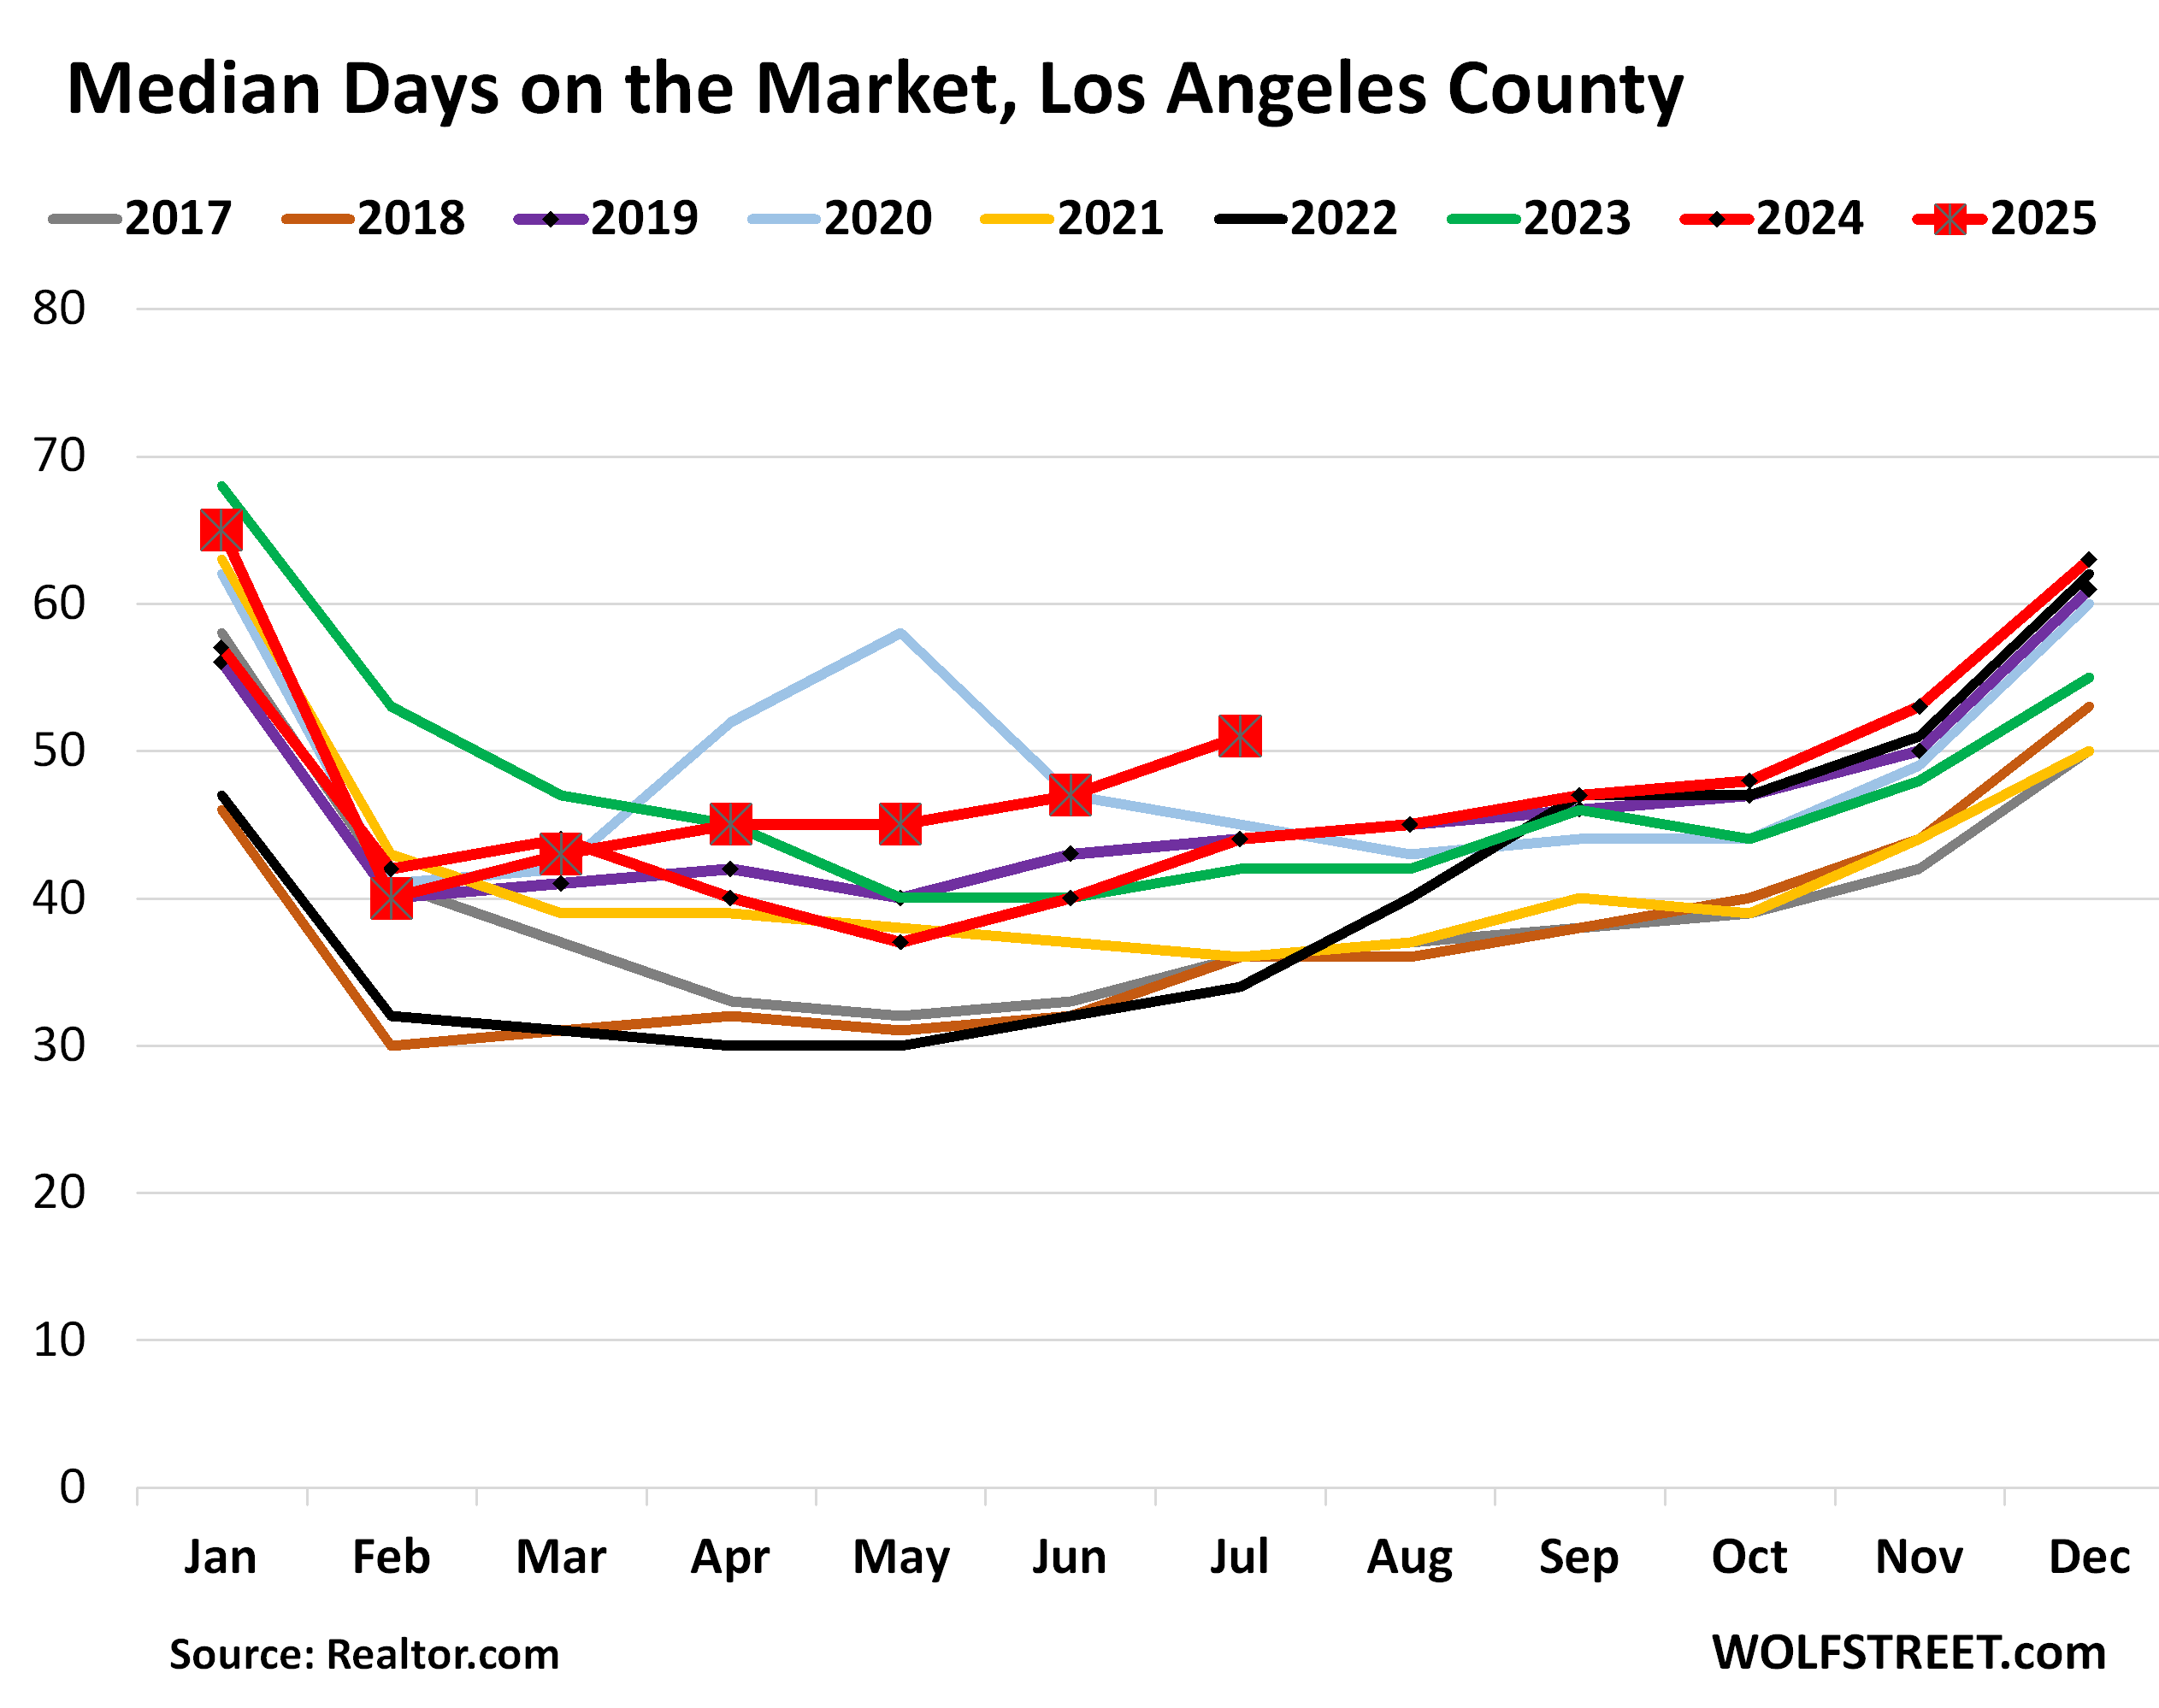
The median number of days that homes spent on the market in Los Angeles County before they were either pulled off the market (delisted) or sold rose to 51 days in July, the most for any July in the data from Realtor.com, which goes back to 2016.
Delistings are surging. There is an interesting combination of dynamics happening here: One, there weren’t a lot of new listing. And two, large numbers of homes were getting pulled off the market. Realtor.com reported today that nationwide, delistings soared by 48% year-over-year in June (the delistings data lags one month).
Sellers pulled their homes off the market “in frustration” because they couldn’t get the price they were dreaming about, Realtor.com had reported a month ago. “The trend is especially noticeable in the South and West, where inventory has surged back above pre-pandemic levels, and prices are flat or falling,” it said.
Today it reported that the Riverside metro, inland from Los Angeles, ranks third in the US in terms of the ratio of delistings (more in a moment). It noted that the nationwide rate of delistings to new listings rose to 21 delistings per 100 new listings in June, up from 13 delistings per 100 new listings in May. “Whether this trend continues will be something to watch,” it said.
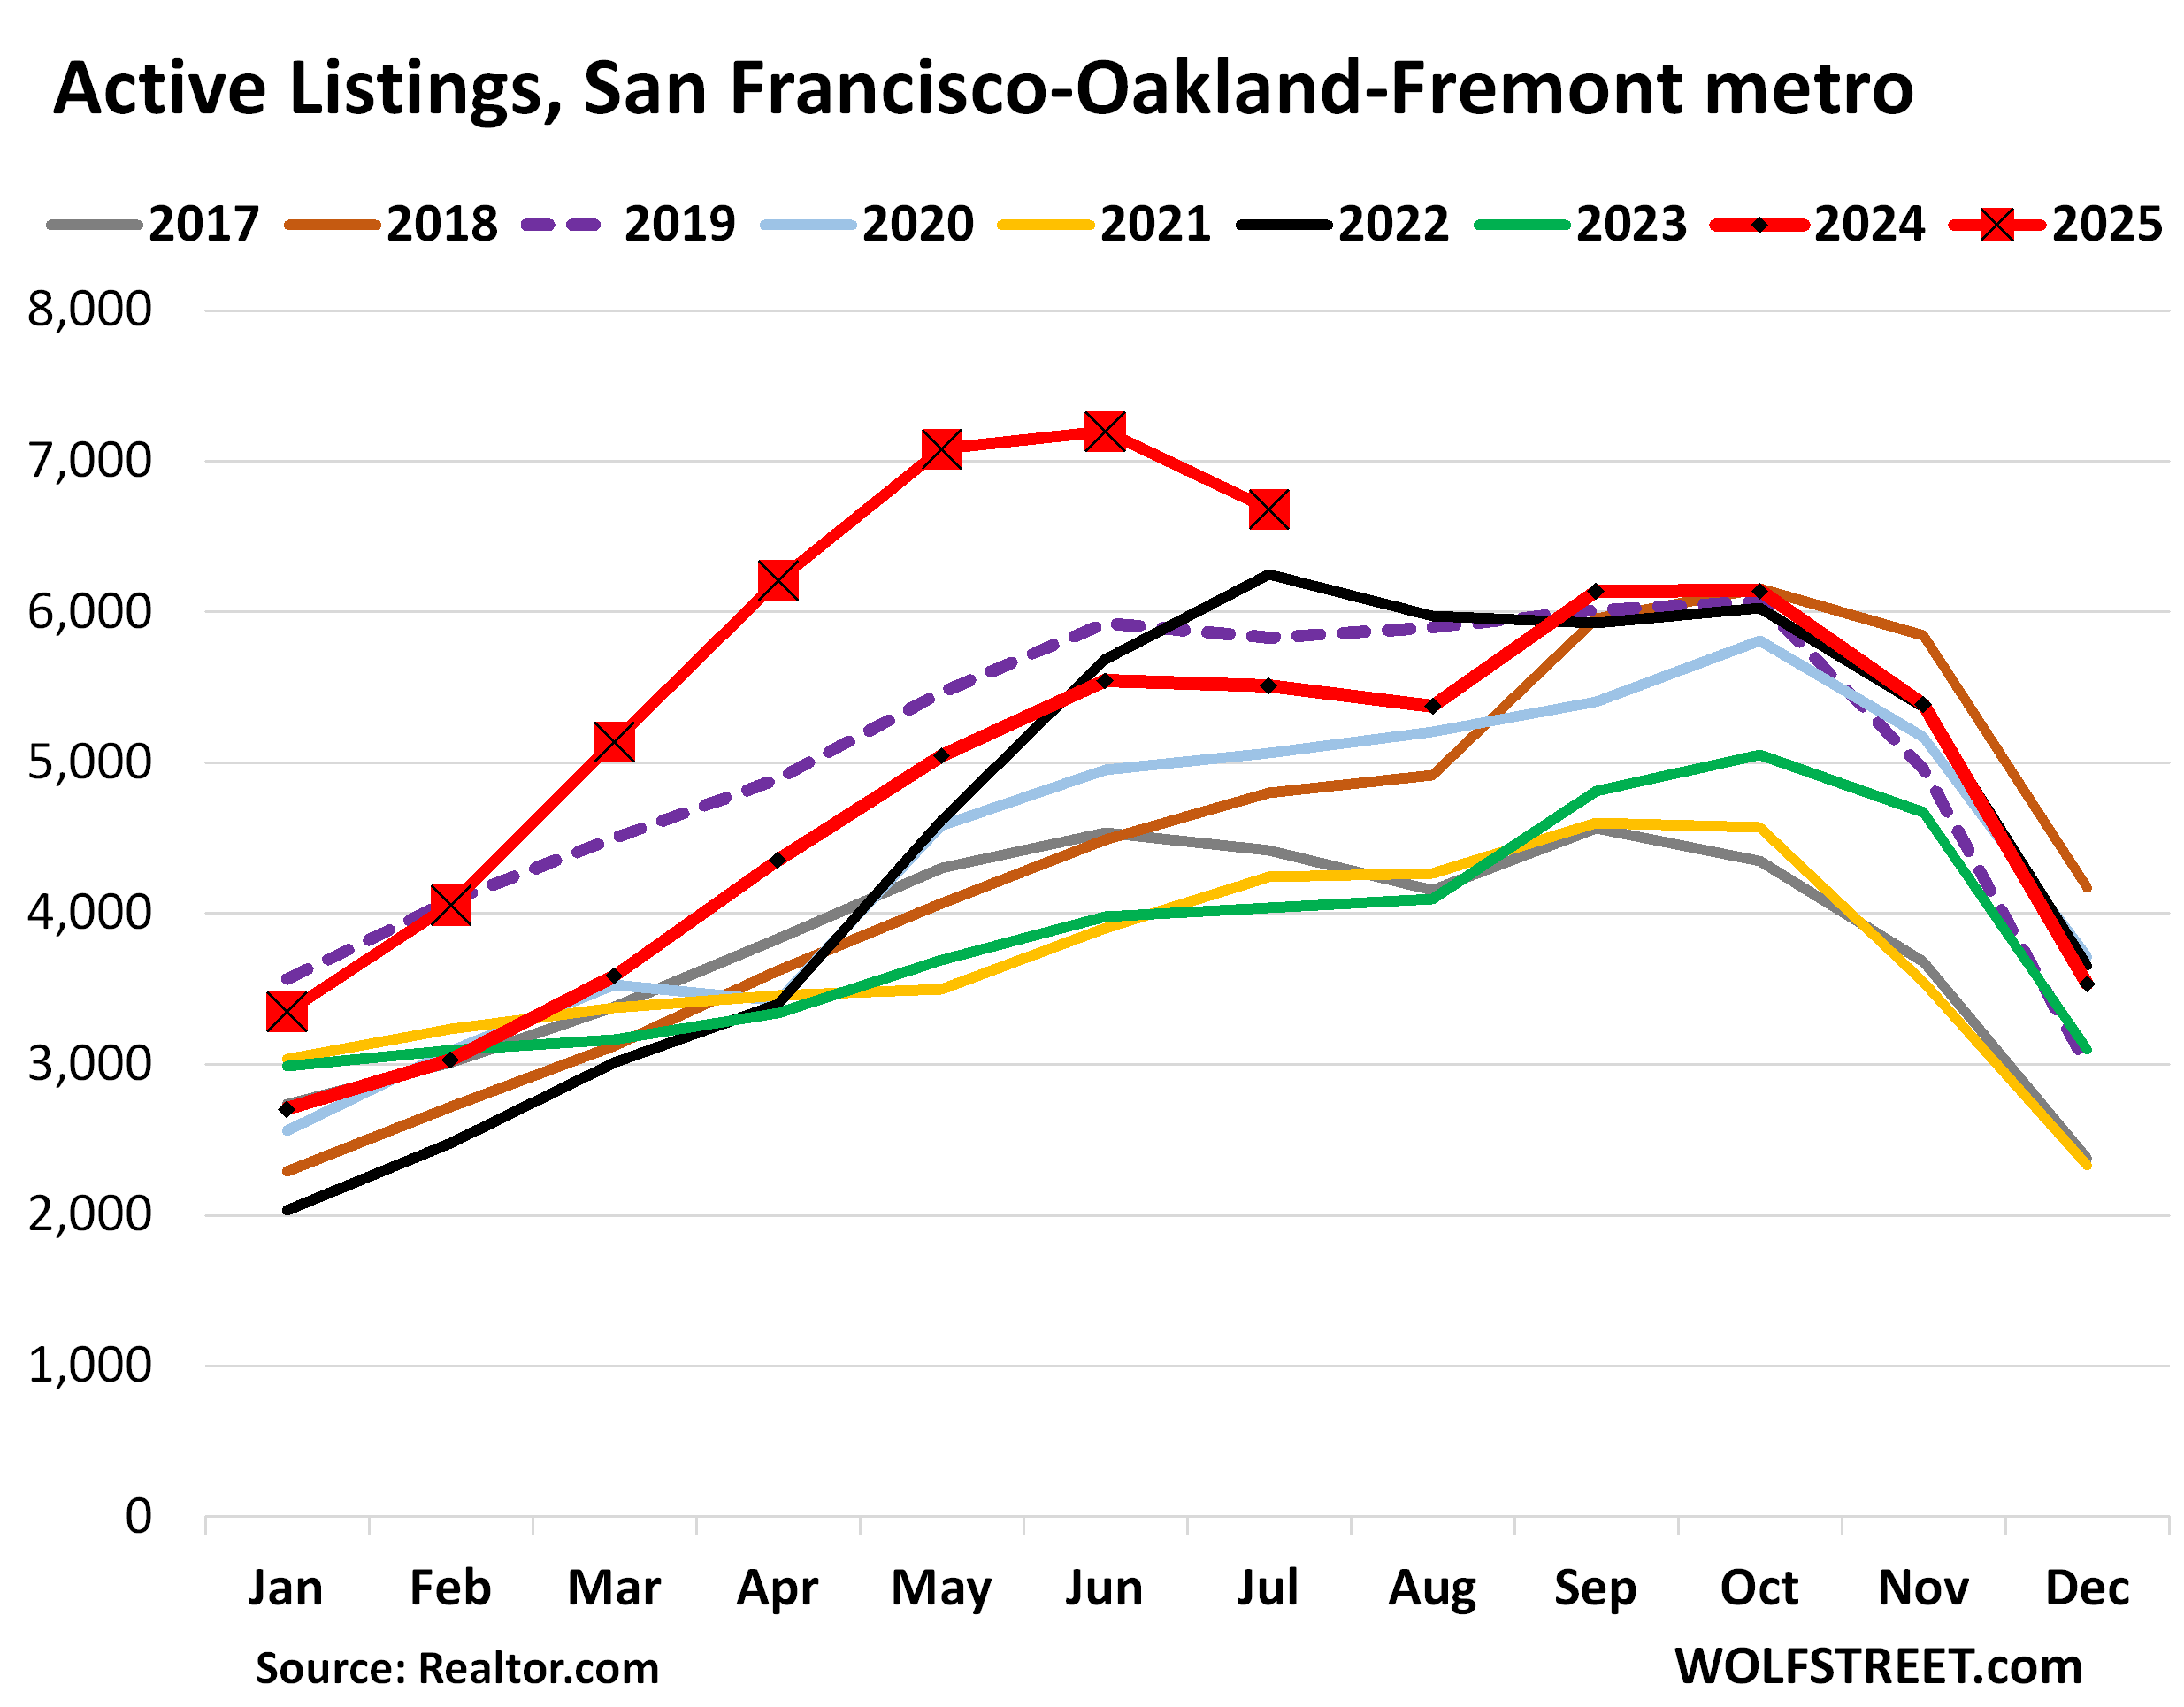
San Francisco-Oakland-Fremont metro: Active listings rose by 21% year-over-year in July, to 6,682 homes for sale, the most for any month in the data from Realtor.com going back to 2016. Compared to July 2022, the second-highest July (black line), listings were up by 7%.
This metropolitan statistical area (MSA) includes the counties of San Francisco and San Mateo (northern portion of Silicon Valley), part of the East Bay, and part of the North Bay.
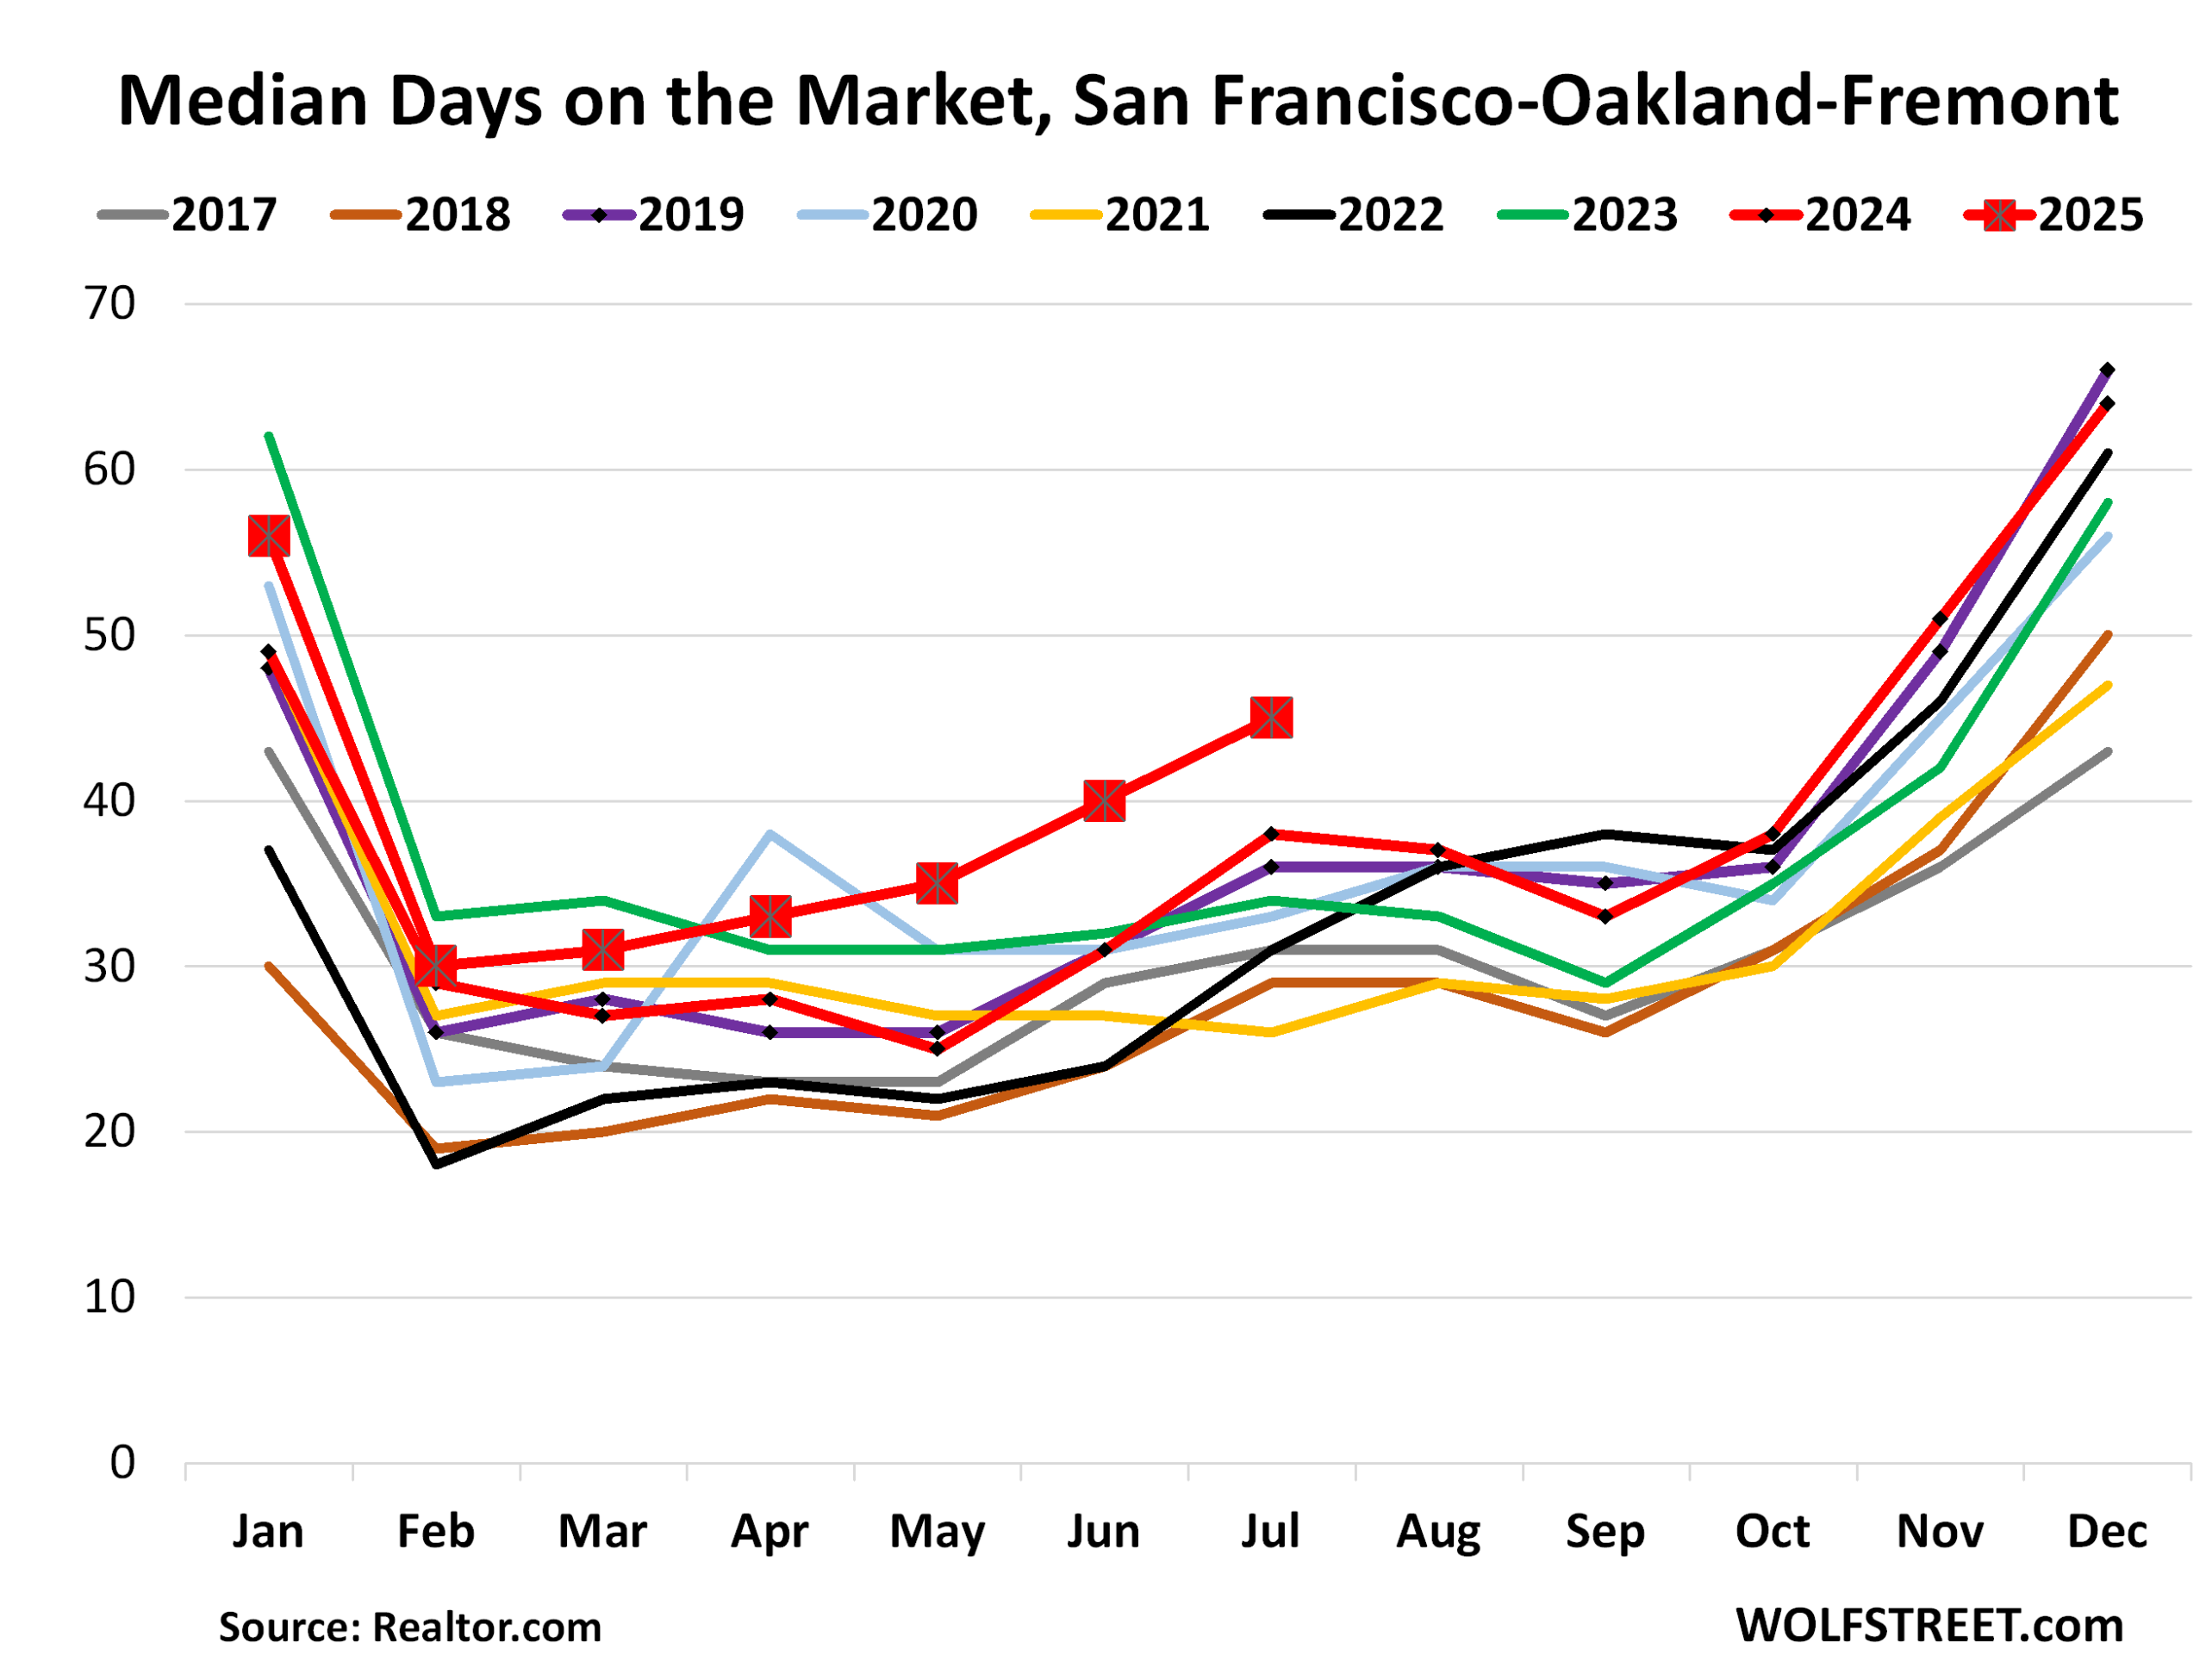
The median number of days that a home spent on the market in the San Francisco metro before it was either pulled off the market or sold soared to 45 days, the highest by far for any July in the data from Realtor.com going back to 2016. The runner-up was July 2024 with 38 days. In 2019 and 2018, homes sat for 36 days and 29 days respectively before they were pulled or sold.
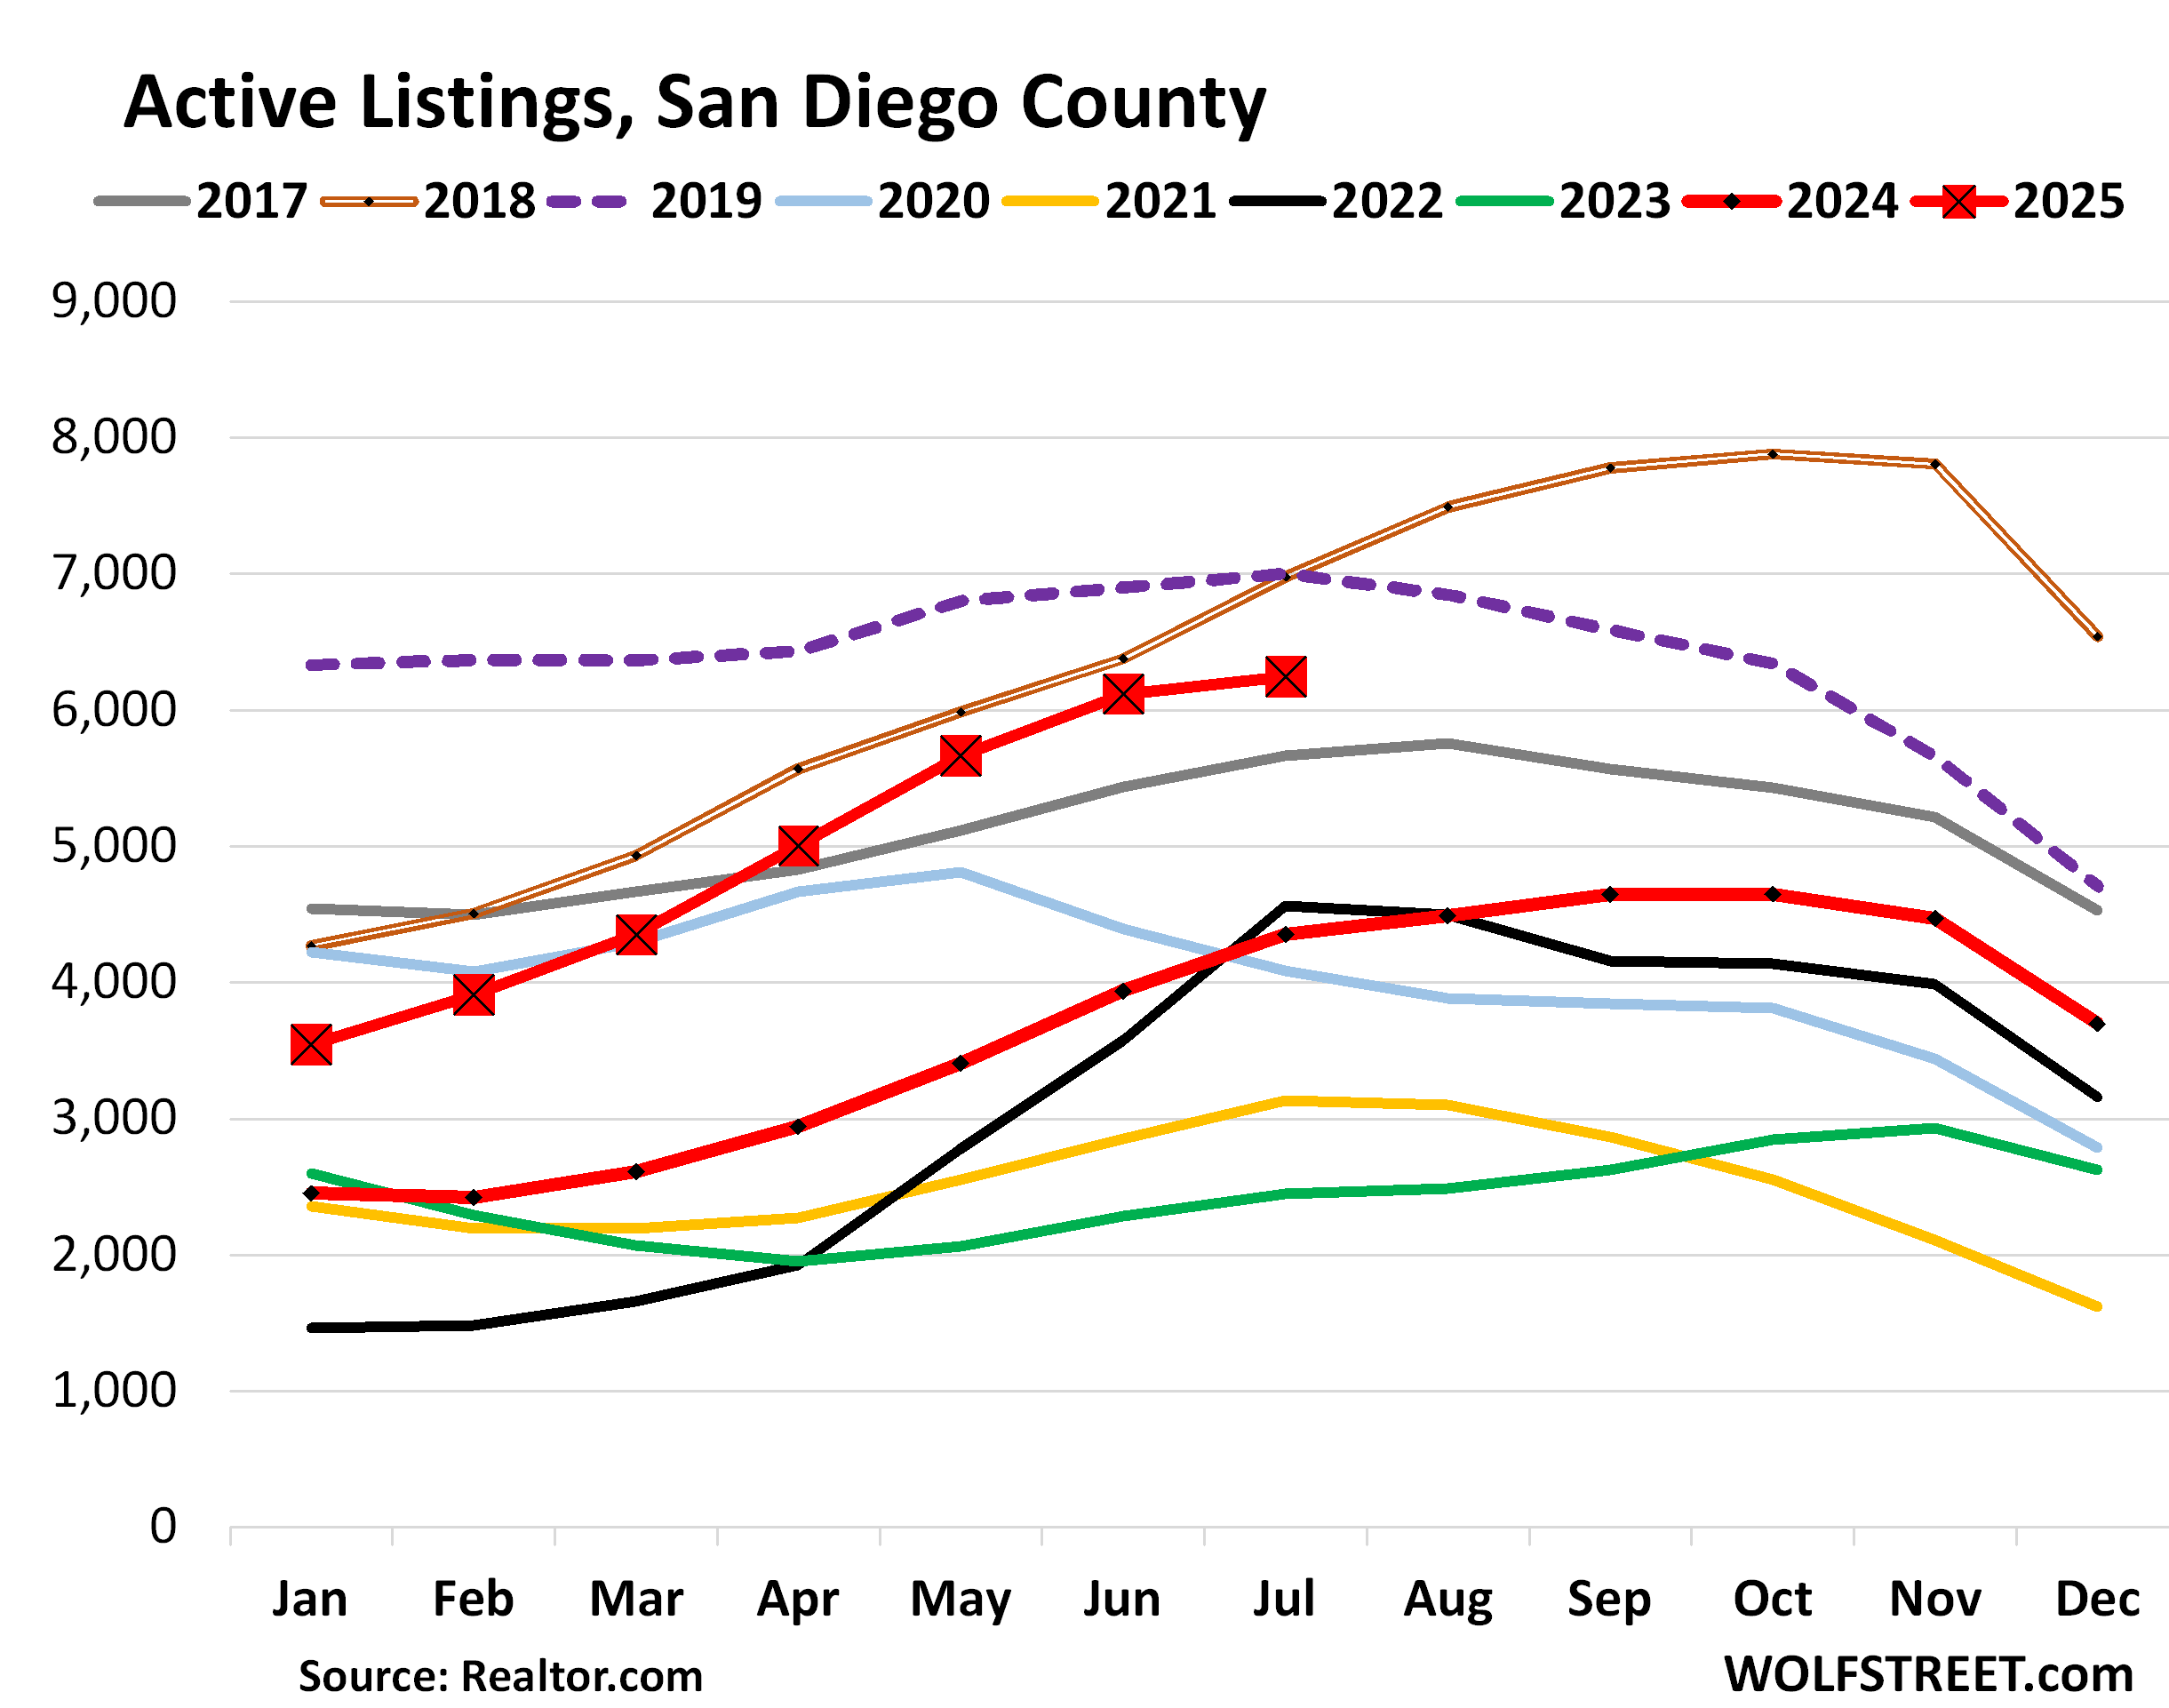
San Diego County: Active listings soared by 44% year-over-year, to 6,245 homes for sale, below only July 2018 (brown double line) and July 2019 (purple dotted line) in the data going back to 2016.
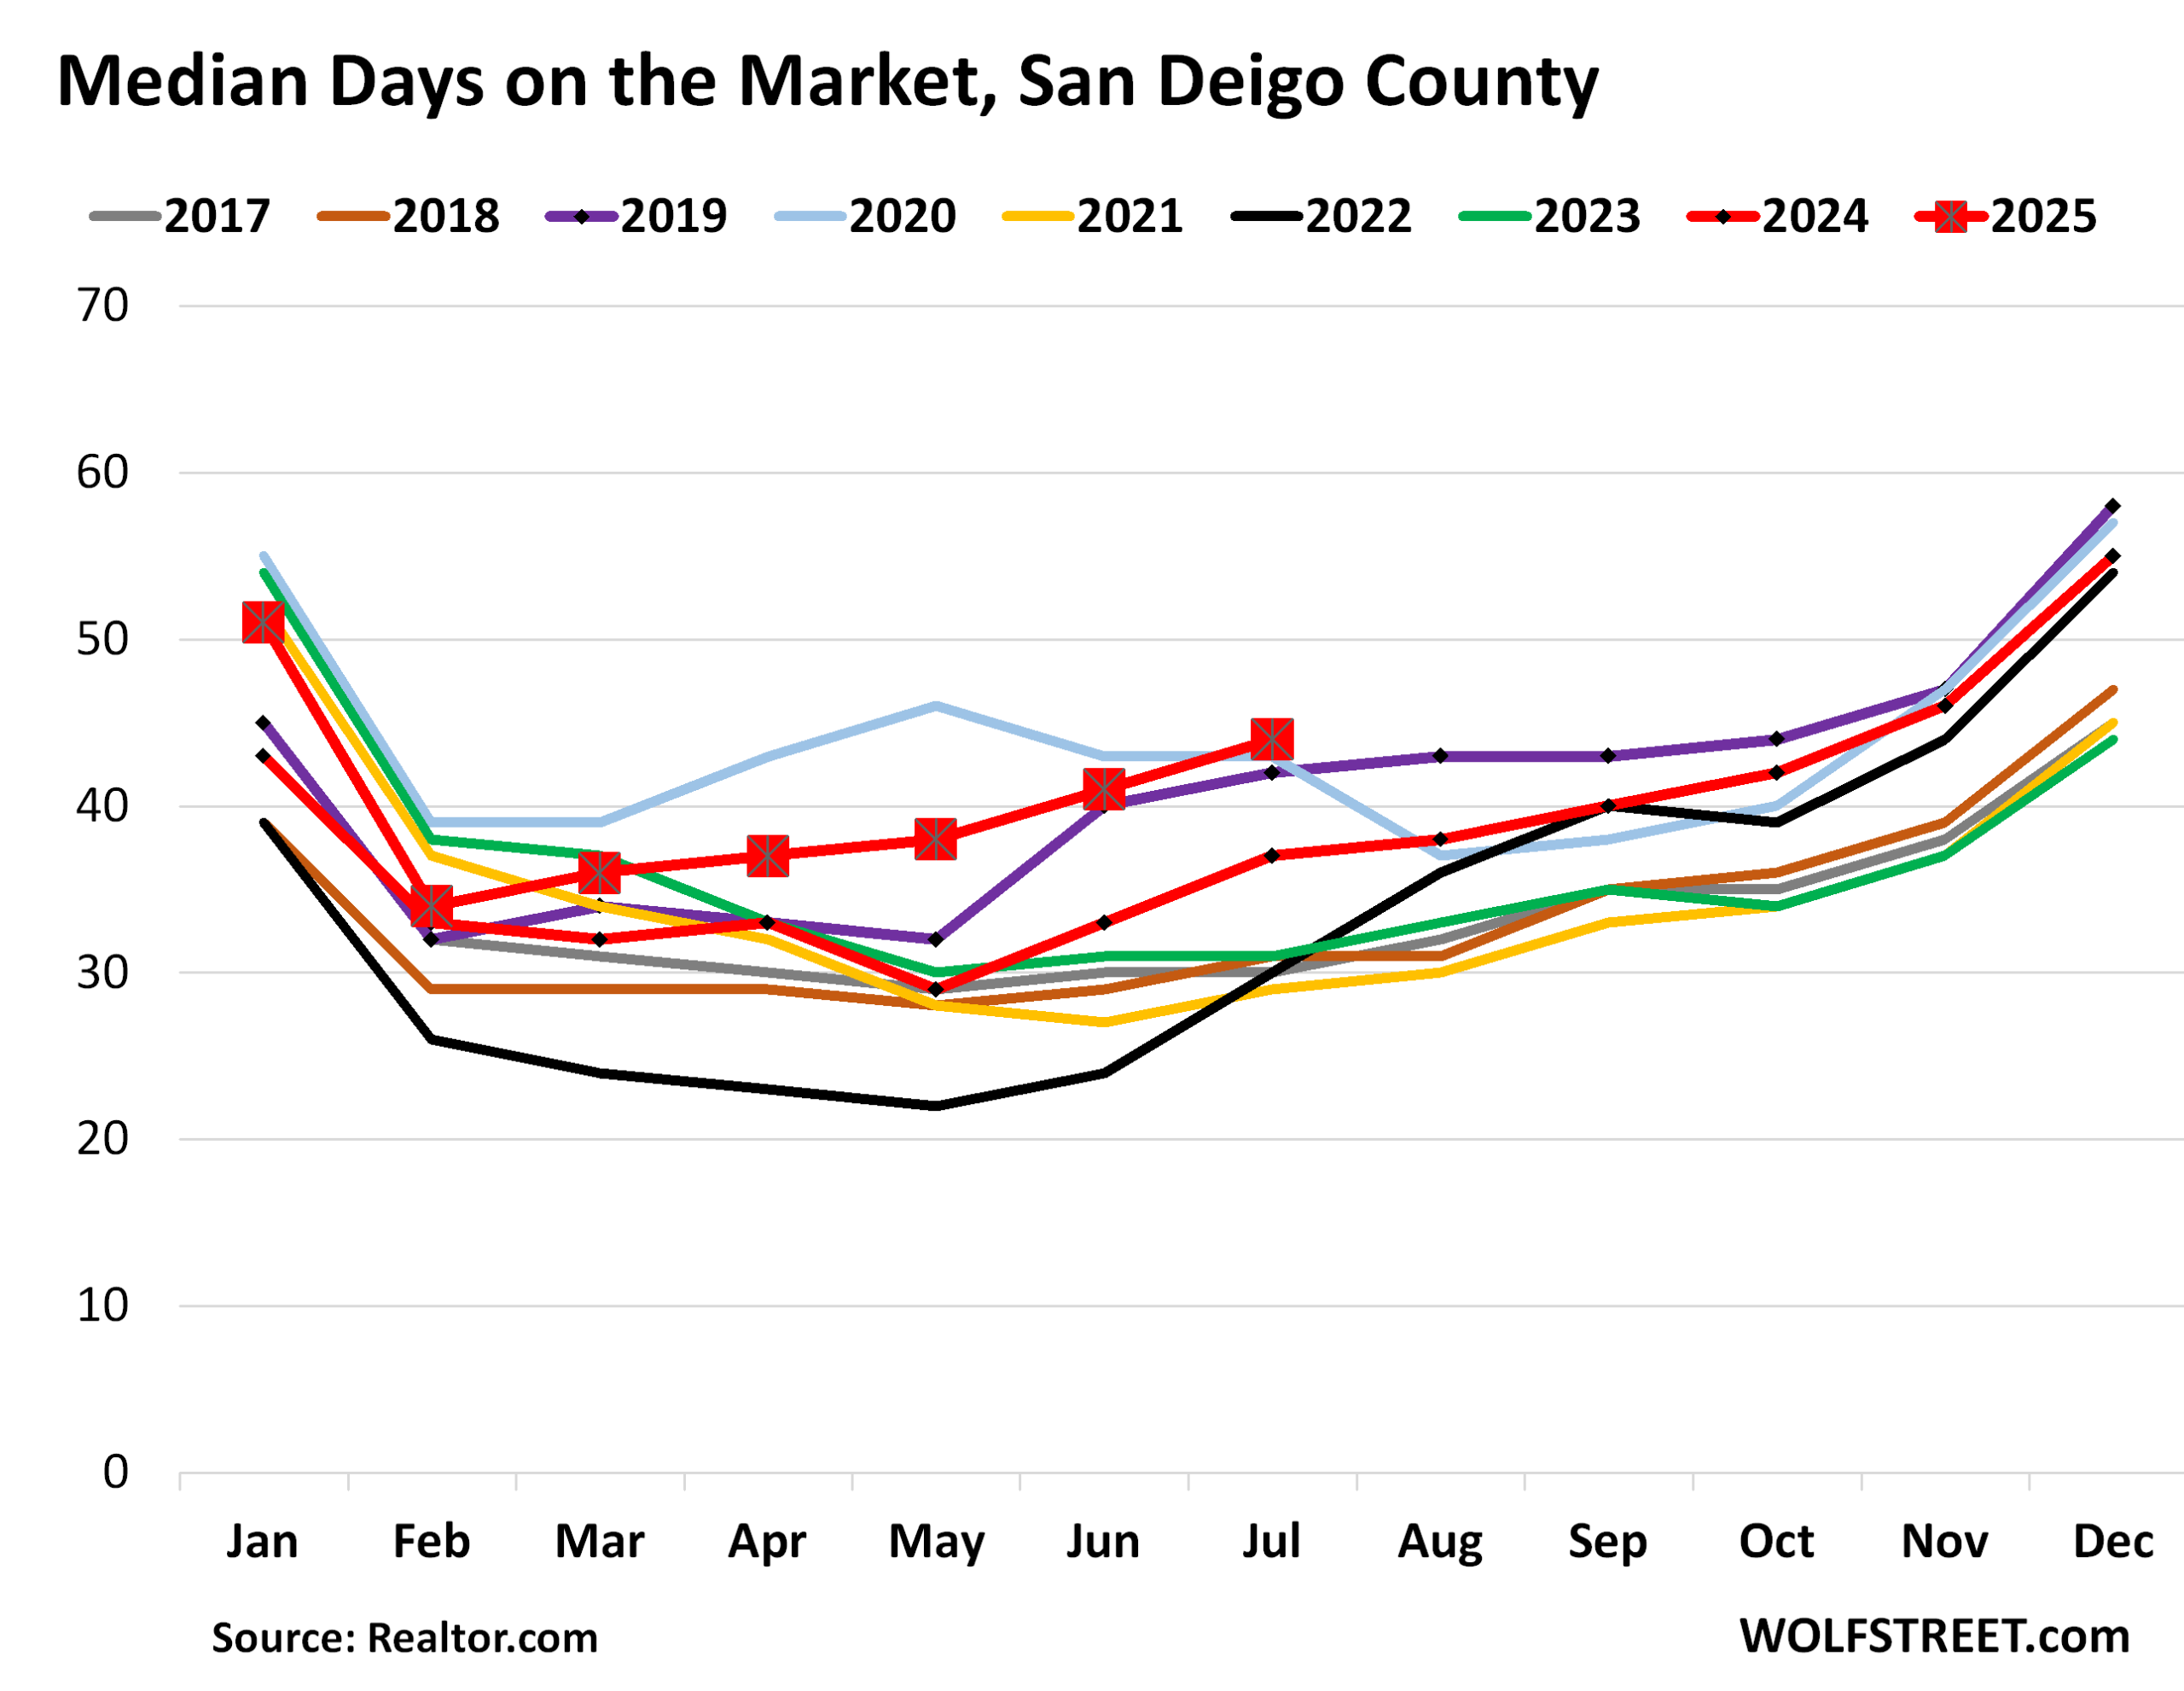
The median number of days that a home spent on the market in San Diego County before it was either pulled off the market or sold rose to 44 days, up from 37 days a year ago, and the highest for any July in the data.
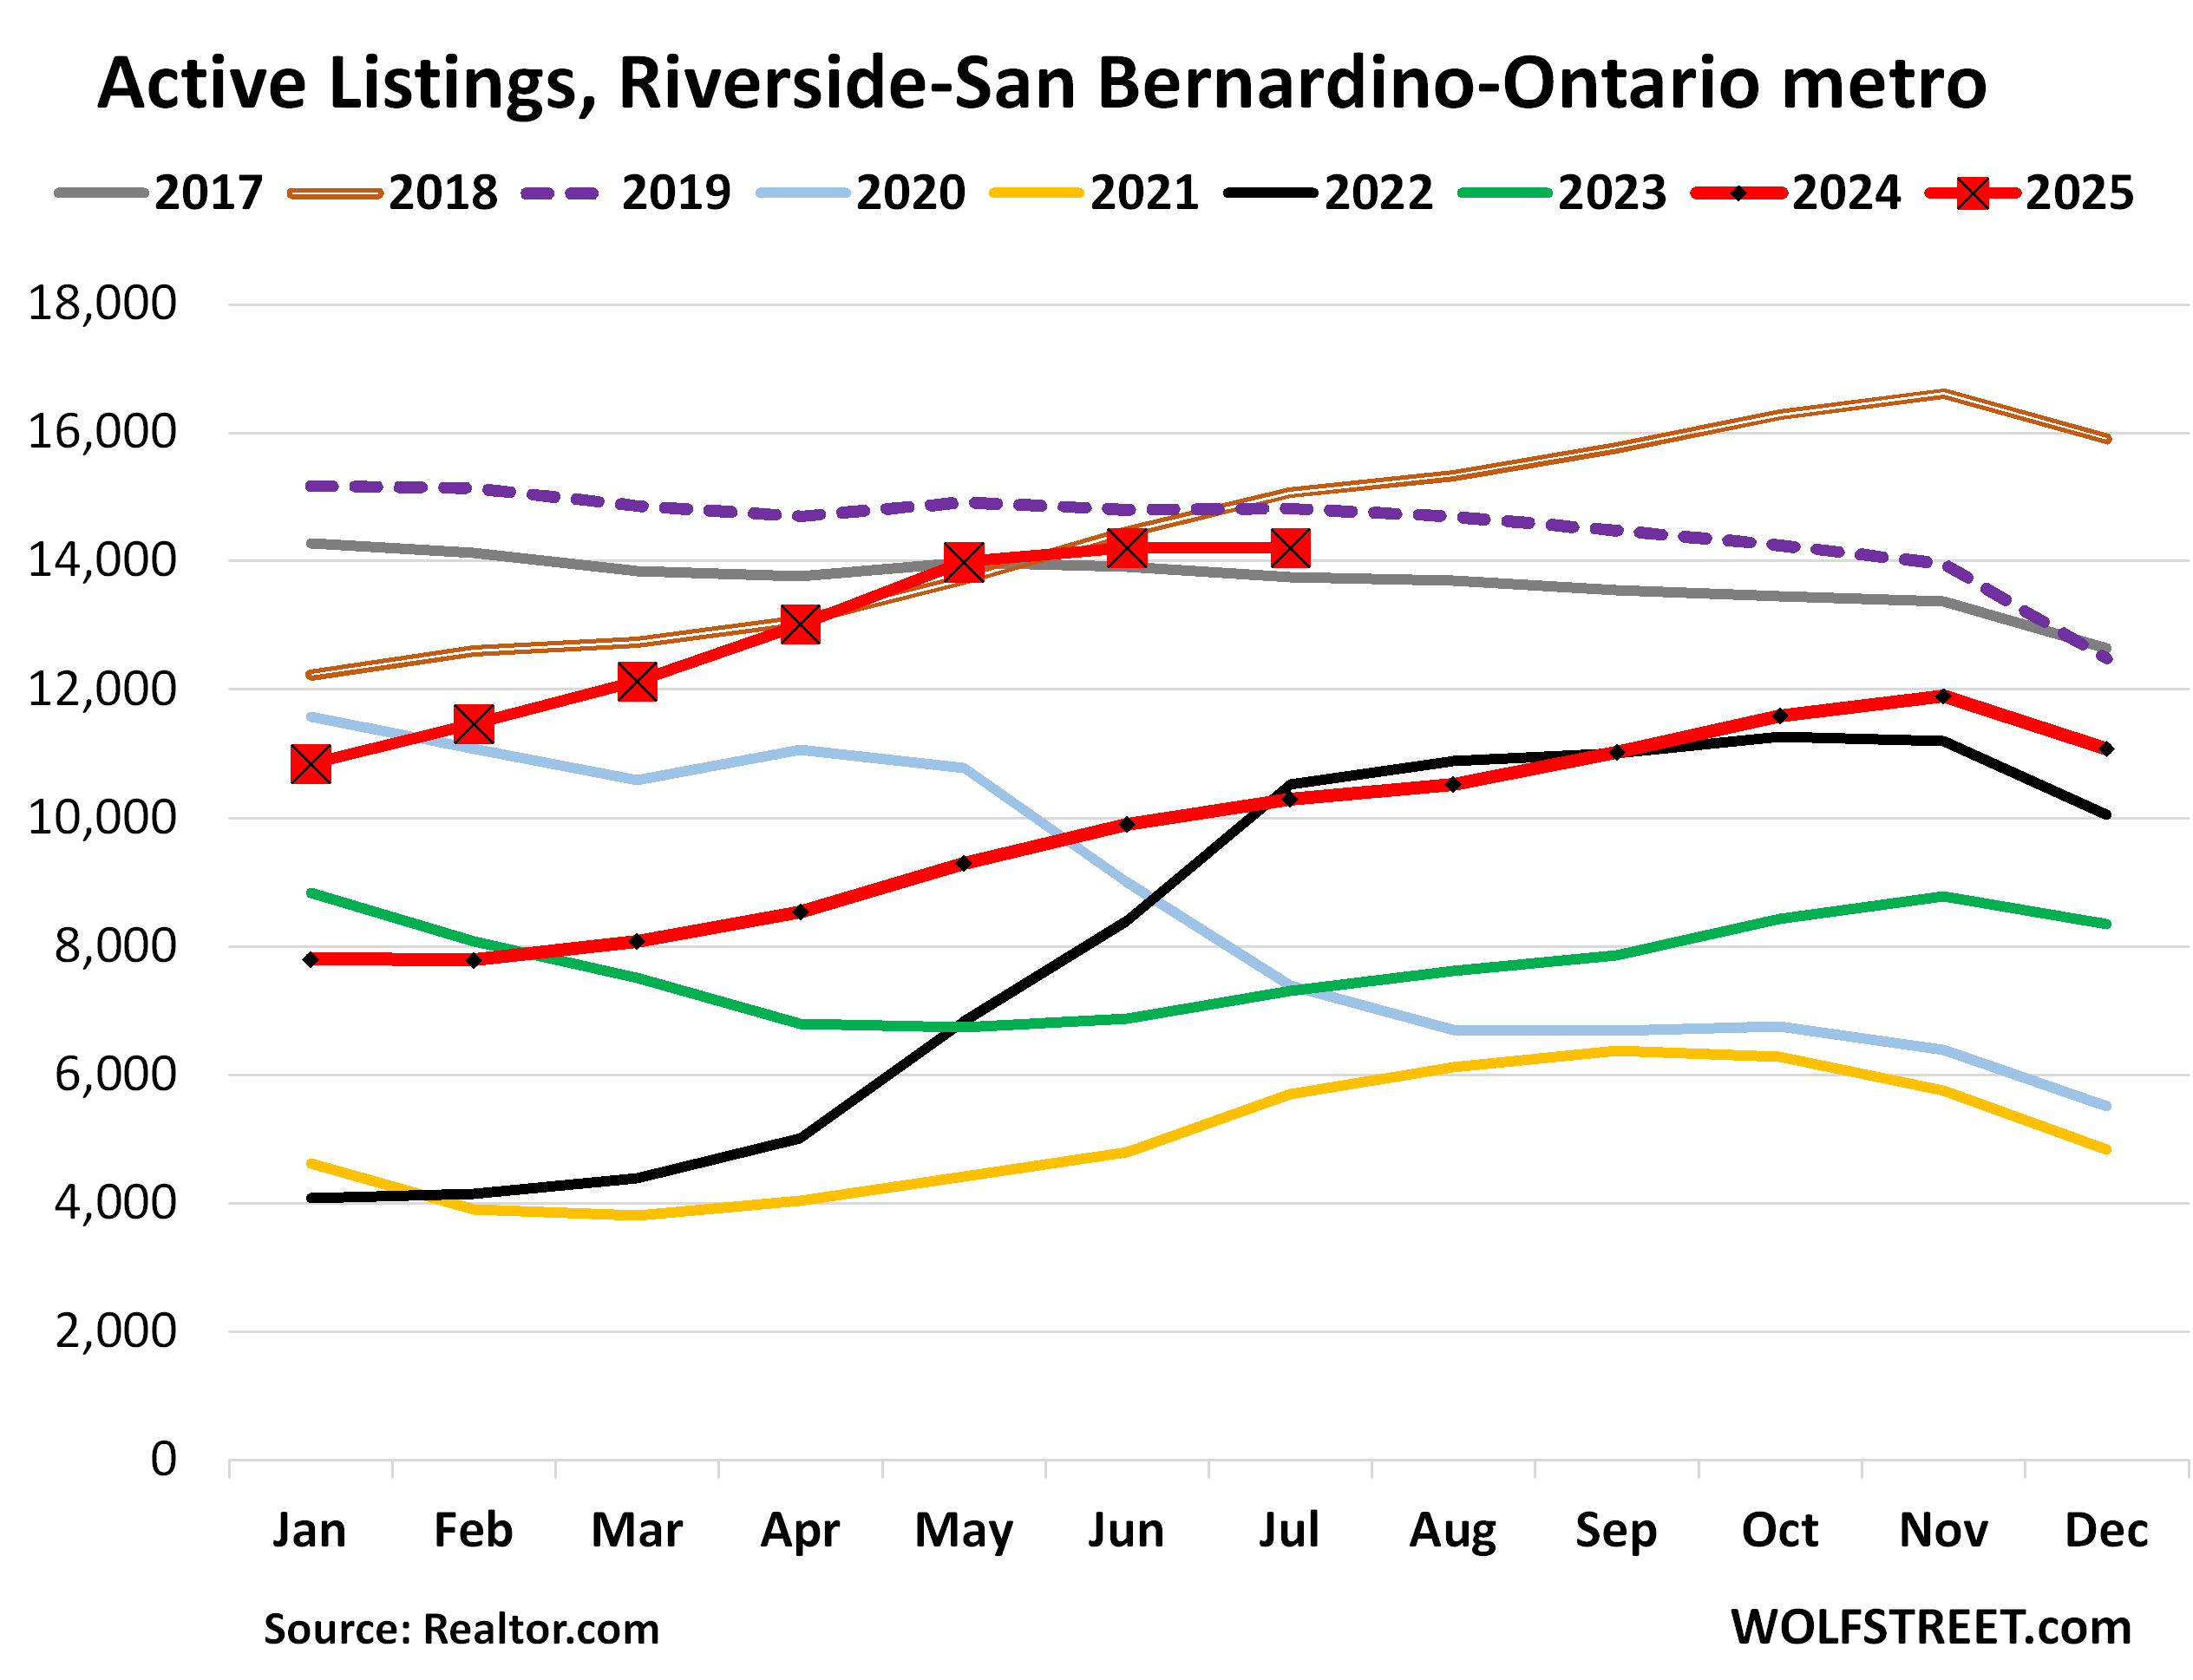
Riverside-San Bernardino-Ontario metro: Active listings soared by 38% year-over-year, to 14,206 homes, just a tad below the Julys of 2018 and 2019.
In terms of delistings, the metro was the third-highest in the US, with 30 delistings for each 100 new listings, according to Realtor.com today.
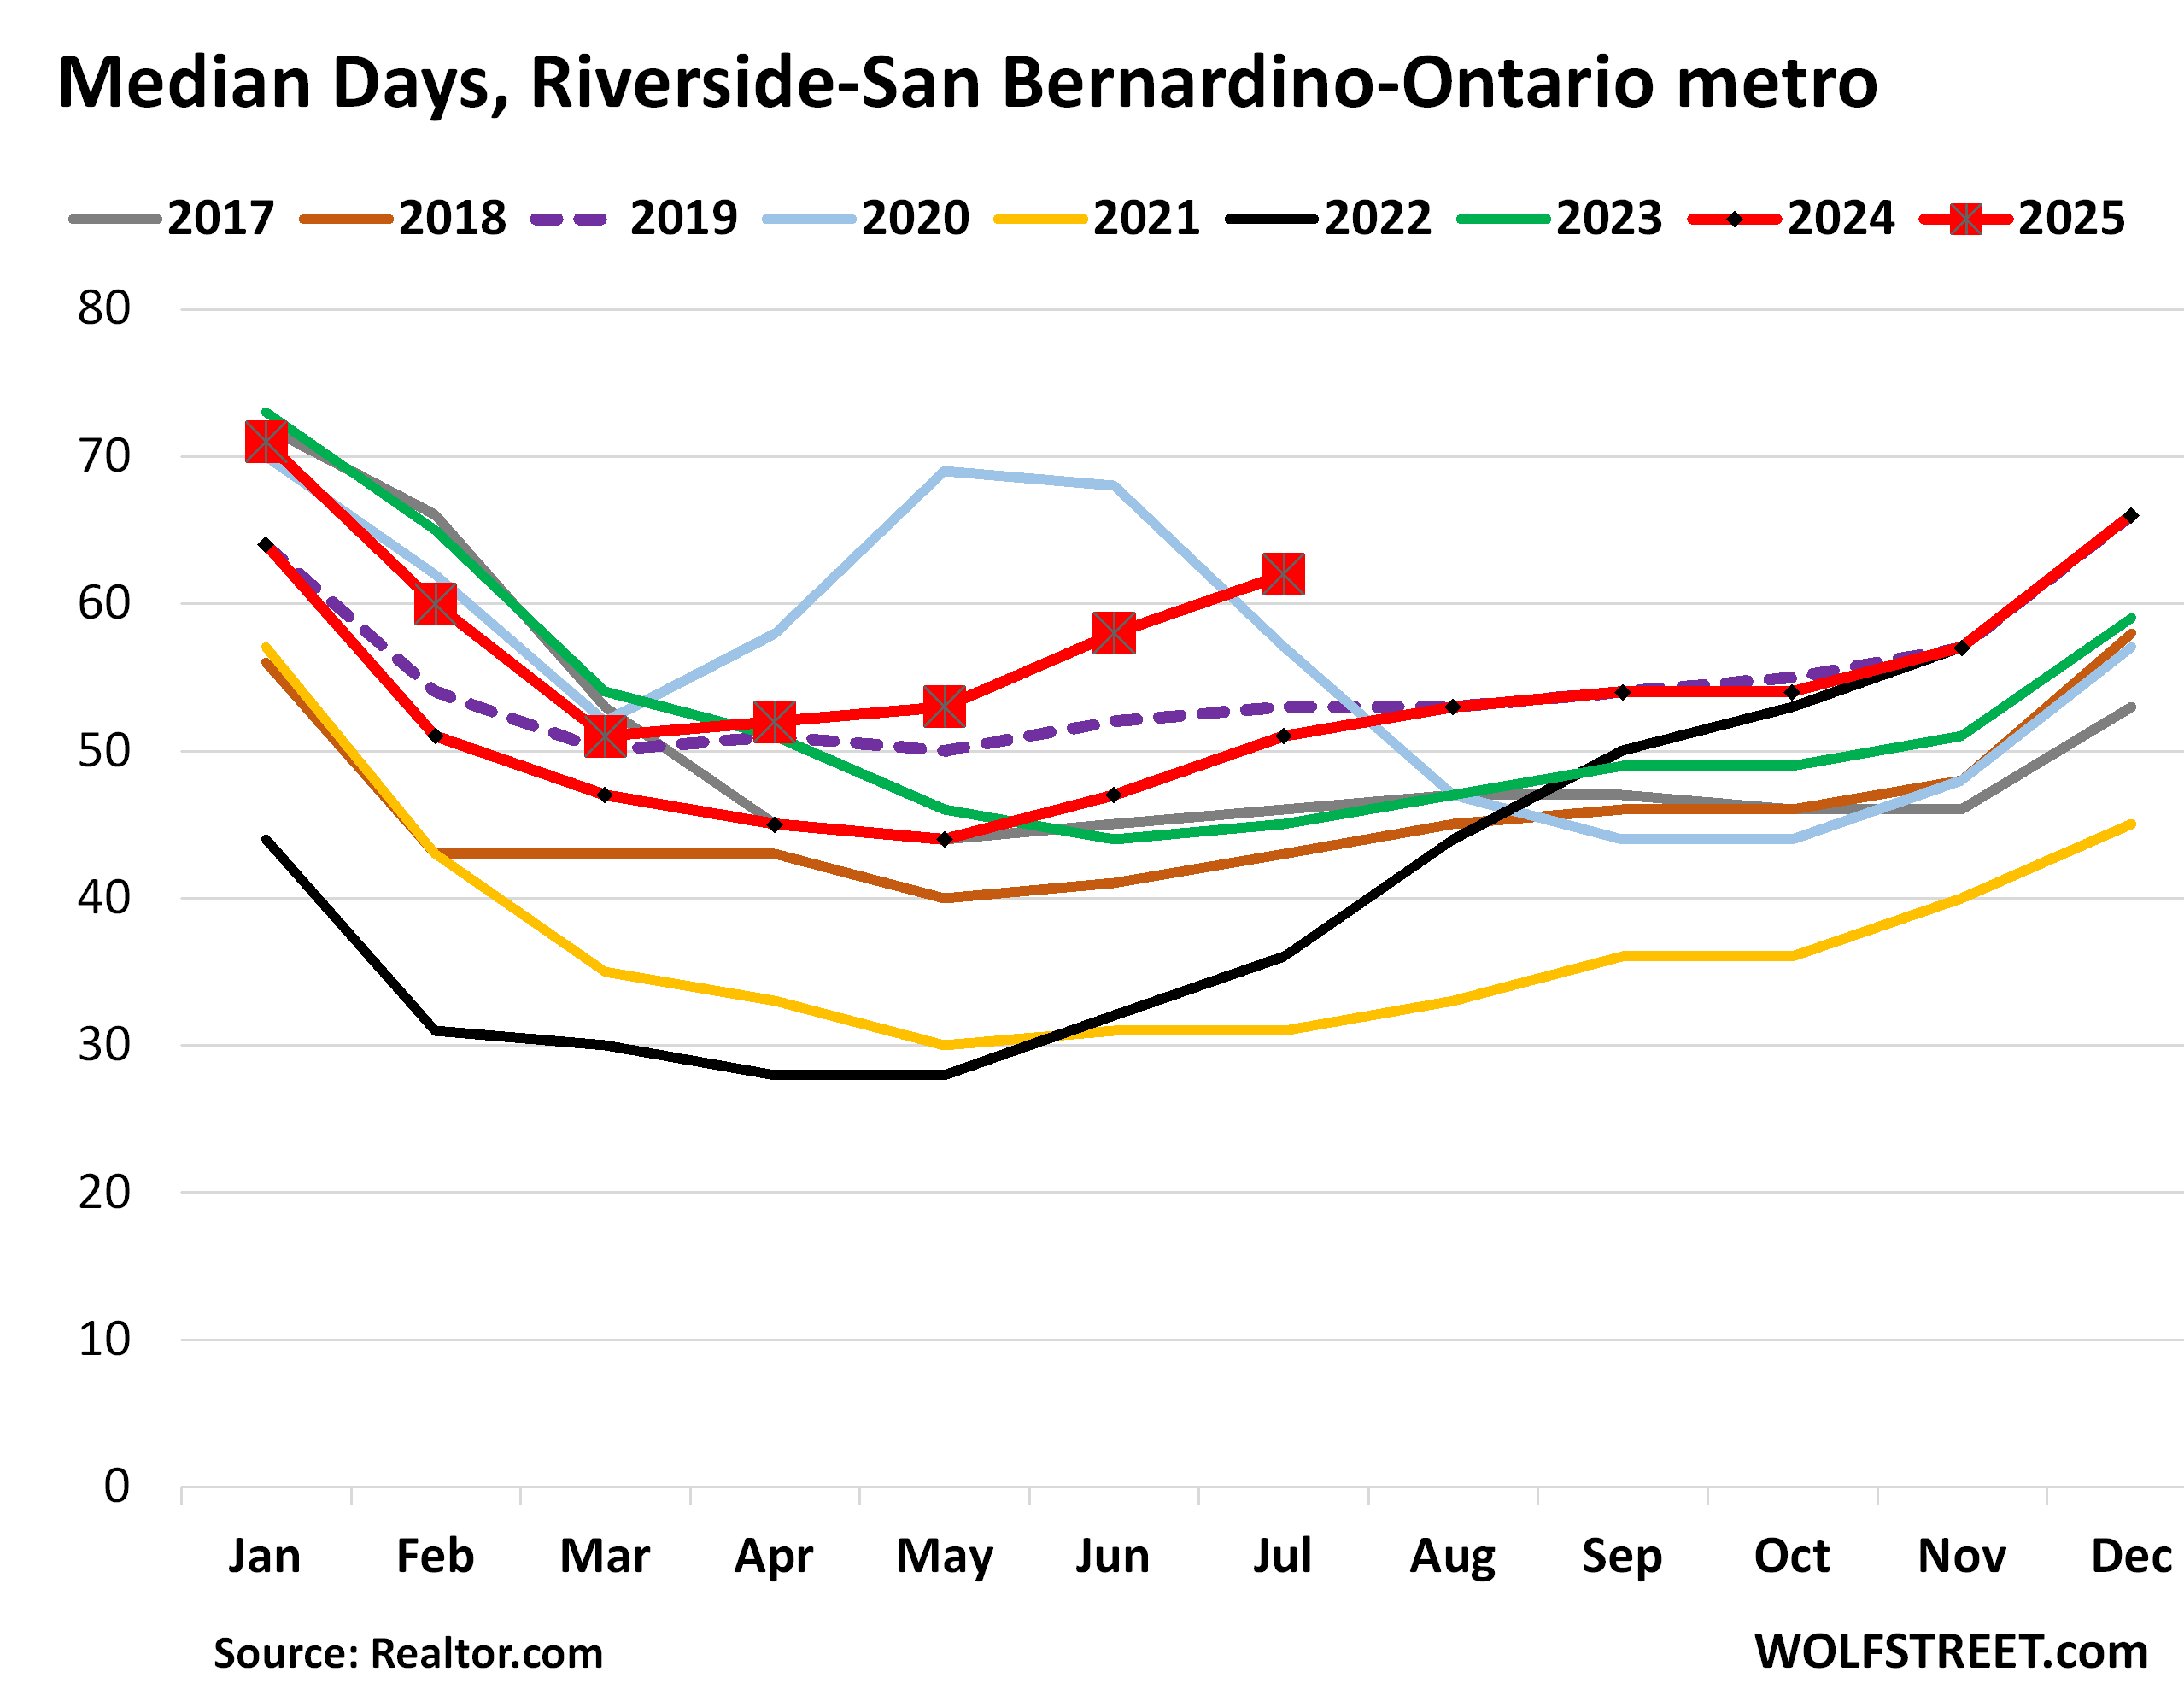
Median days on the market soared to 62 days, the highest July in the data from Realtor.com, which goes back to 2016, up from 51 days a year ago, and up from 53 and 43 days in 2019 and 2018.
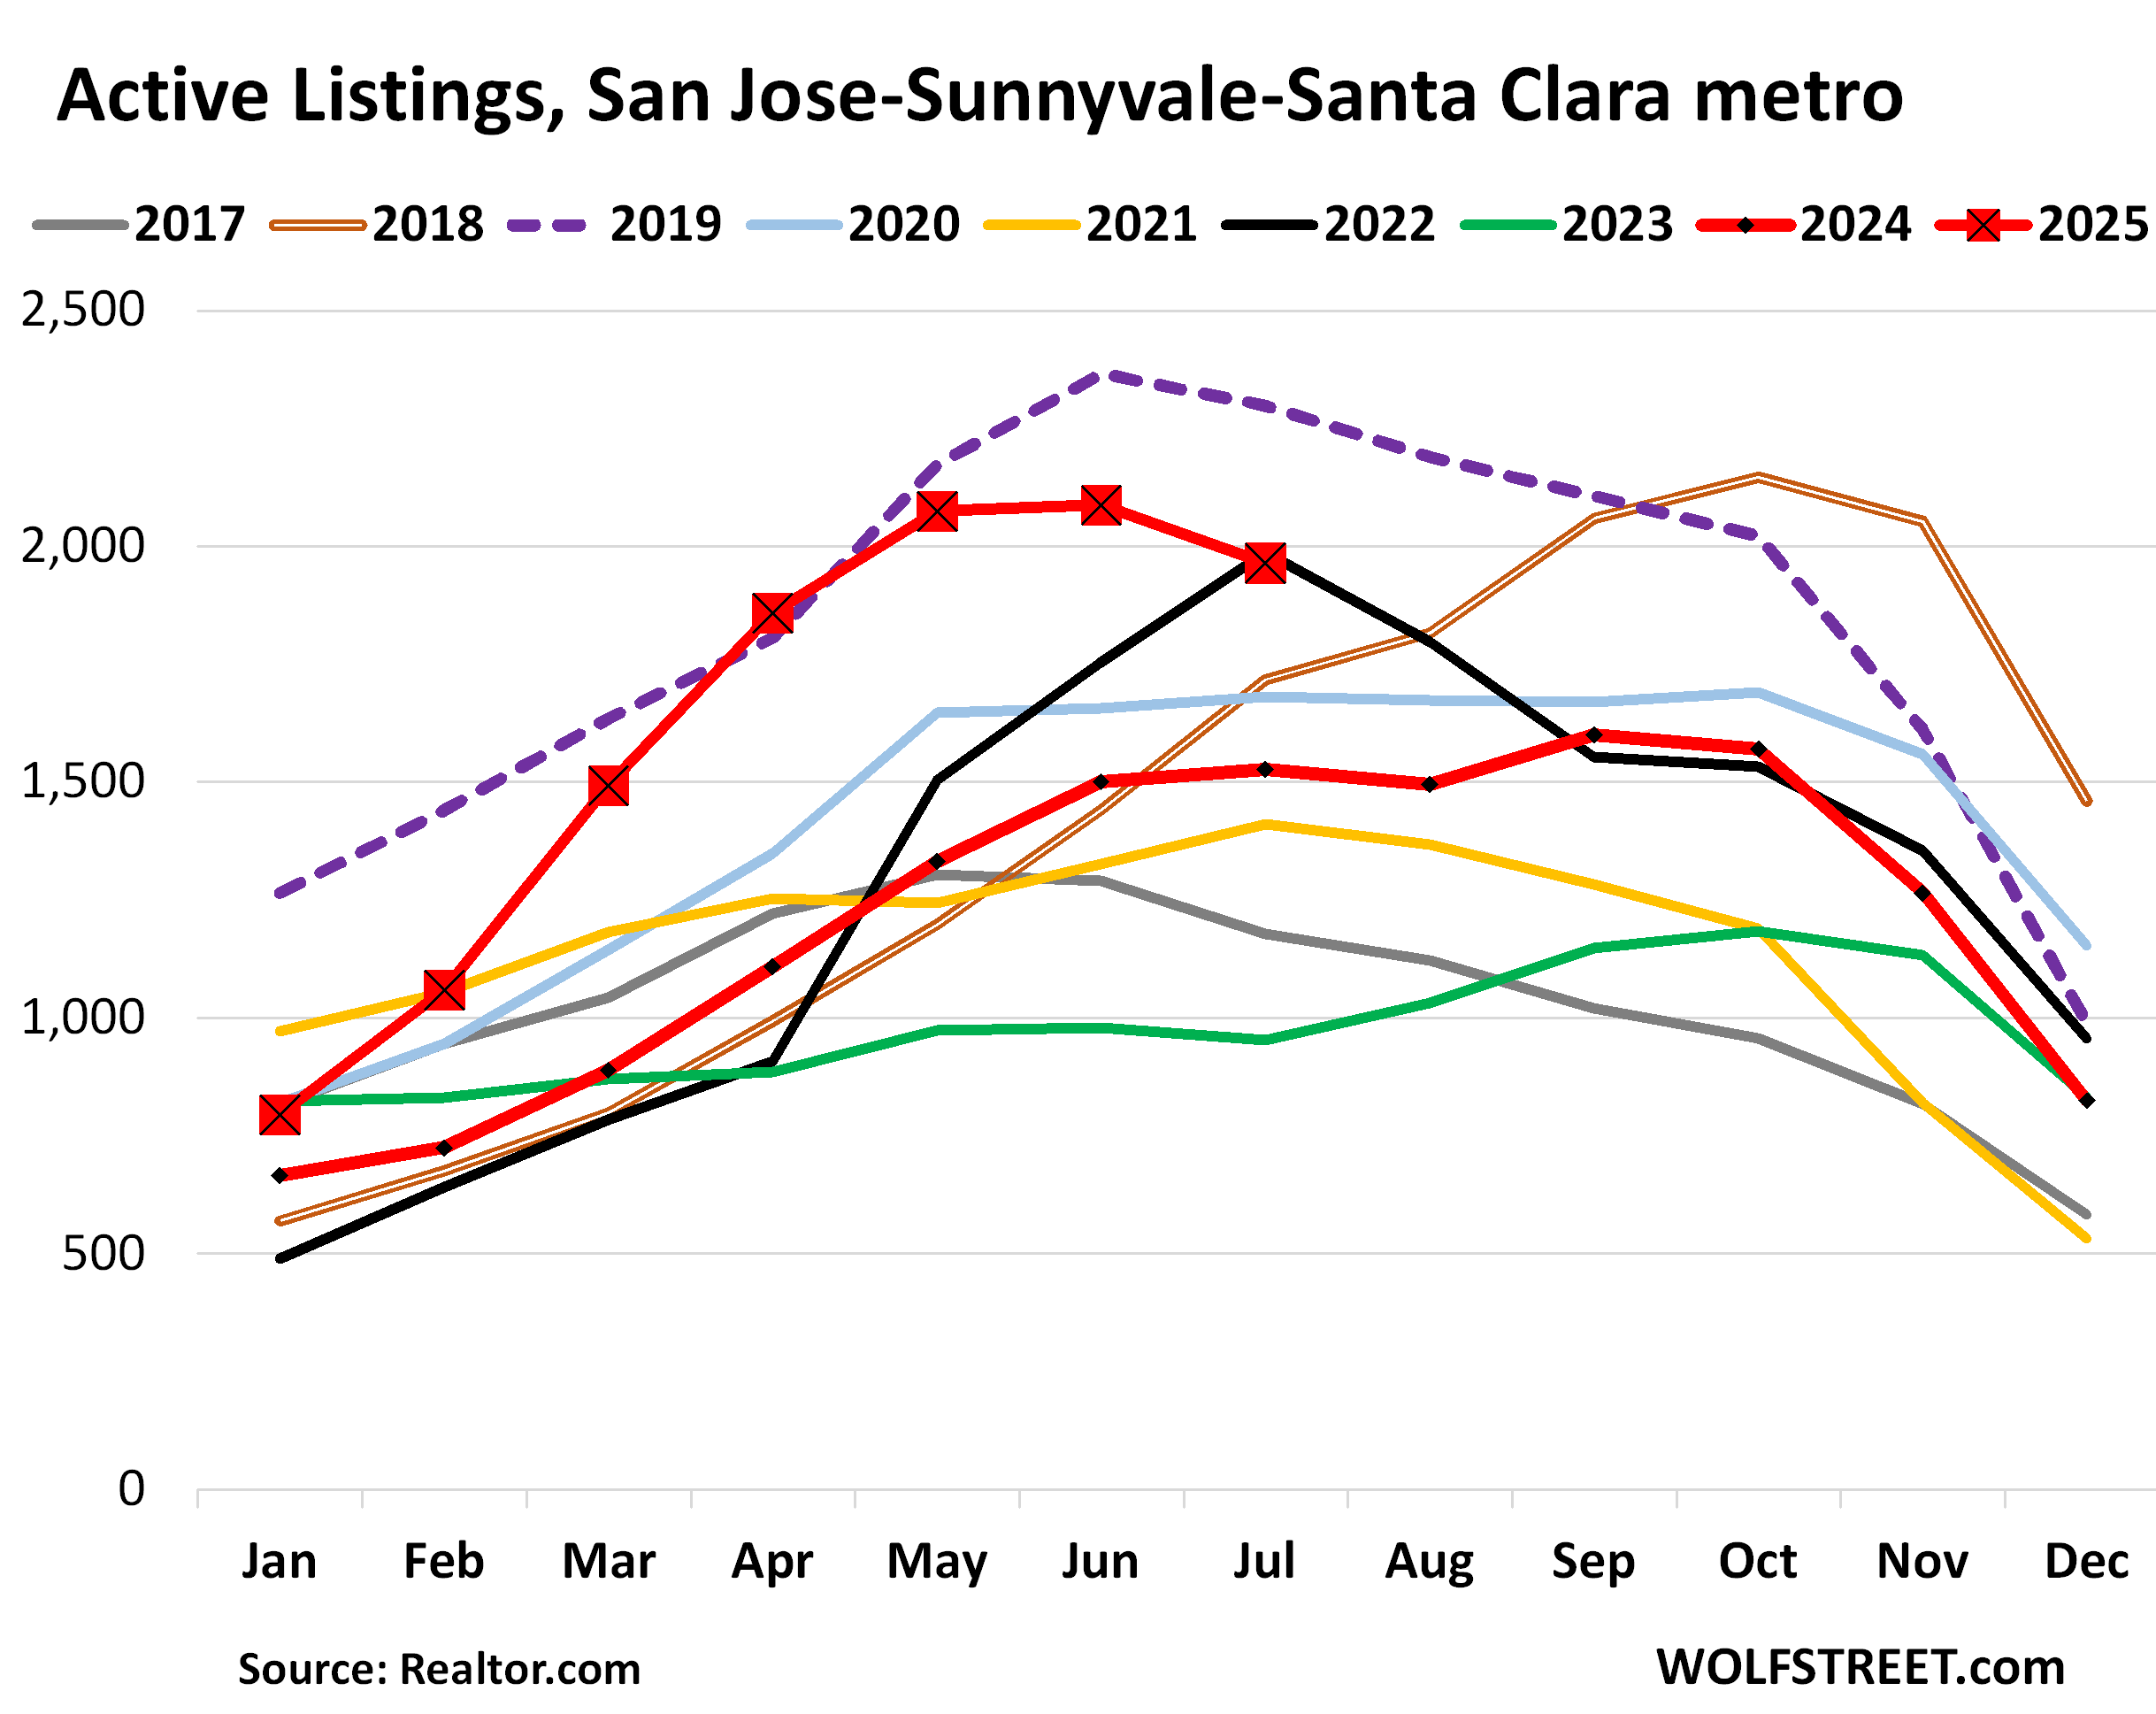
San Jose-Sunnyvale-Santa Clara metro: Active listings rose by 29% year-over-year in July, to 1,964 homes for sale, roughly matching July 2022 (black line), and 17% below the #1, July 2019 (dotted purple line).
The MSA includes Santa Clara County (San Jose and the southern part of Silicon Valley) and San Benito County, which extends south into rural areas.
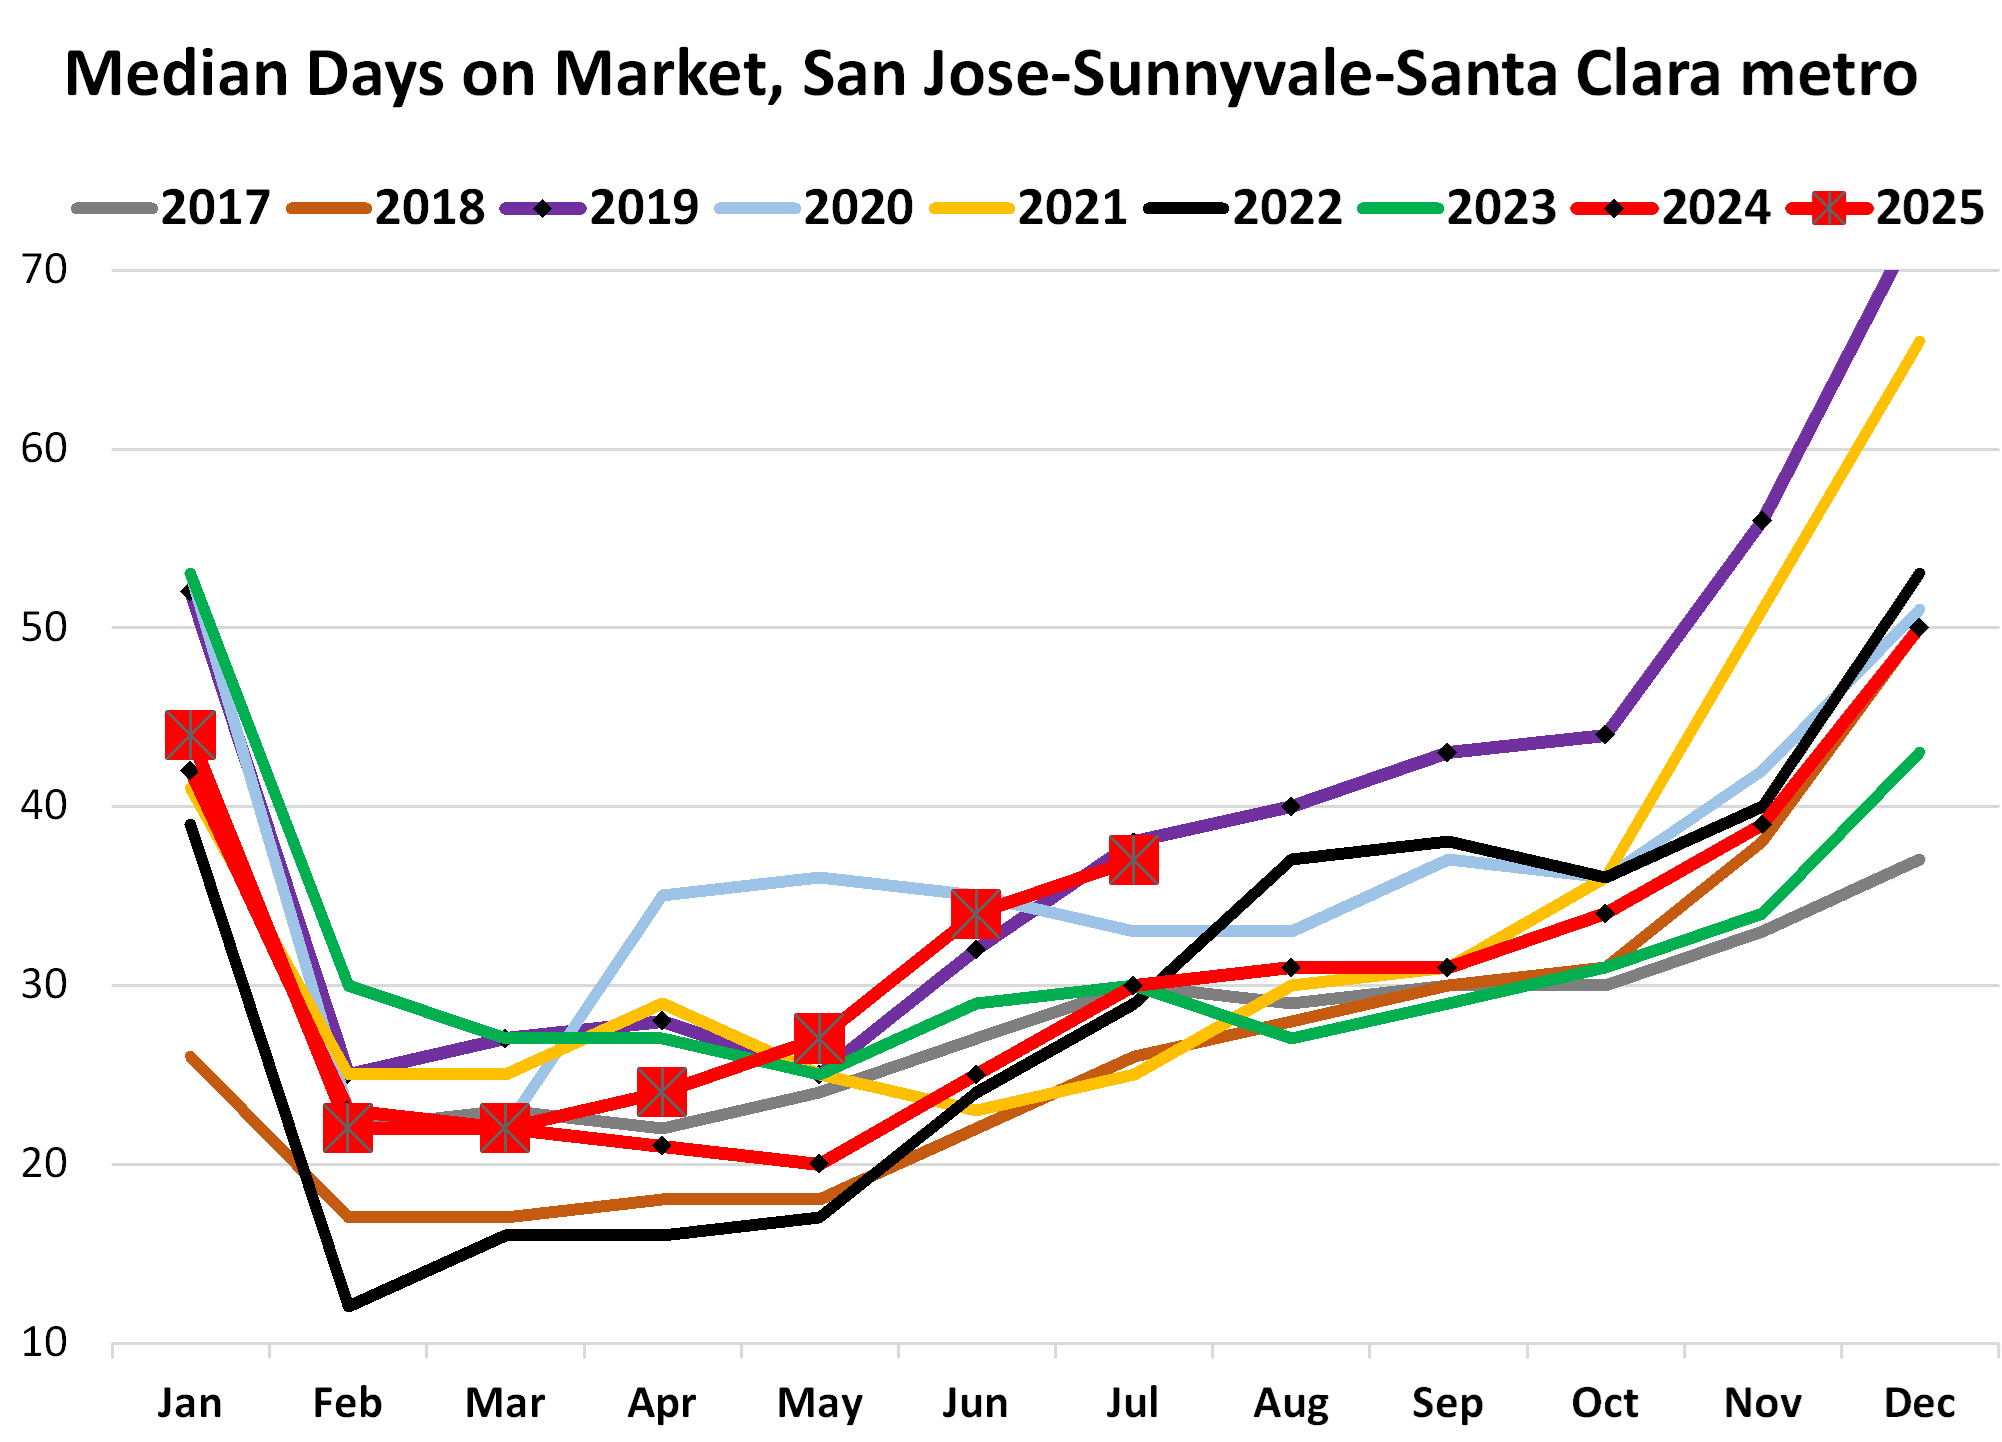
Median days on the market rose to 37 days in July, up from 30 days a year ago, and the second-highest July behind 2019 (38 days, purple), in the data going back to 2016.
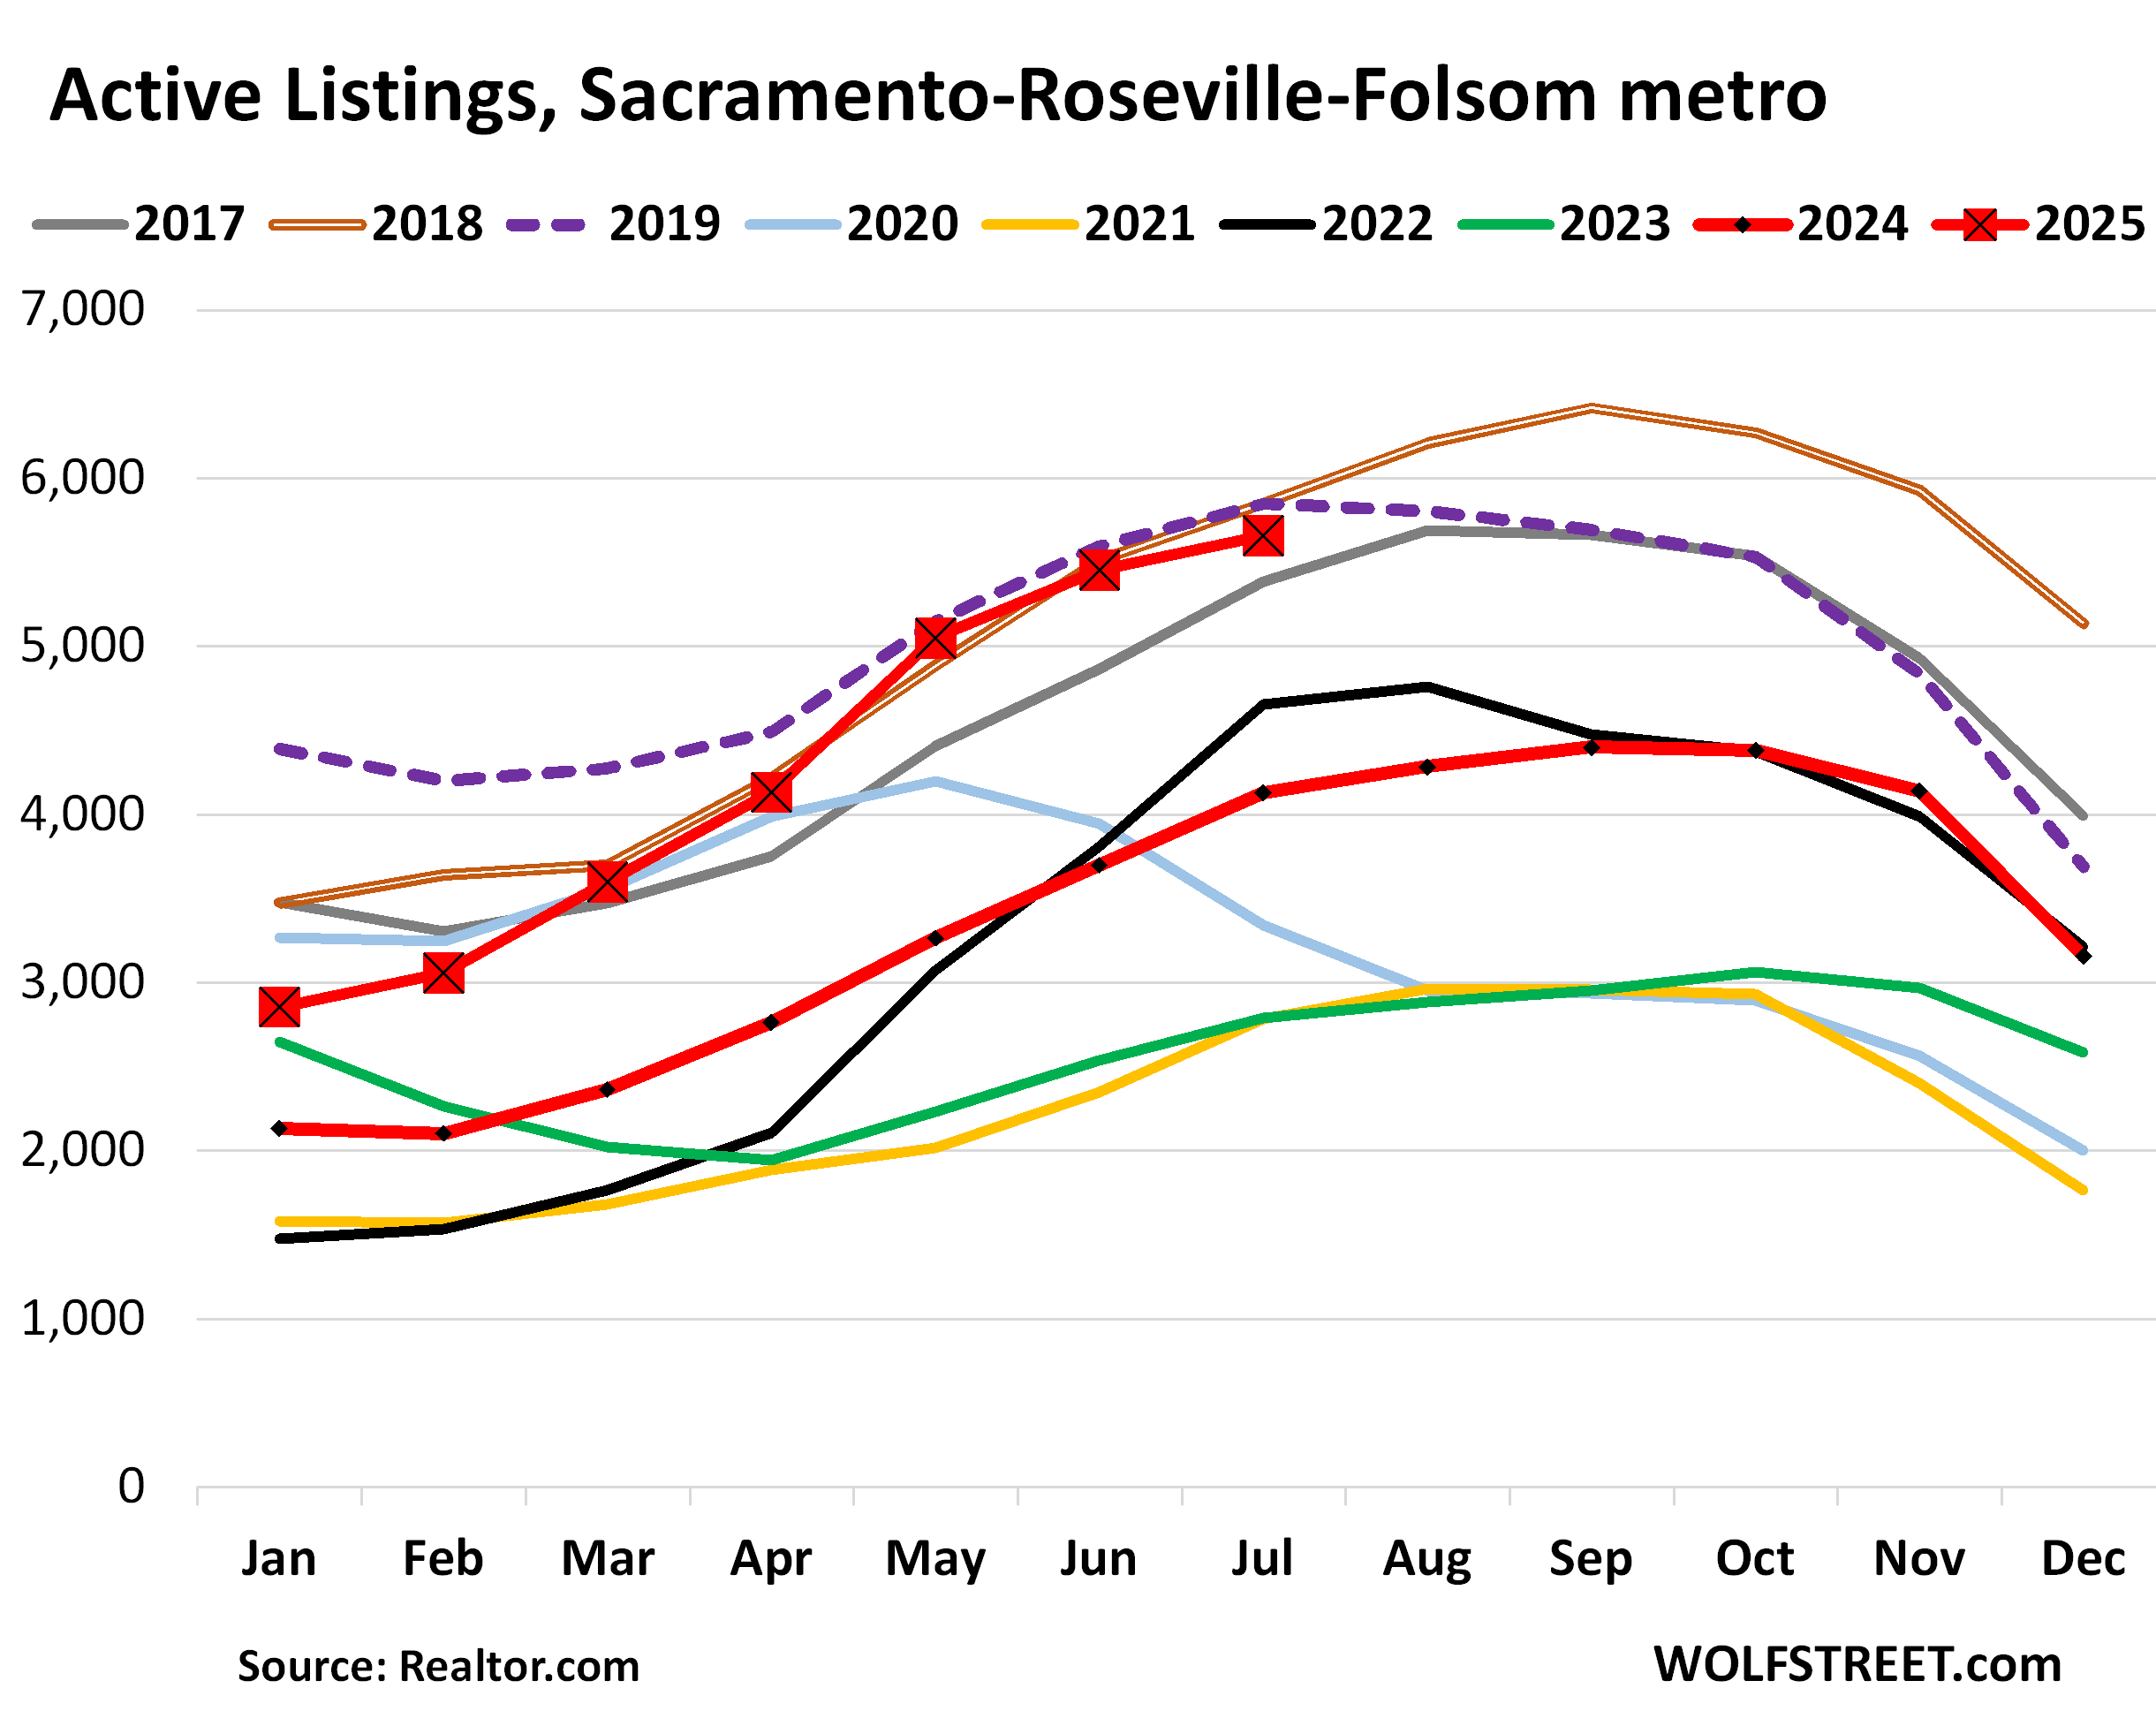
Sacramento-Roseville-Folsom metro: Active listings rose by 37% year-over-year to 5,658 homes for sale, just a little below the Julys of 2018 and 2019.
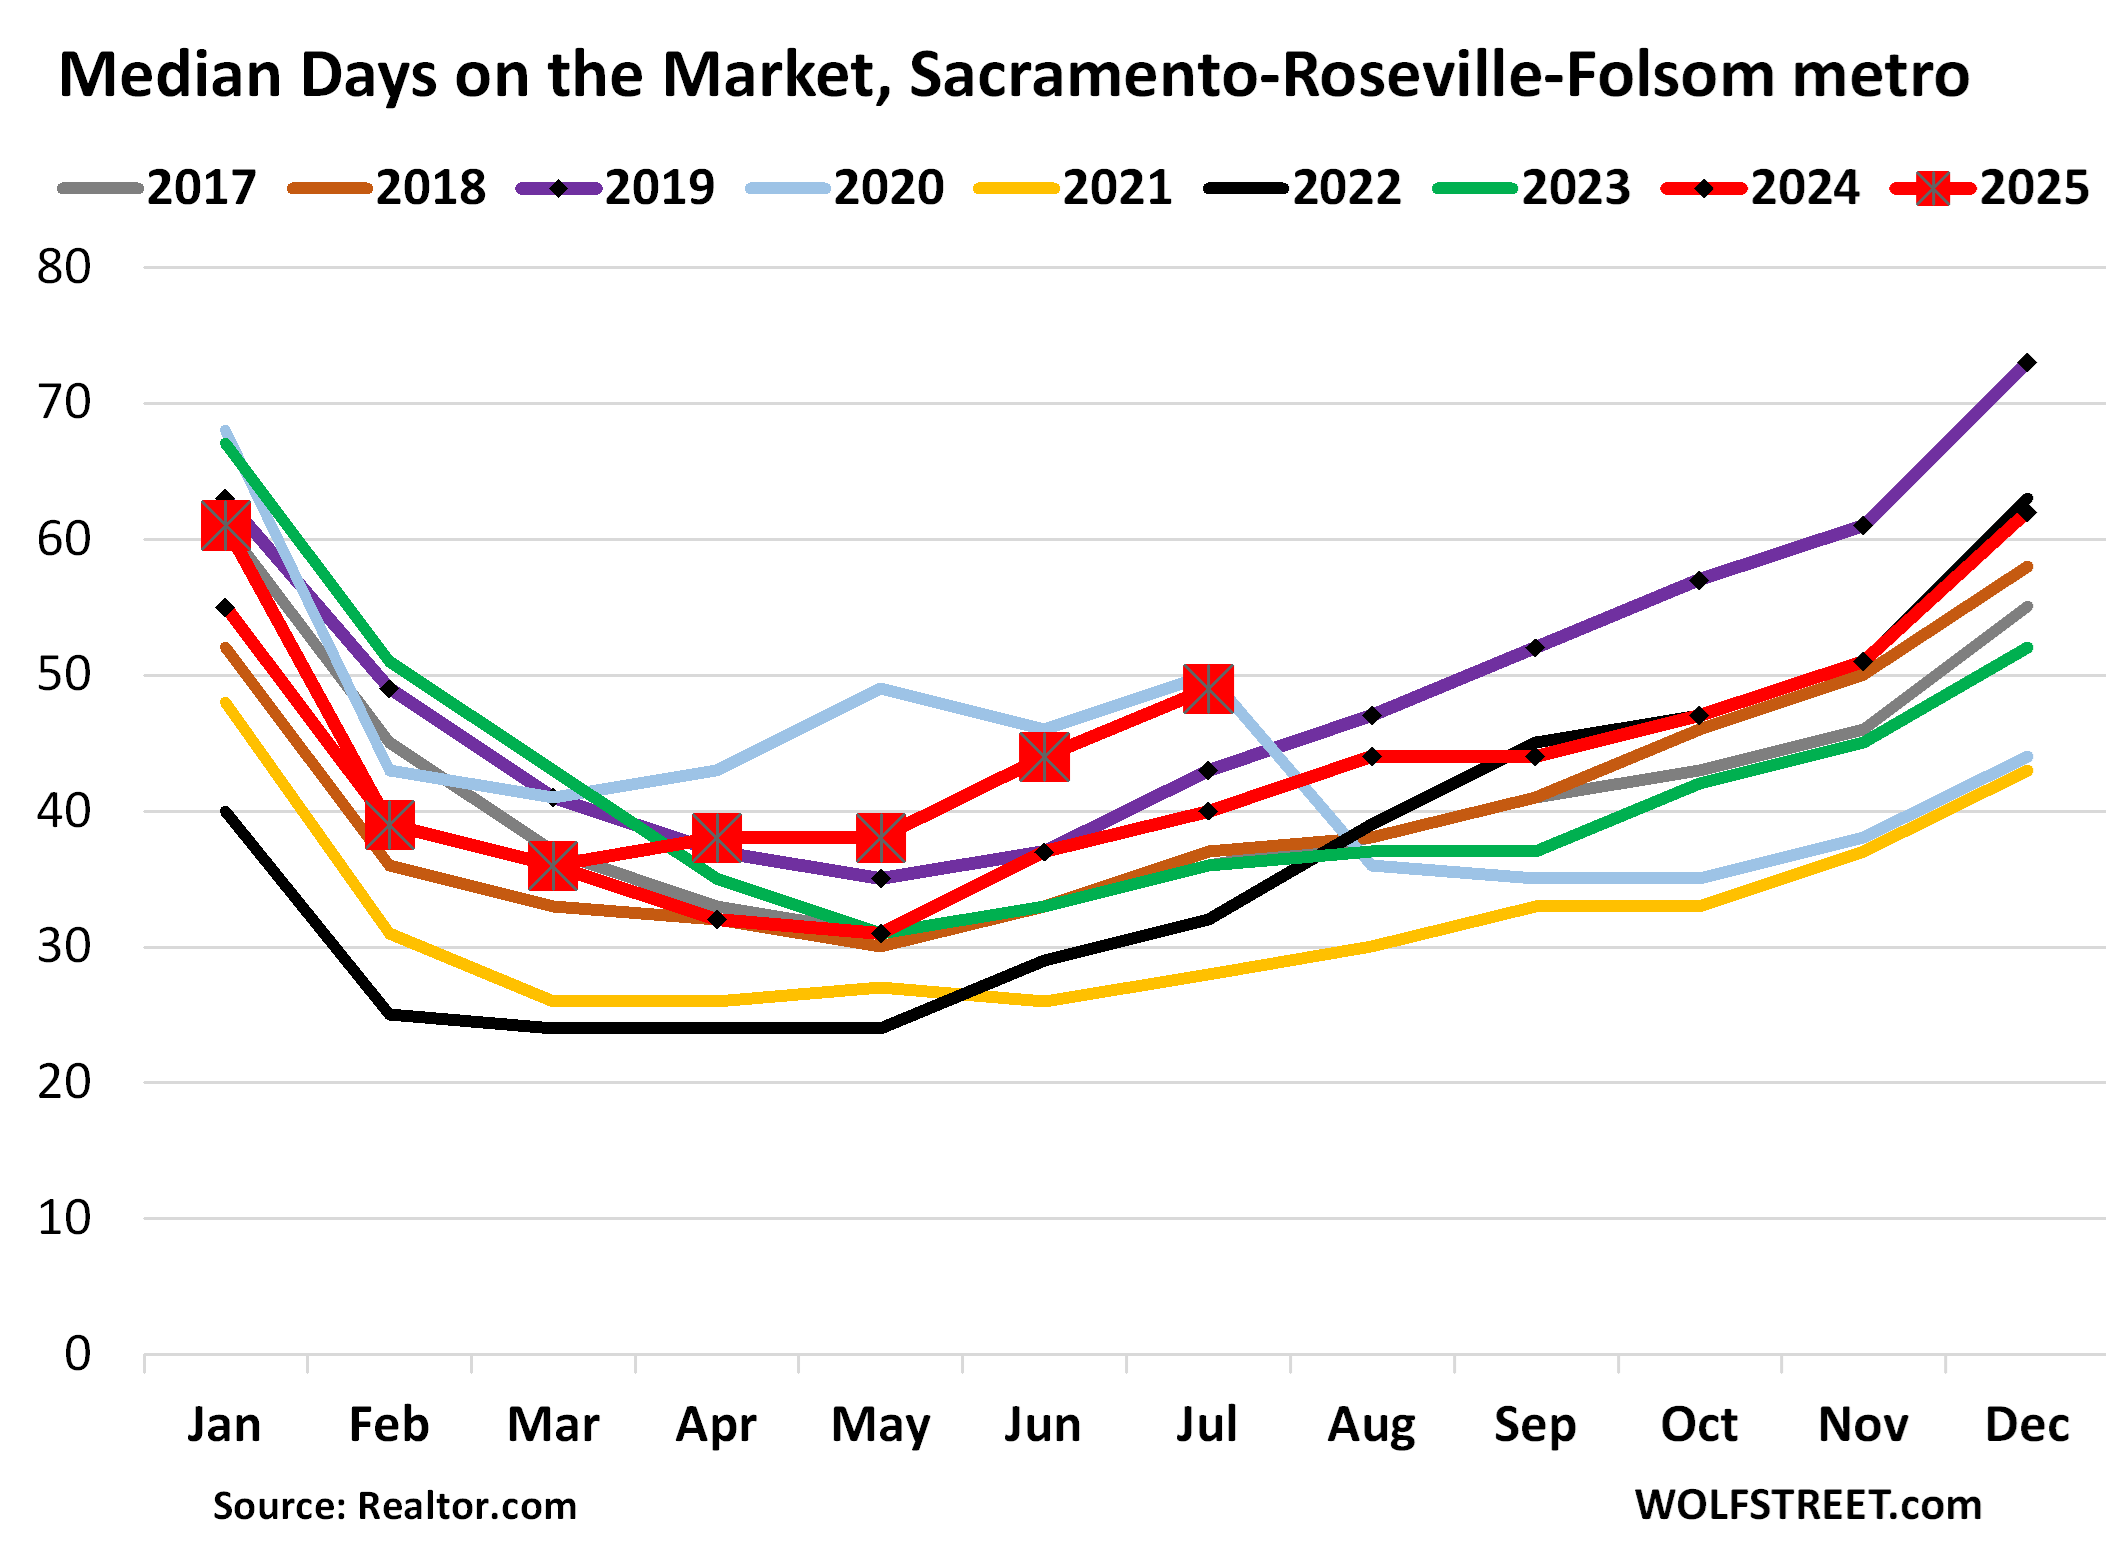
Median days on the market soared to 49 days, the most for any July in the data except lockdown July 2020, and up from 40 days a year ago.
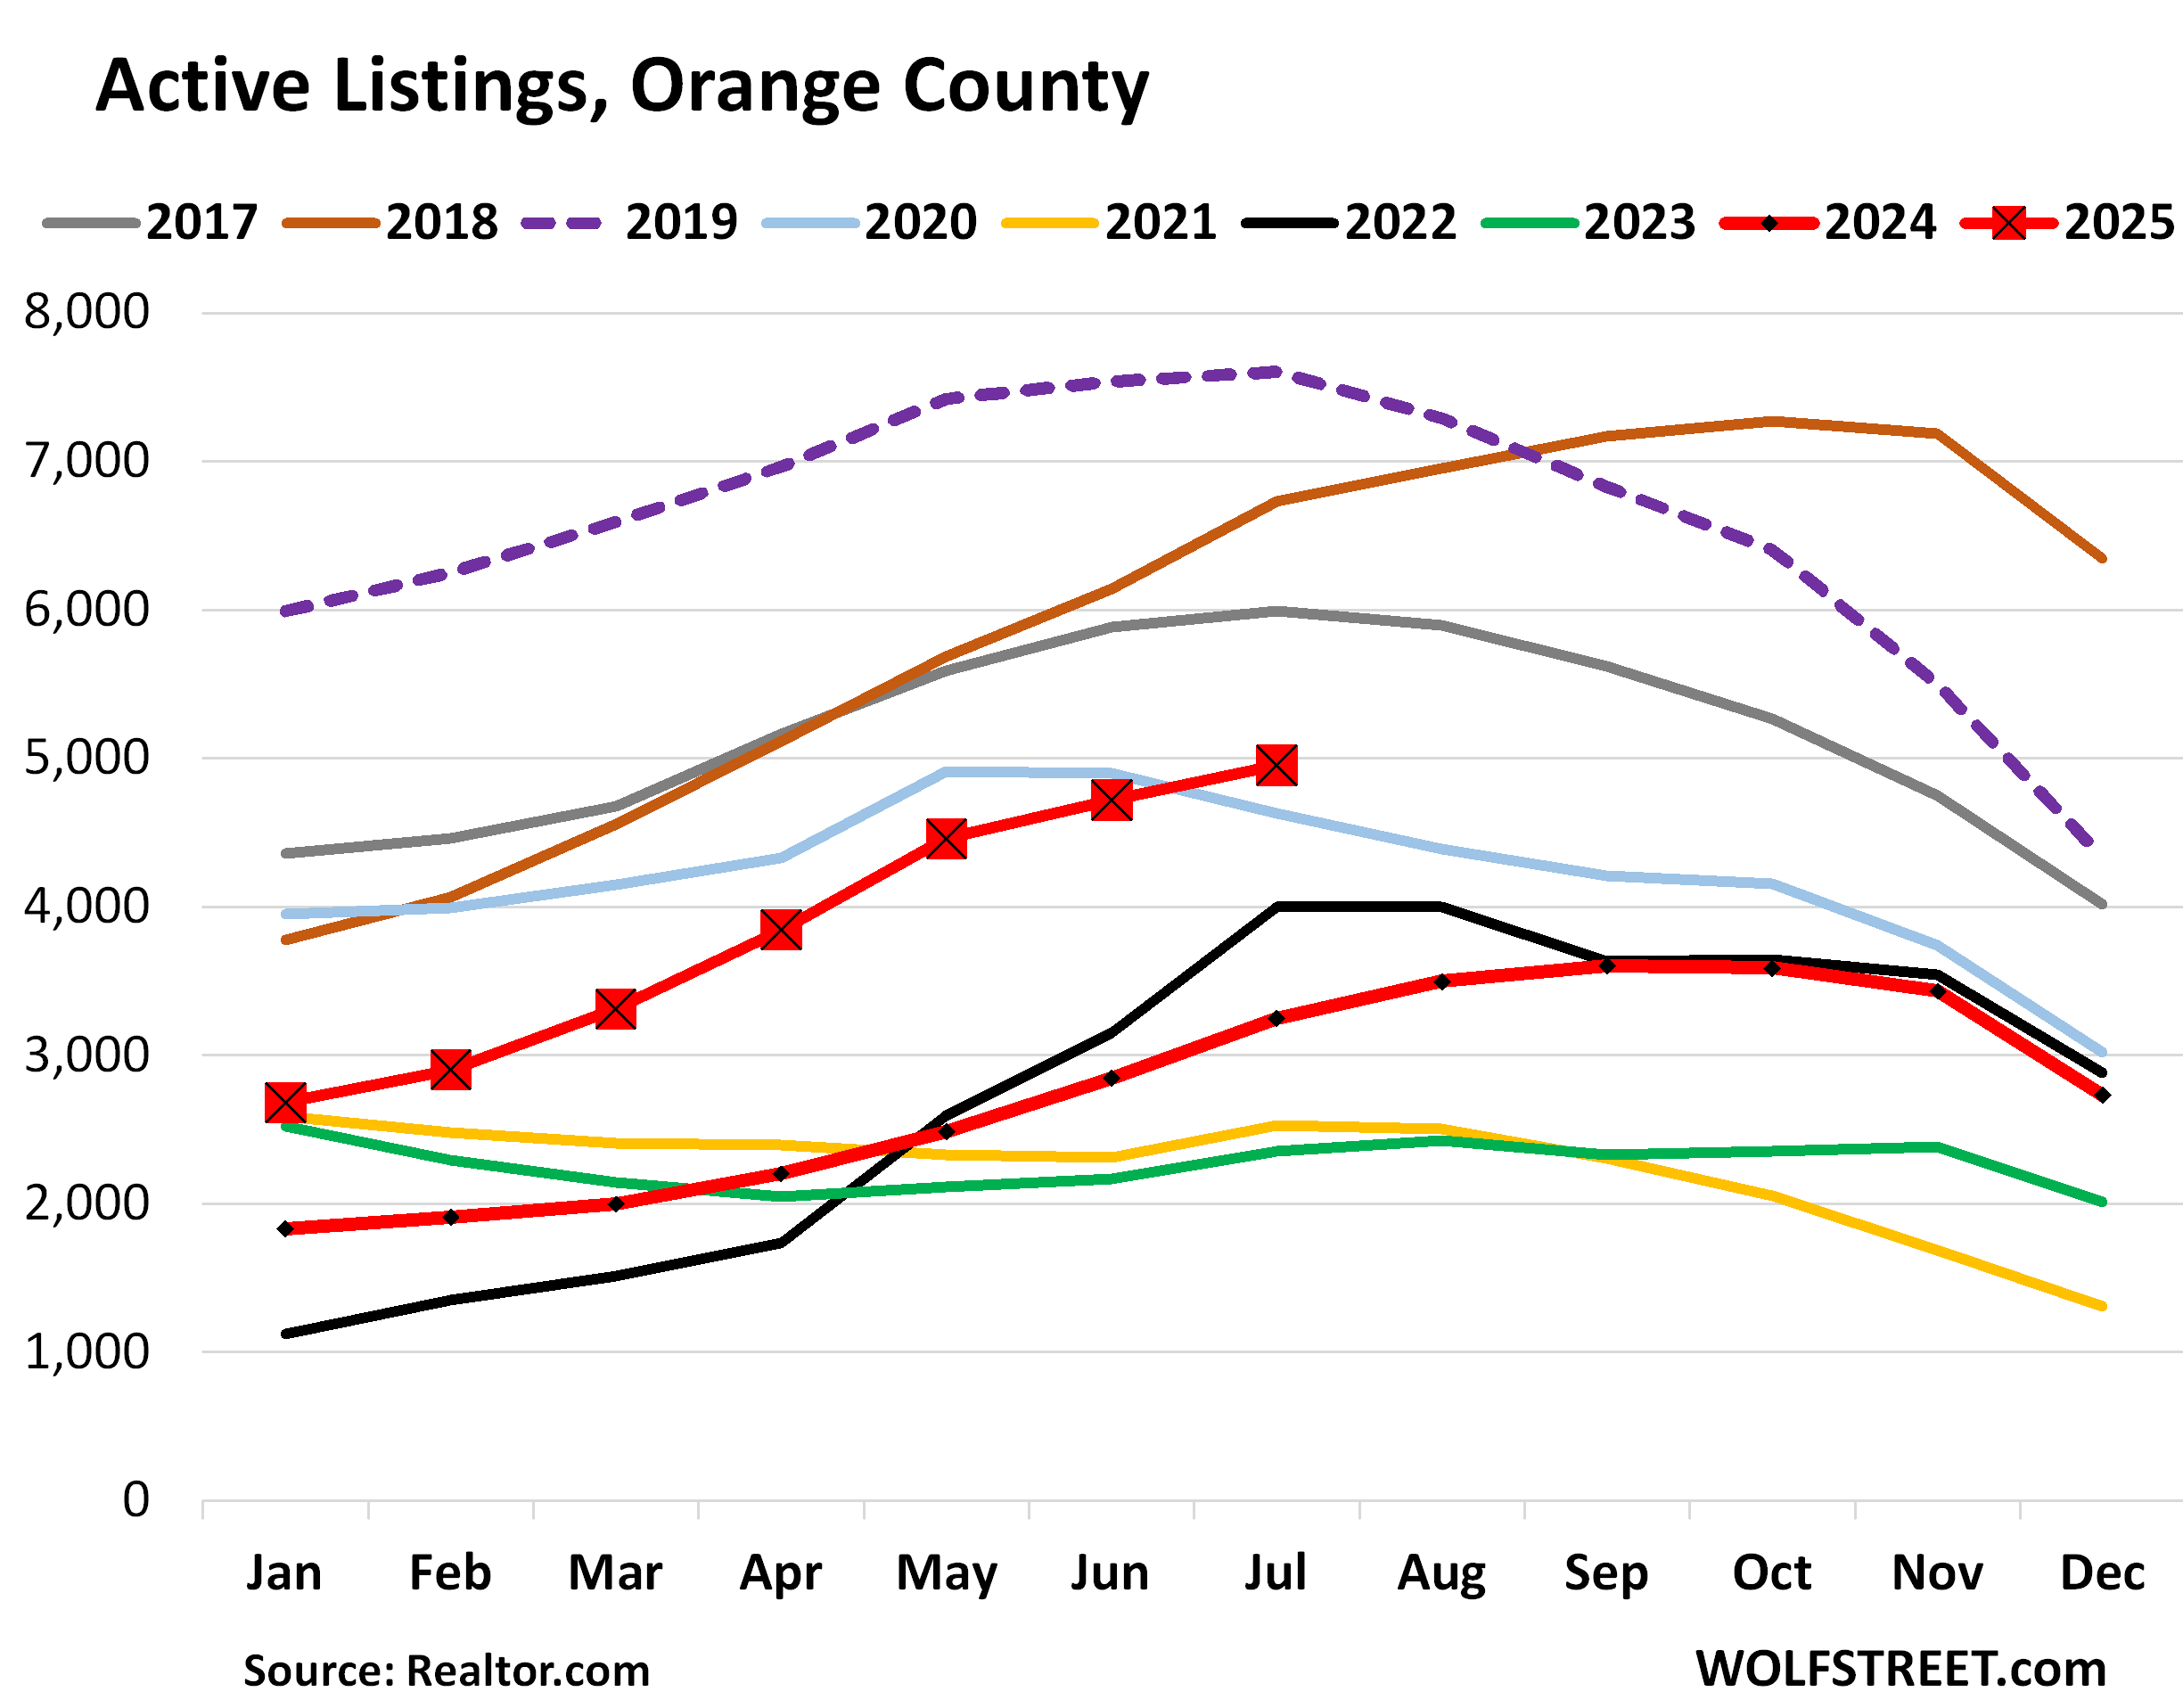
Orange County: Active listings spiked by 52% year-over-year in July, to 4,952 homes, the highest July since the prepandemic years.
Inventory in Orange County got a late start taking off and started the year 2024 out very low, but then took off, and this year continued to soar. Inventory has more than doubled in two years.
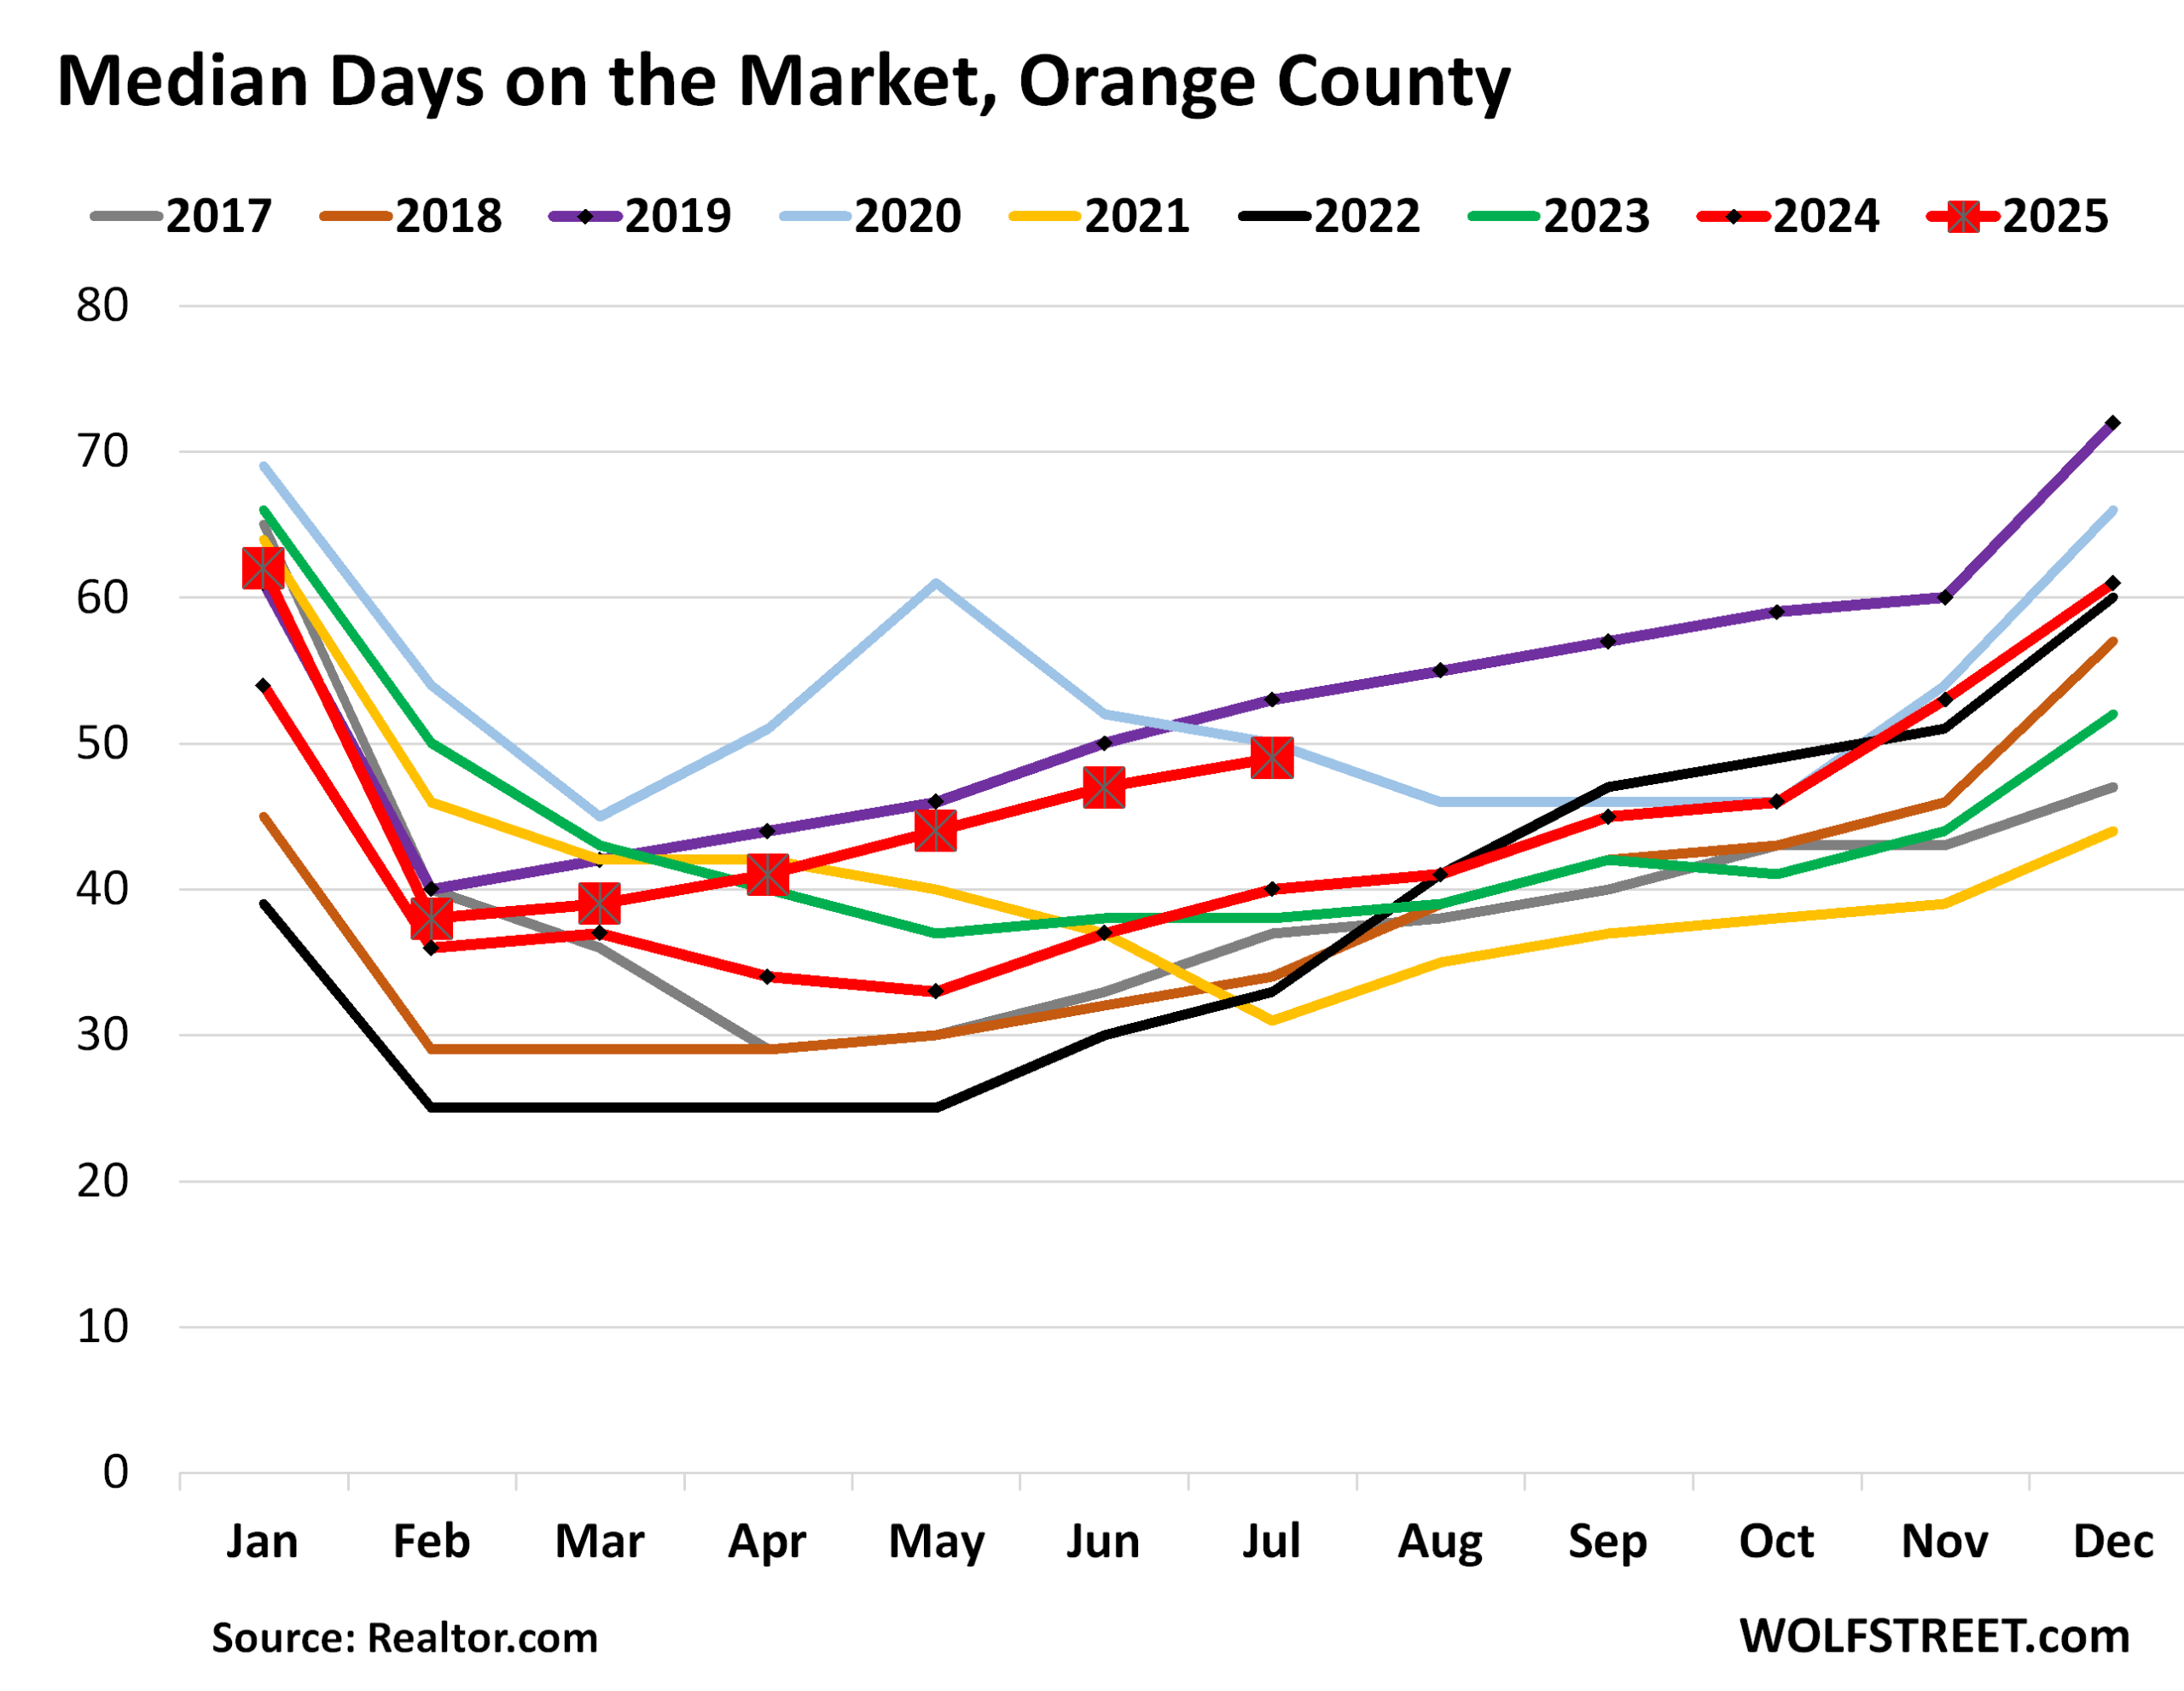
Median days on the market surged to 49 days, up from 40 days a year ago, and just below the Julys of the two high years of 2019 and 2020.
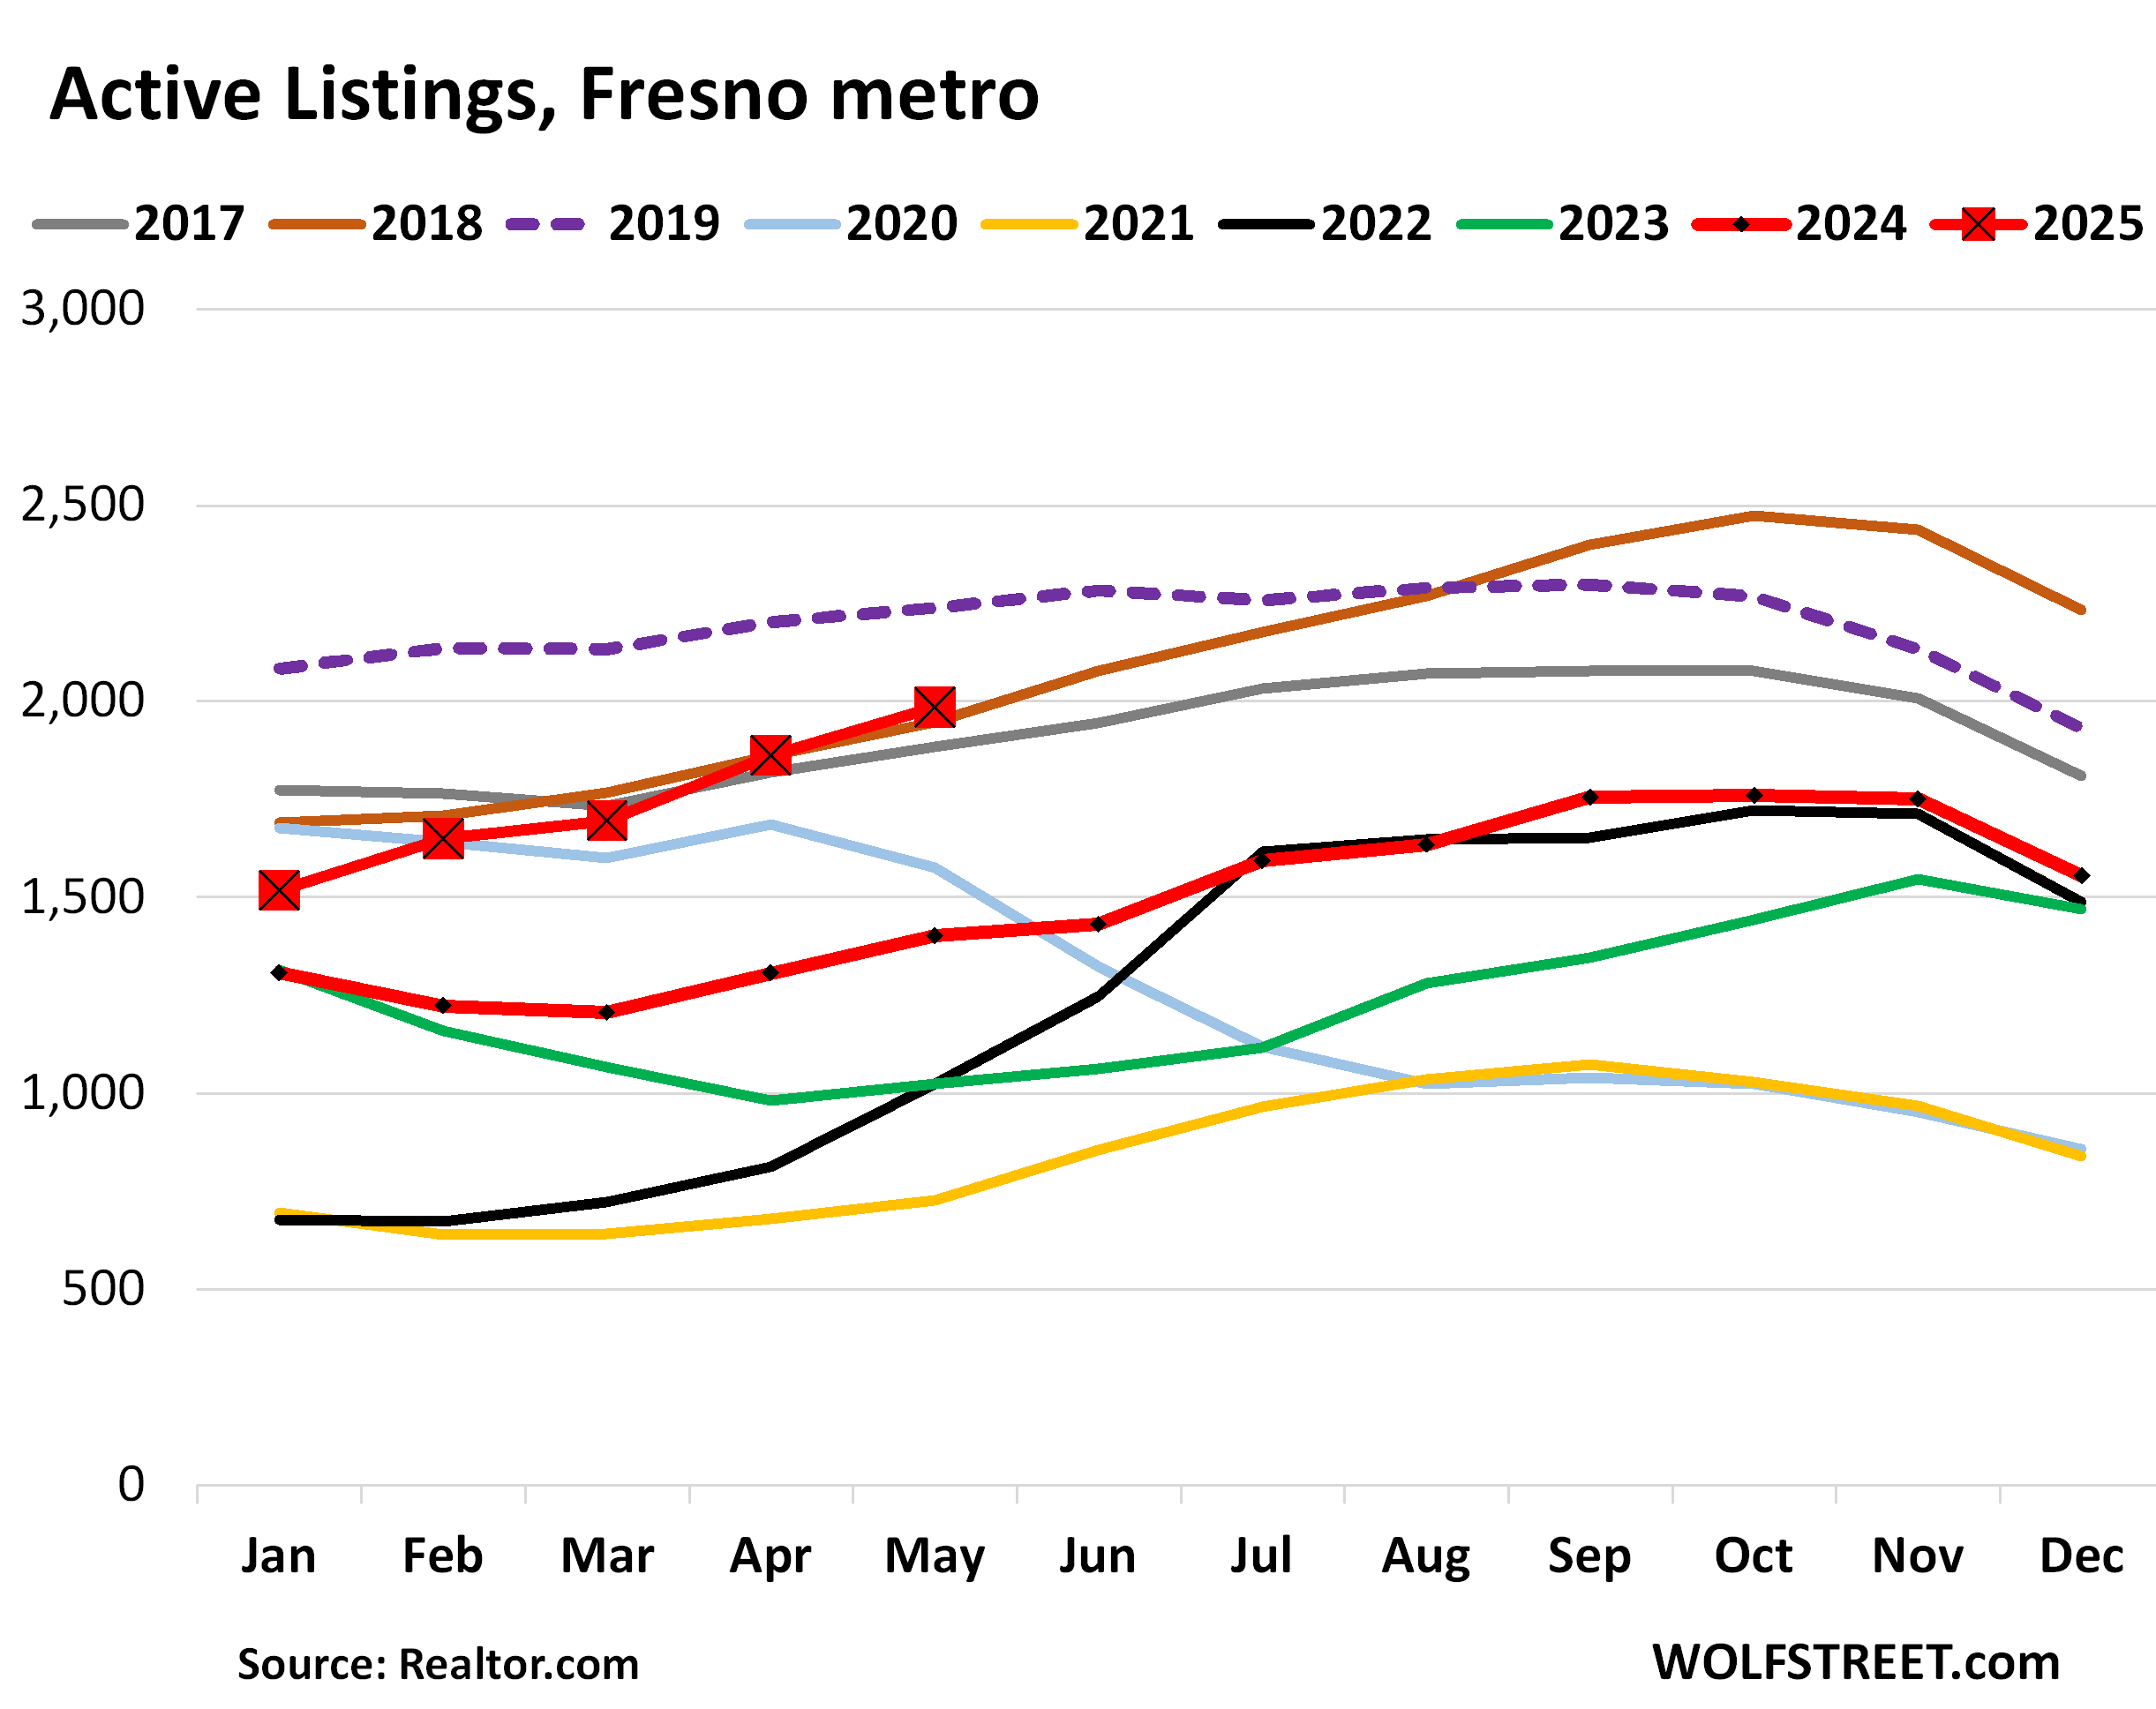
Fresno metro: Active listings rose by 33% year-over-year to 2,125 homes for sale, having nearly doubled in two years, and were just below the Julys of 2019 and 2018.
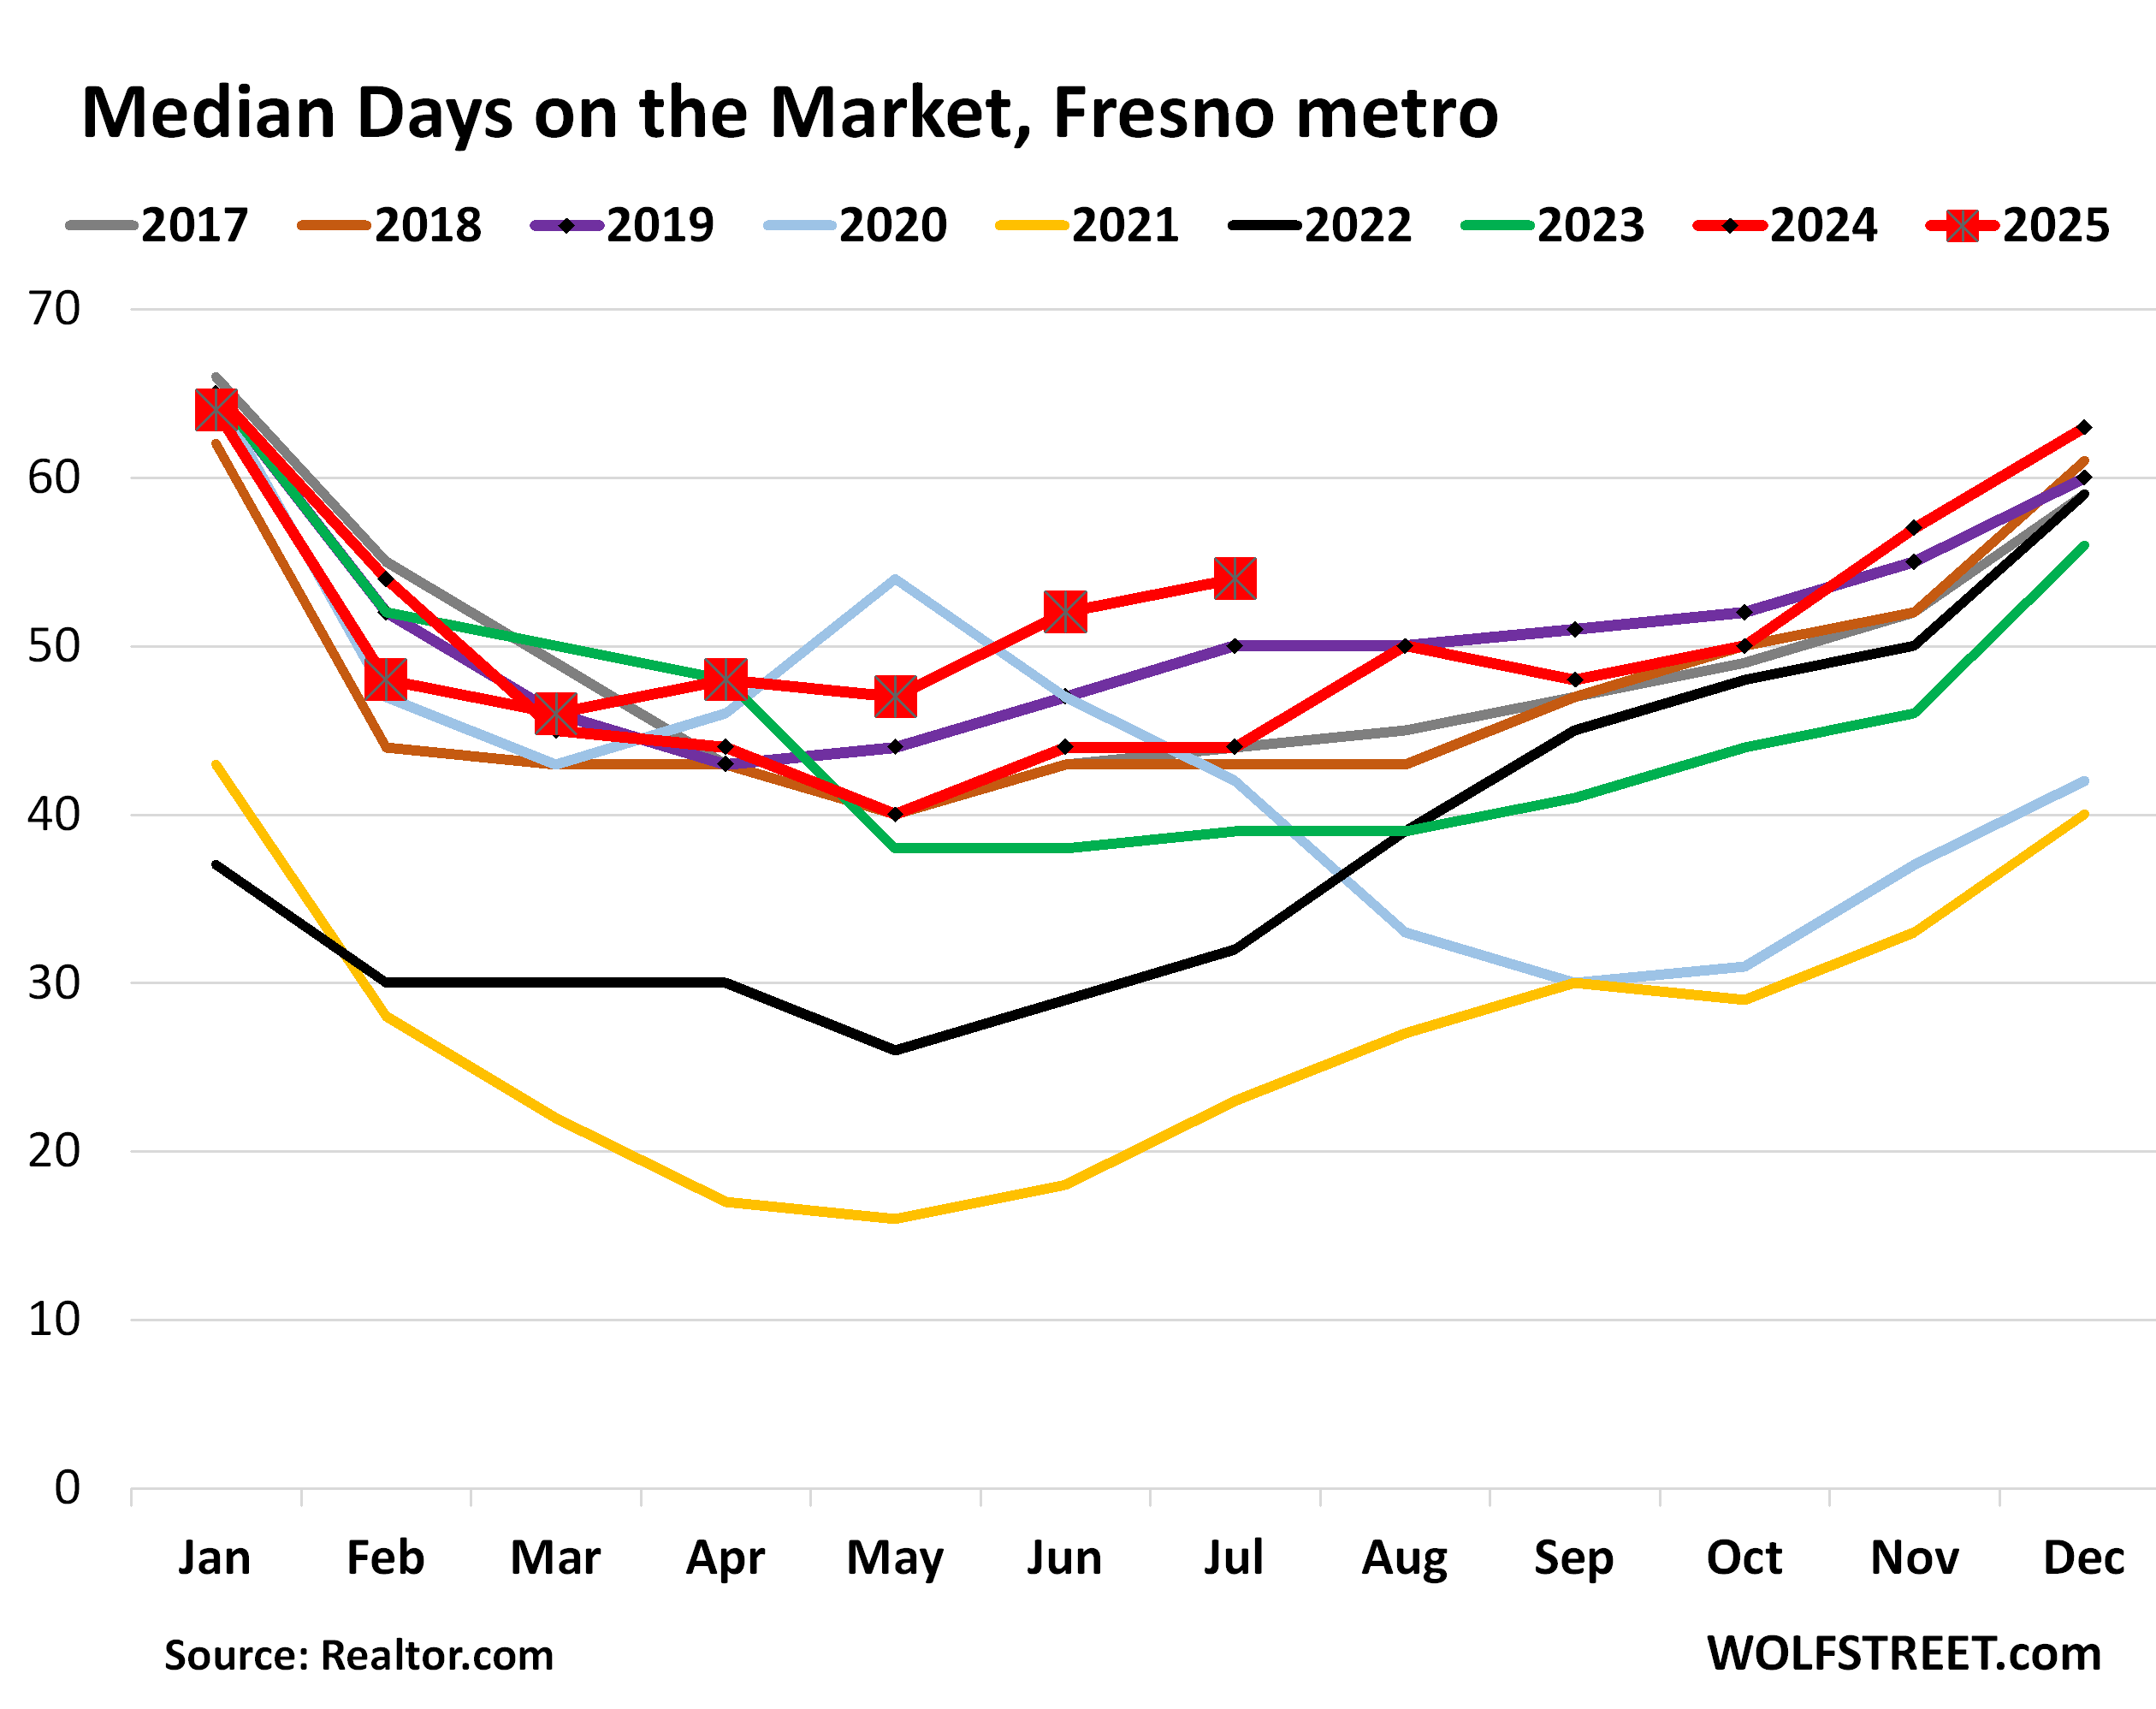
Median days on the market jumped to 54 days, the highest for any July in the data from Realtor.com, and up from 44 days a year ago.
Demand has vanished.
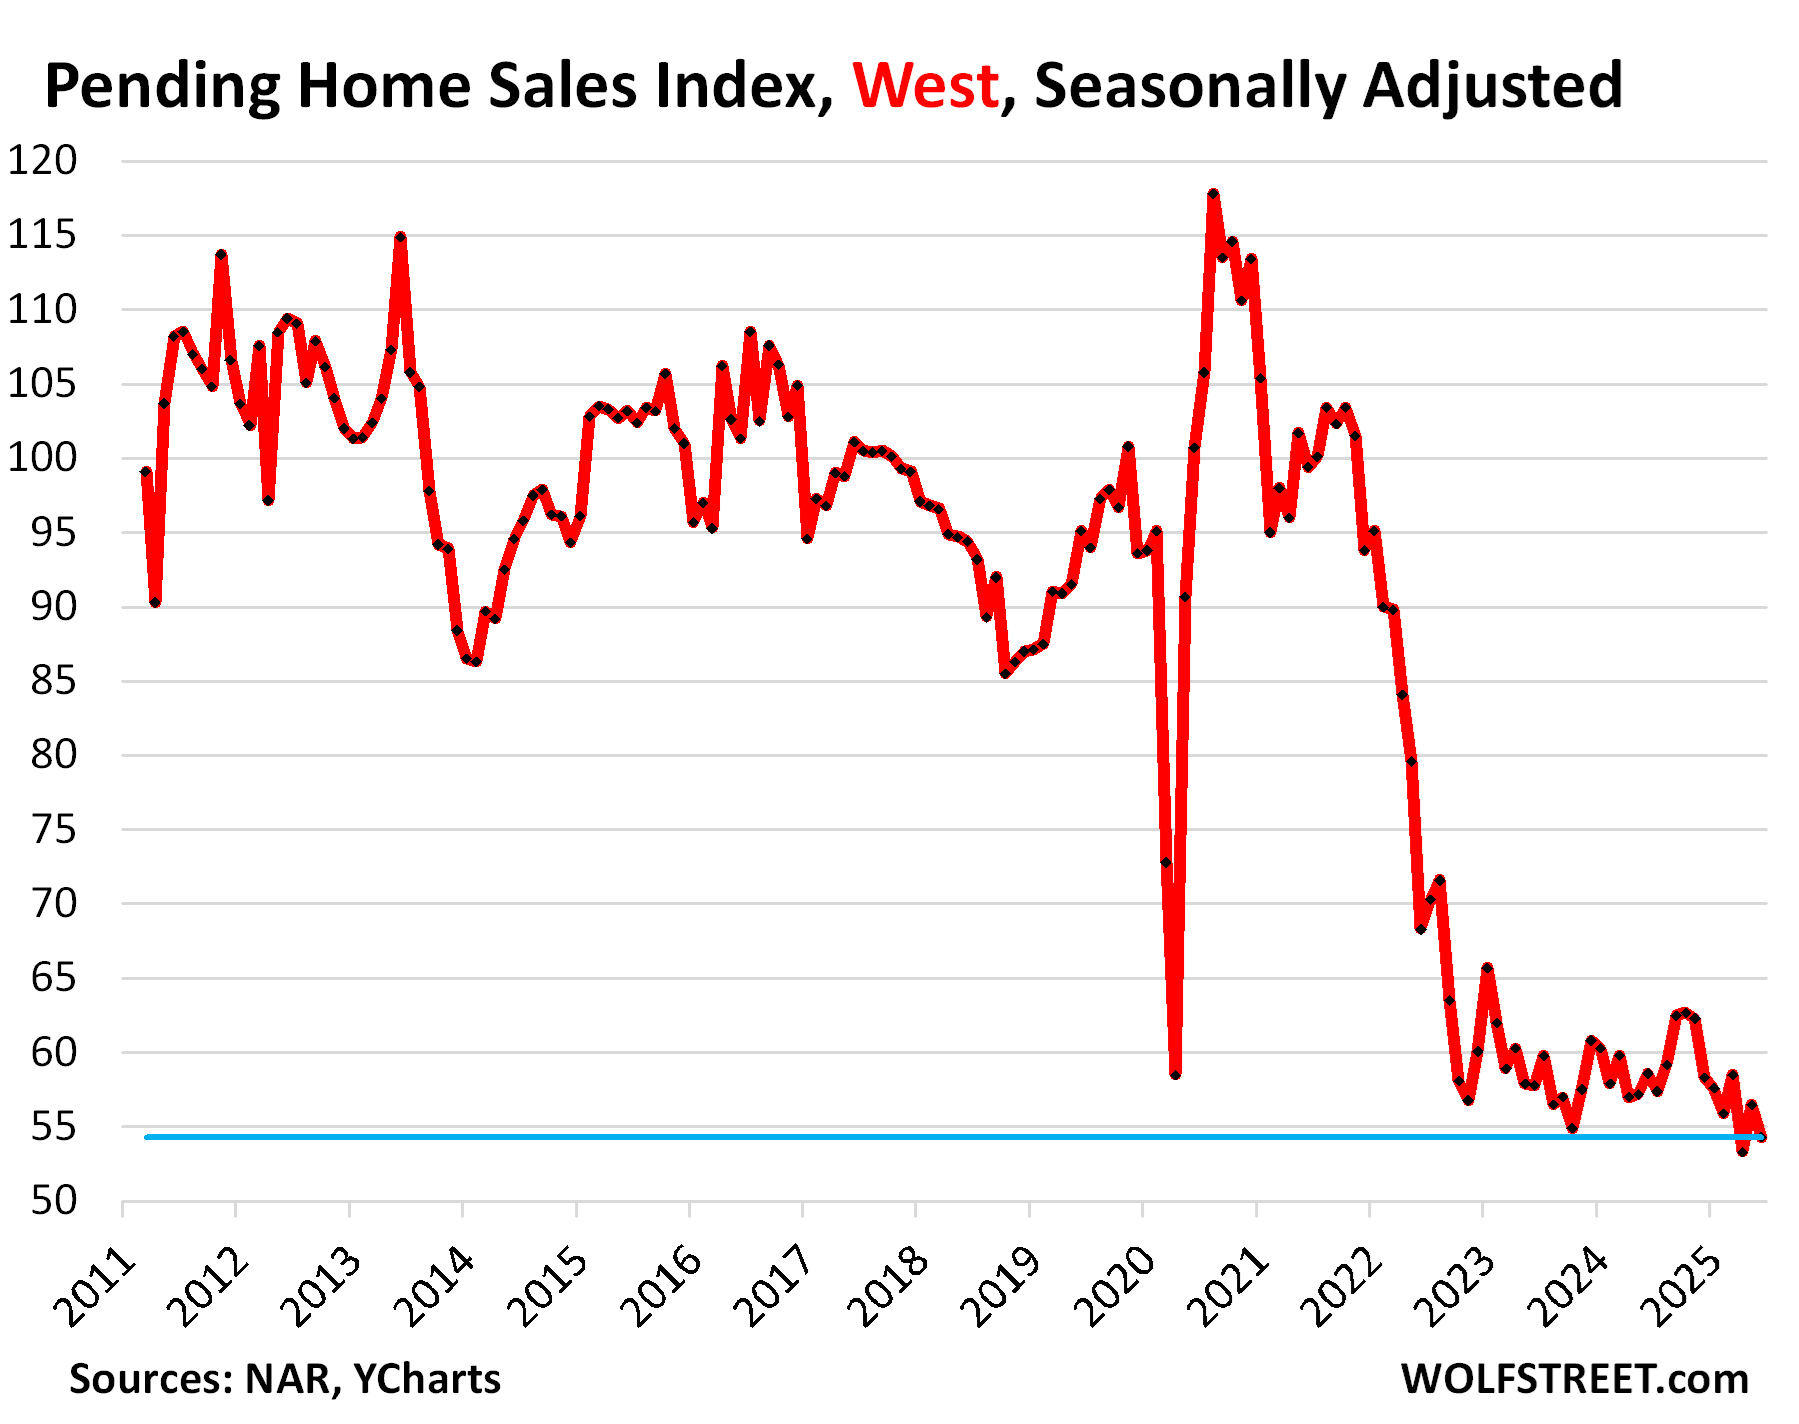
Pending sales of existing homes in the West withered further in June, down by 7% from the already crushed levels a year ago, and down by 43% from June 2019, according to the National Association of Realtors on Wednesday. This is the second-lowest level of sales since at least 2011, the extent of the data, behind only the all-time low in April.
The reason active listings have piled up and days on the market spiked isn’t a flood of new listings – there isn’t – but this plunge in demand.
Prices were already high before the pandemic and exploded in 2021 and 2022. Now they’re too high, and there are few buyers left willing to pay those prices. Too high prices destroy demand – that’s one of the fundamental economic principles.
So it’s a buyers’ market alright, but the buyers have gone home. This is what persistent demand destruction from too-high prices looks like:
Enjoy reading WOLF STREET and want to support it? You can donate. I appreciate it immensely. Click on the mug to find out how:

![]()
I don’t see many homes for sale at all over in my San Francisco neighborhood of the Excelsior.
Maybe it’s because we are still one of the lowest, if not the lowest, priced neighborhoods in San Francisco.
But if our chart area also includes Oakland and down as far as Fremont then I’m willing to bet that’s where the homes for sale are.
Even though San Francisco and Oakland are only a bridge away, he difference in desirability is a world apart.
Here we go, fist comment, “not in my neighborhood” 🤣
LoL, in my neighborhood, inventory is slooow. And they are pulling it off and “waiting until next year”.
Price fixes everything. As usual at the beginning of a slide, everyone thinks the band is still playing.
How can they be worth less? How can bonds decline in value? Mathz. Itz hard. Cheezburgers are soft.
Just because the trend is long term inflation doesn’t mean the typical consumer has more money, but instead, less, because everything needed for daily existence is so much more.
The paradox of real estate is on display- worth so much, but so hard to monetize. And now metals just fell out of bed, so meh.
Meanwhile, everyone who has made bank on the industry is hoping for one more boom… you had it in covid. The perfect exit was done by the Gravedancer Sam Zell in commerical real estate.
Those days will come again, with asset owners needing to reimagine uses for their property. How many bedrooms? How many tenants? Roomsit. LoL. There goes the neighborhood.
I see the zillow numbers on the monthly nut, and ask how can all these homes find that many top end renters or owners? Monthly nut of $5k for a 800k implies $140k of earnings- which is a top household. Cheap houses that cost $450k in Phoenix still run you $2500 per month net. That is a household income of $75k per year and a no fun diet.
That ain’t gonna fly long term unless wages soar.
Median household income in the USA for 35-45 year olds (prime age homebuyers) in 2023 was almost $110k, assuredly higher now.
“In my neighborhood” there are over a dozen homes on the market all of a sudden and nothing is moving. Not a single sale all summer. One, a big house with a great view, has been on the market for over a year – price is too high. Somebody would definitely buy that house for the right price.
In Chicago one of my clients has a 1200 sq ft condo on second floor (worst floor) bought at 650k now sold for 810k. Bought in 2021. Not happening here. We have the freahwater (and high taxes).
Truly not in my neighborhood, all people are trampling over themselves buying or pulling off the market until after the arrival of next alien invasion by Nov under the guide of 3I/ATLAS. Cause you know when SoCal is getting extraterrestrial invasion, price will go insane again since supply will just be vaporized…/s
Honestly, this might be a talking point of RE agents next since rate cut sales pitch is losing steam fast…
I’m seeing 20 day listing to close sales in The Outer Sunset in SF.
But I’ve heard for years that SF is its own world in real estate.
Still, this article is about broad regional trends, encompassing many cities with presumably many different sub markets.
I live in the University district “UOP” Stockton,Ca.
When homes in the area go up for sale they are sold quickly.
Now there have been quite a few sitting only to be taken off of listing and to return weeks later, Big change.
Thanks for Your hard work Mr.Richter.
Orange County +50%, San Diego +44%, Los Angeles +38%
:)
In due time, hopefully will see this too with price…wishful thinking but a man can pipe dream
List price
Orange County -50%, San Diego -44%, Los Angeles -38%
I wouldn’t worry about that.
When sellers figure out reality they’ll get there – or more.
To make median LA home make sense to median household income prices need to be no more than $160k. Similar story elsewhere in the state.
You simply cannot have prices the way they are, both in California and nationwide. Houses have to be affordable to people, or they will be economically worthless as they sit empty.
Yup and what’s nuts is that even with -50% reduction in OC, which might as well pipedream at this point, it will barely bring prices back to normal range of wage/housing ration based on median income in the area.
Kind of goes to show how absurb things are and how normalize and ingrain in people’s head this is the new norm.
West LA ZIP codes’ median household income ranges from $172-$225k as of 2023. It’s assuredly higher now.
It’s not demand destruction. Price elasticity demand.
But they pulled forward a ton of buyers n many r now trapped.
The cat is out of the bag. No housing shortage n a ton of RE investors.
RE is troublesome asset when prices fall and most investors r leveraged
So what is happening? Prospective buyers won’t pay the asking prices because mortgage rates are too high to finance the purchase. Sellers won’t lower the asking prices in anticipation of a drop in rates that will validate their price. So the market freezes. Is this the consequence of expectations (uncertainty) resulting from Trump calling for rate reductions and threatening to fire Powell?
Here we go, first comment. It’s Trump’s fault.
I did not intend to assign fault, just identifying the factors at work. The jury is still out on Trump as far as I’m concerned, we will see how his tariffs work out, could be a big success, or maybe not.
I did not intend to assign fault, just identifying the factors at work. The jury is still out on Trump, we will see how his tariffs and other economic policies work out, could be a big success, or maybe not.
There are still enough people in the media peddling the lie that the Fed Funds rate dropping will automatically mean a corresponding drop in mortgage rates.
All they have to do is to look at what happened to long term rates going up 100 basis points the last time the Federal Reserve cut short term rates by 100 basis points. Is that really so hard to do?
It’s the glorious Mexican standoff… Might last for a while, keeping in mind unemployment rate still historical very low and we’re already here…
The way things are going too, who knows maybe this standoff might get deported sooner than expected
And the headline is the labor market is soft. LoL. Data for you served up today.
4.2%, and people are falling off the back end without finding a job. So here we go, again.
I guess the cut rates crowd will get some more ammo over the next month.
Nobody “falls off the back end without finding a job.” You’re confusing the “unemployment rate” (today’s data) which never ends, with unemployment insurance compensation which ends after a certain period of unemployment. Today’s data had zero to do with unemployment insurance.
What is happening is people are realizing that rates from 2009-2022 aren’t coming back so they are trying to get out now. If they thought lower rates were coming then they wouldn’t list.
He who panics first panics best.
Good luck selling now. Maybe if you undercut the market by 10-20%.
I think the statement “He who panics first panics best” above is relevant. Better take 10-20% “less” now than 40-50% less later.
Prices are fundamentally to too high. And, paltry 5 or 10 percent price drops won’t fix that.
Sellers feel entitled to 50% year over year price appreciation. Why would a prudent buyer capitulate to this?
Not convinced people delist because of frustration. I think they (correctly) believe having their home languish on the market leads to lowball offers and just outright puts a lot of people off.
The interesting thing is what price they’ll come back at. I think it’s also a mistake to believe it makes any difference to this perception issue. Practically every site shows the full listing history these days.
As Tuco said: “When you have to shoot, shoot. Don’t talk.”
So, when you have to sell, sell, don’t stall, overprice, rationalize, etc.
2022 is now three years ago. And those 6 plus percent interest rates ain’t going away.
“…leads to lowball offers and just outright puts a lot of people off.”
But that “lowball offer” that puts sellers off may be the market clearing price. Sellers may not like it, but that’s what it is. Lowball only for the seller, not the buyer.
if you cannot sell something for the price you want, your price is not the market clearing price.
I like the optimism that next year will be better. It’s like they haven’t considered the possibility that next year might be worse?
Buying a house is a long term commitment. Between current interest rates and massive uncertainty over where the economy is heading, smarter to rent. Meanwhile, sellers don’t want to take a loss, so they only sell if there’s no other option.
Supply drops as prices fall, demand rises as prices fall. Econ 101.
I get this is Cali.,was interested and almost bought in North Carolina(dodged a bullet there as was a area badly damaged),seems though places interested in seem to be going up in price(small home/lots of land),going to really do a long term visit to West Virginia as prices/taxes on property reasonable it seems,till then,like many am on strike(buyers).
I do find it interesting how quickly prices can go up but seems very slow to drop,well,I will just keep looking/waiting.
Sellers be patient! Rate cuts are coming! That’s what Marcus Goldman told me in an email so it must true!
It’s common in my northern California housing market to list high and take less. It’s one of the poorest counties in the state and sellers dream their main asset will deliver the goods. But price reductions and delistings are surging like never before, it’s funny but kind of sad too.
It’s going to take a long, long time for the housing market to heal from the Fed’s MBS meddling of the last 16+ years.
MBS instruments only affect low-end ‘conforming’ housing and it doesn’t matter the slightest bit of a hoot who owns those MBS instruments. The Federal Reserve is getting out of those entirely with QT, by the way.
Yeah, at the speed of a tortoise, the MBS portfolio will be sold off in a decade at this rate.
Amen brother, amen!
And throw in ZIRP
Yep, and I can see it with most people that I know, money is getting tighter and tighter. The free money stopped, the high inflation rate from ’21 to ’23 reset what everything costs, and the home will steadily lose value here at the back end of the housing valuation cycle. Throw in the inevitable stock market swings to the downside and I can see this going from a “freeze” to a “panic.” …the key is to not be surprised by it.
When the economy is primarily driven by the injection of new money vs. the activation of existing savings, you get the Cantillon Effect, the change in the concentration of relative prices resulting from the distributional effects of monetary policy.
Artificially low interest rates stoked asset prices. And Powell knew this already.
Eric Schmidt Pays $110 Million for Spelling Manor…
GOLDMAN Urges Caution as Global Credit Spreads Hit 2007 Lows…
10:57 AM 8/1/2025
Dow 43,480.26 -650.72 -1.47%
S&P 500 6,223.93 -115.46 -1.82%
Nasdaq 20,603.68 -518.76 -2.46%
VIX 21.35 +4.63 27.69%
Gold 3,399.50 +50.90 1.52%
Oil 67.34 -1.92 -2.77%
Who wants to live in California anyway?
LOL. It’s way too crowded here. 20 million people are packed into the southern tip of California, another 9 million are packed around the Bay wedged against the water. And now the leavers are coming back from Texas. It’s just too crowded here.
39 million people.
No one under 70.
There are fewer kids in California now than there were in 1995.
I’m well under 70 and live in California and it’s awesome. Taxes are high, but the weather and things to do are great. I also have a kid. In 1995 the 17 and under population in the US was 69.5M, the projected 17 and under US population in 2025 is 70.9M. California may be down slightly more than average, but there’s essentially no growth in the aggregate child population. Using your logic, maybe no one under 70 wants to live in the US.
I was wondering if this could be looked at from a different frame – how much of the price increase was driven by investment buying – not individuals. Investors price RE from a much different perspective that individual owners. Is there data on how much of the COVID buy-athon was driven by well positioned individuals or by firms / investors that saw the 0% rates and sucked up everything. Most people I talk to refinanced but didn’t get a new home as we were in the middle of the pandemic. That said, even investors see downside when the math from rent / flip upsell / tax write offs, etc… stop working. The price drop for the individual buyer that would be required to get them back into the market at reasonable (30-40% of salary payments) might be much lower that the price point at which investors could start gobbling again. If the prices do start to drop, the math for investors could turn favorable before it would do so for the individual new home buyers. So basically don’t get your hopes up if you are looking for relief. The American dream has pretty much become the American sucker play. Just thinking out loud.
Q1:2007 to Q1:2009, prices declined a shade less than 20%.
Household income declined 1%.
Q4:22 to Q2:25, prices declined 7%.
Household income increased about 12%.
This time it’s different.
what kind of figures are you looking at?
FRED figures.
FRED reproduces data from others, that’s all it does. It has numerous data sets on income: household income, personal income, real income, wages and salaries, real median household income, real median family income…. Go and find that specific series that you cited and copy and paste the headline of the chart into here, and then I’m going to crush your BS because your numbers are BS.