The new and improved Standing Repo Facility (SRF) sprang into action for one day at quarter-end on June 30.
By Wolf Richter for WOLF STREET.
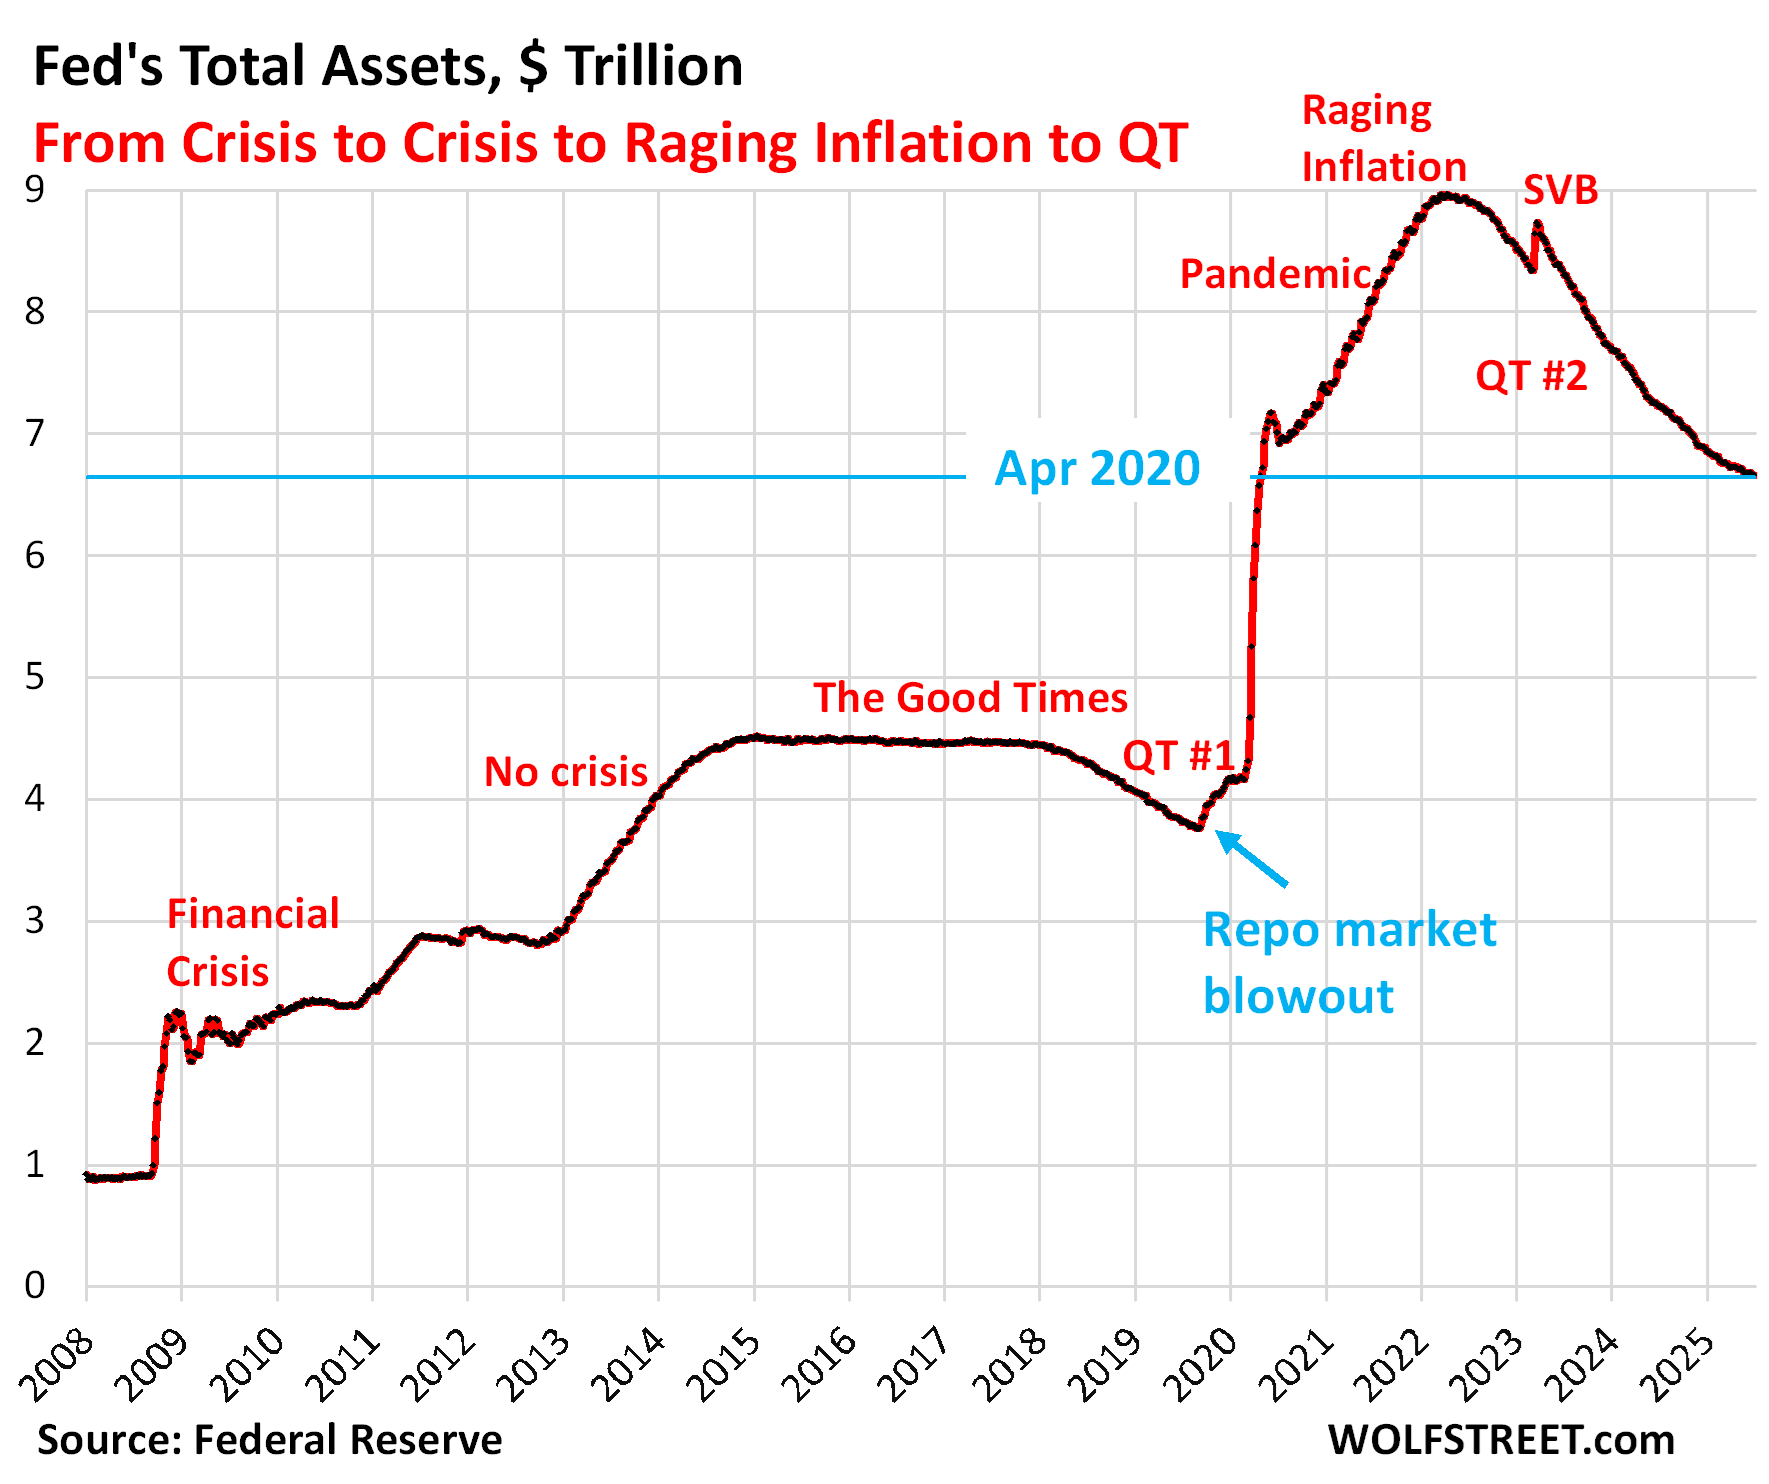
Total assets on the Fed’s balance sheet declined by $13 billion in June, to $6.66 trillion, the lowest since April 2020, according to the Fed’s weekly balance sheet today. Since peak-balance sheet at the end of QE in April 2022, the Fed’s QT has shed $2.31 trillion, or 25.7% of its total assets.
This completes the third year of official QT, and nothing has imploded yet, outside of a few regional banks in 2023. QT kicked off officially in June 2022 amid a massive surge of inflation. But the balance sheet had already started to decline in April, and by the end of May was already down $50 billion.
In terms of Pandemic-era QE, the Fed has shed 48.0% of $4.81 trillion in assets it had piled on from March 2020 through April 2022.
QT assets.
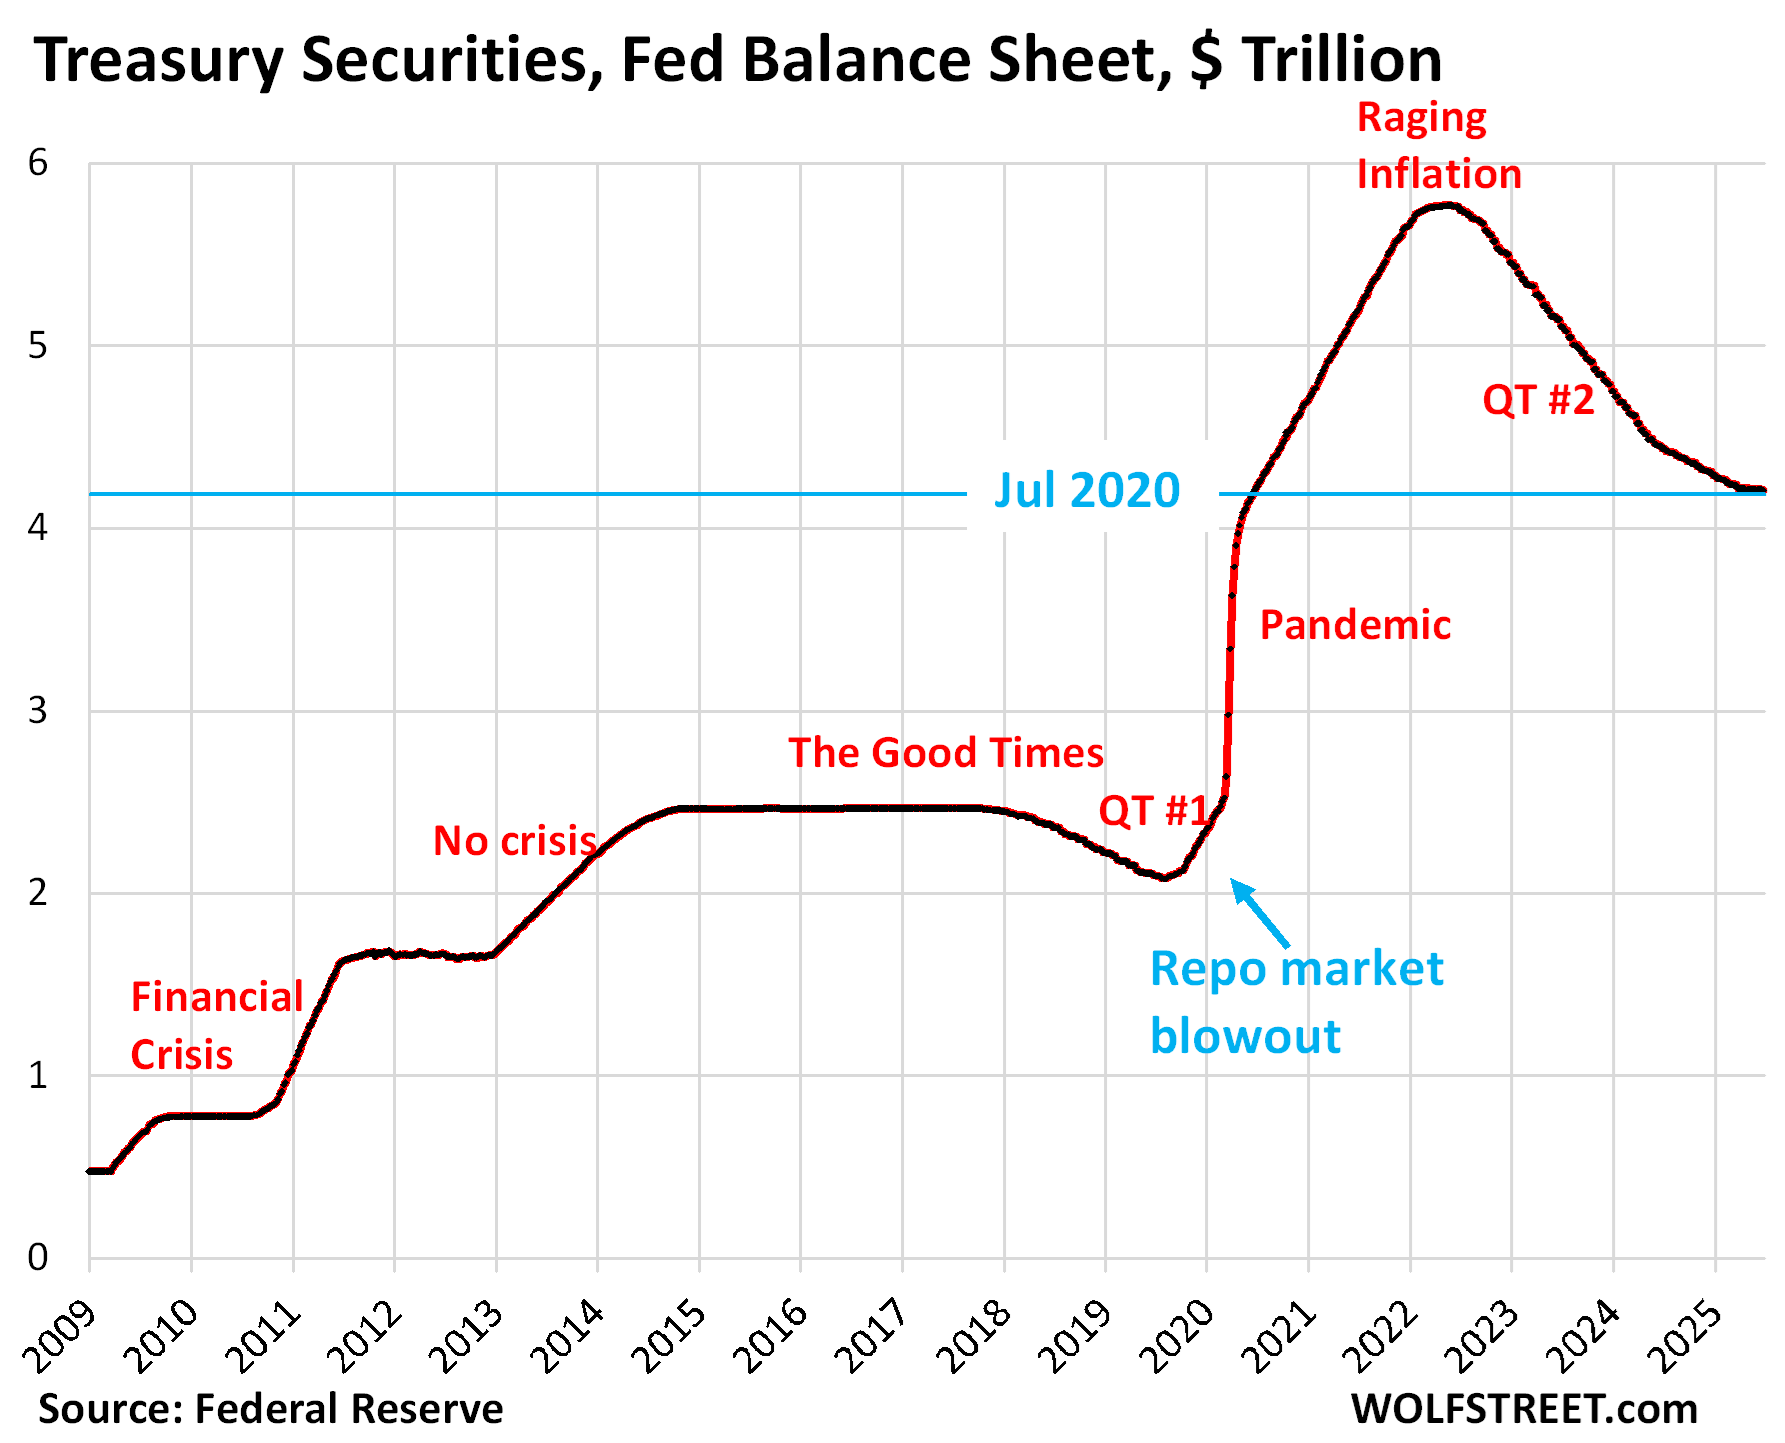
Treasury securities: -$3.8 billion in June, -$1.56 trillion from peak in June 2022 (-27.0%), to $4.21 trillion, the lowest since July 2020.
During pandemic QE, the Fed had piled on $3.27 trillion in Treasury securities. It has now shed 47.7% of that.
The Fed recently slowed the Treasury part of QT to just $5 billion a month. Included in the Fed’s Treasury holdings are $428 billion of Treasury Inflation Protected Securities (TIPS), of which $112 billion is inflation protection that TIPS holders receive and that is added to the TIPS balance to be paid when the TIPS mature. So the Fed’s TIPS balance grows with the inflation protection. In June, the Fed received $1.2 billion in inflation protection, which was added to the TIPS balance, which had the effect of reducing the roughly $5 billion in Treasury roll-off to $3.8 billion.
Treasury maturities, reinvestment, and roll-off.
Treasury notes (2- to 10-year) and Treasury bonds (20- & 30-year) mature mid-month and at the end of the month, and the Fed gets paid face value. The amounts vary widely from month to month.
If the Fed doesn’t do anything, its Treasury holdings will shrink by the amounts of those maturities each month.
To limit the monthly shrinkage of its holdings – and thereby the liquidity drain on the financial markets – it reinvests a portion of the proceeds into new securities that it buys at Treasury auctions.
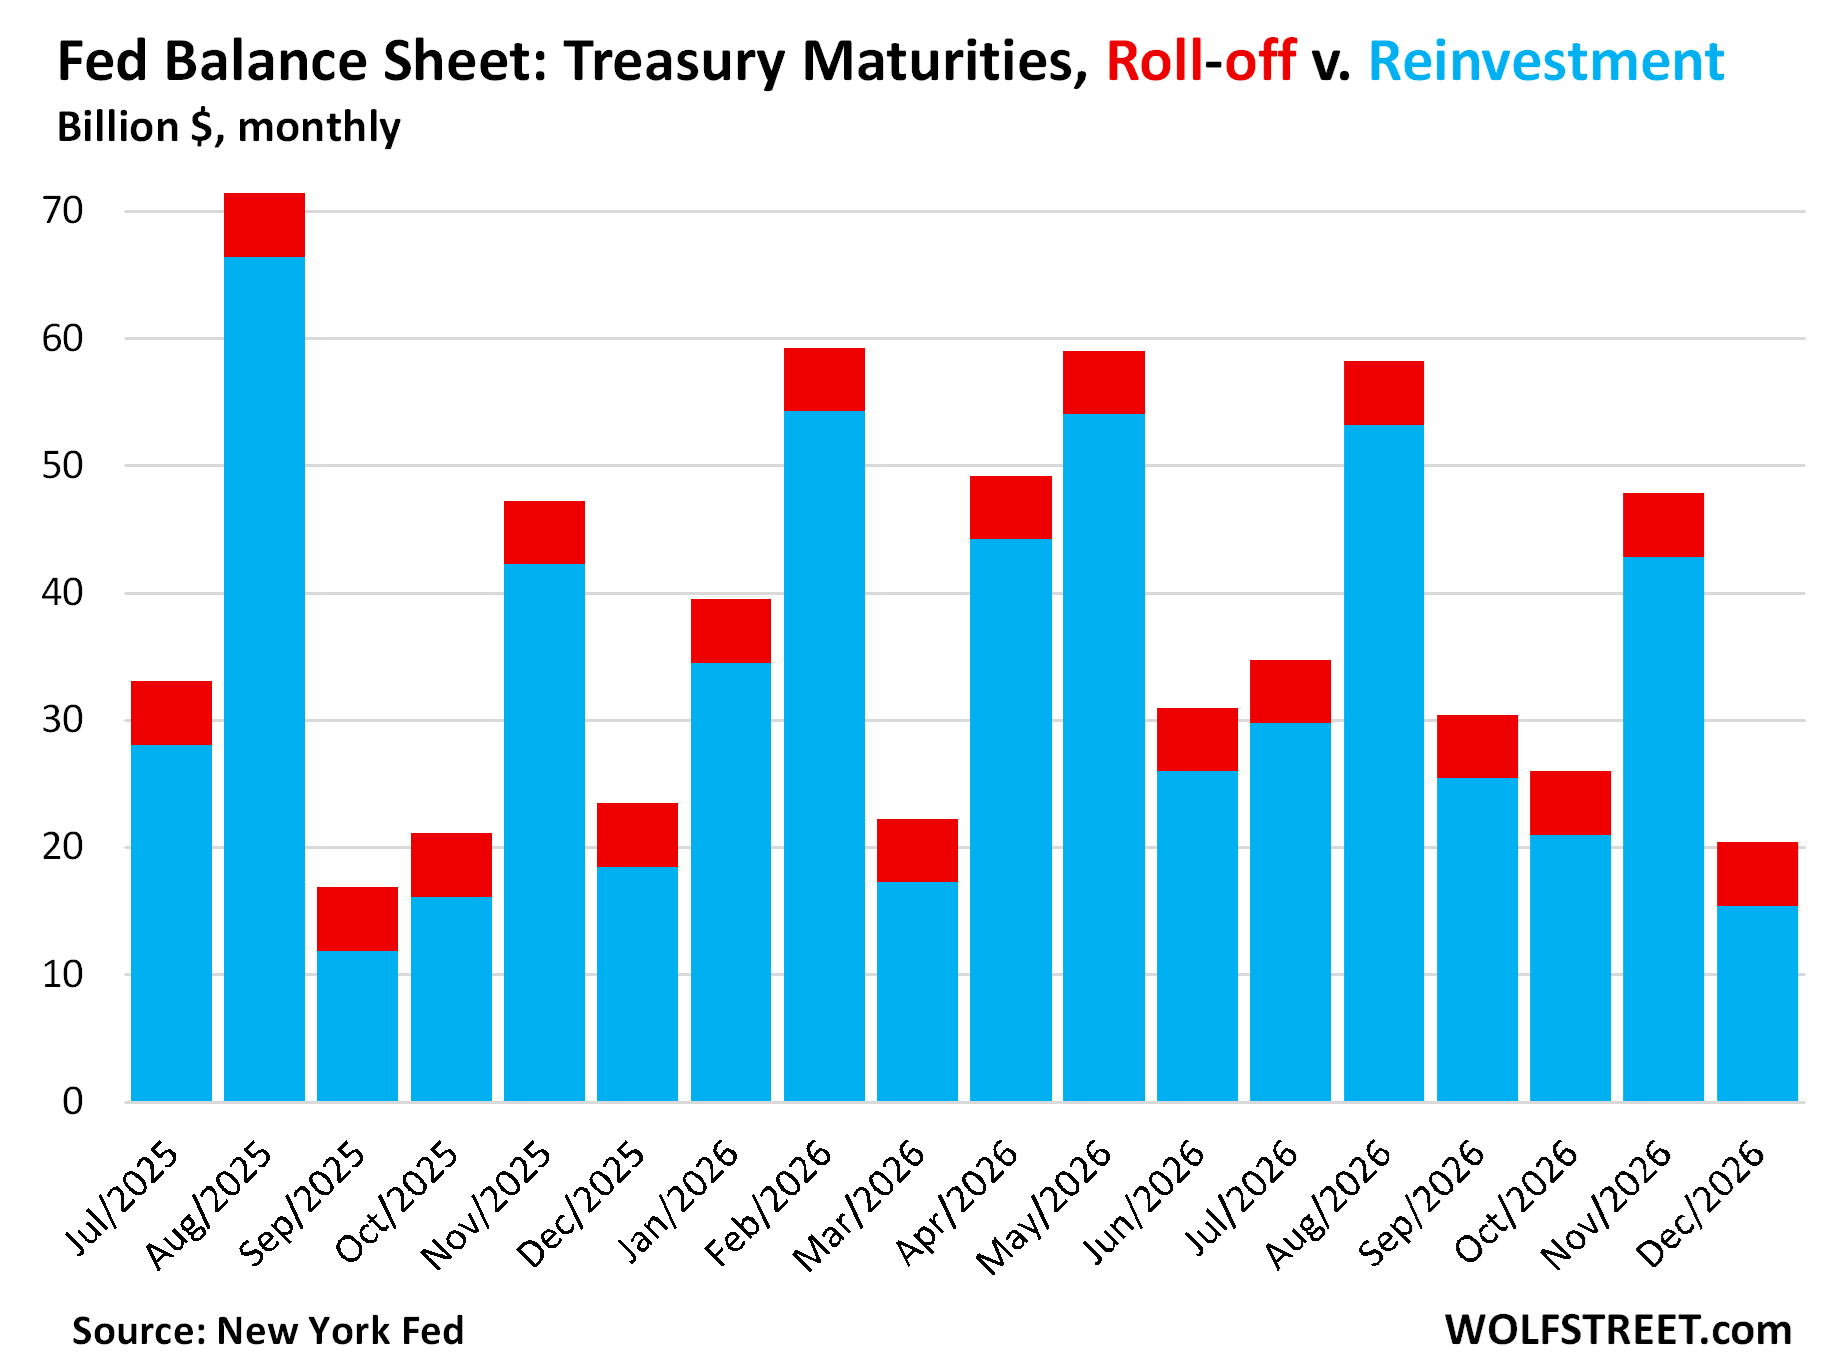
The remainder “rolls off” the balance sheet and reduces the balance sheet. As of April, the roll-off has been lowered to $5 billion a month (red in the chart below). The remaining amounts of the maturing securities each month are re-invested in new securities.
So…
In July, $33 billion in Treasuries will mature. The Fed will reinvest $28 billion by buying new Treasuries at auction; and it will allow $5 billion to “roll off” the balance sheet.
In August, $71 billion will mature. The Fed will reinvest $66 billion and allow $5 billion to “roll off.”
In September, $17 billion will mature. The Fed will reinvest $12 billion and allow $5 billion to “roll off.” Etc. etc.
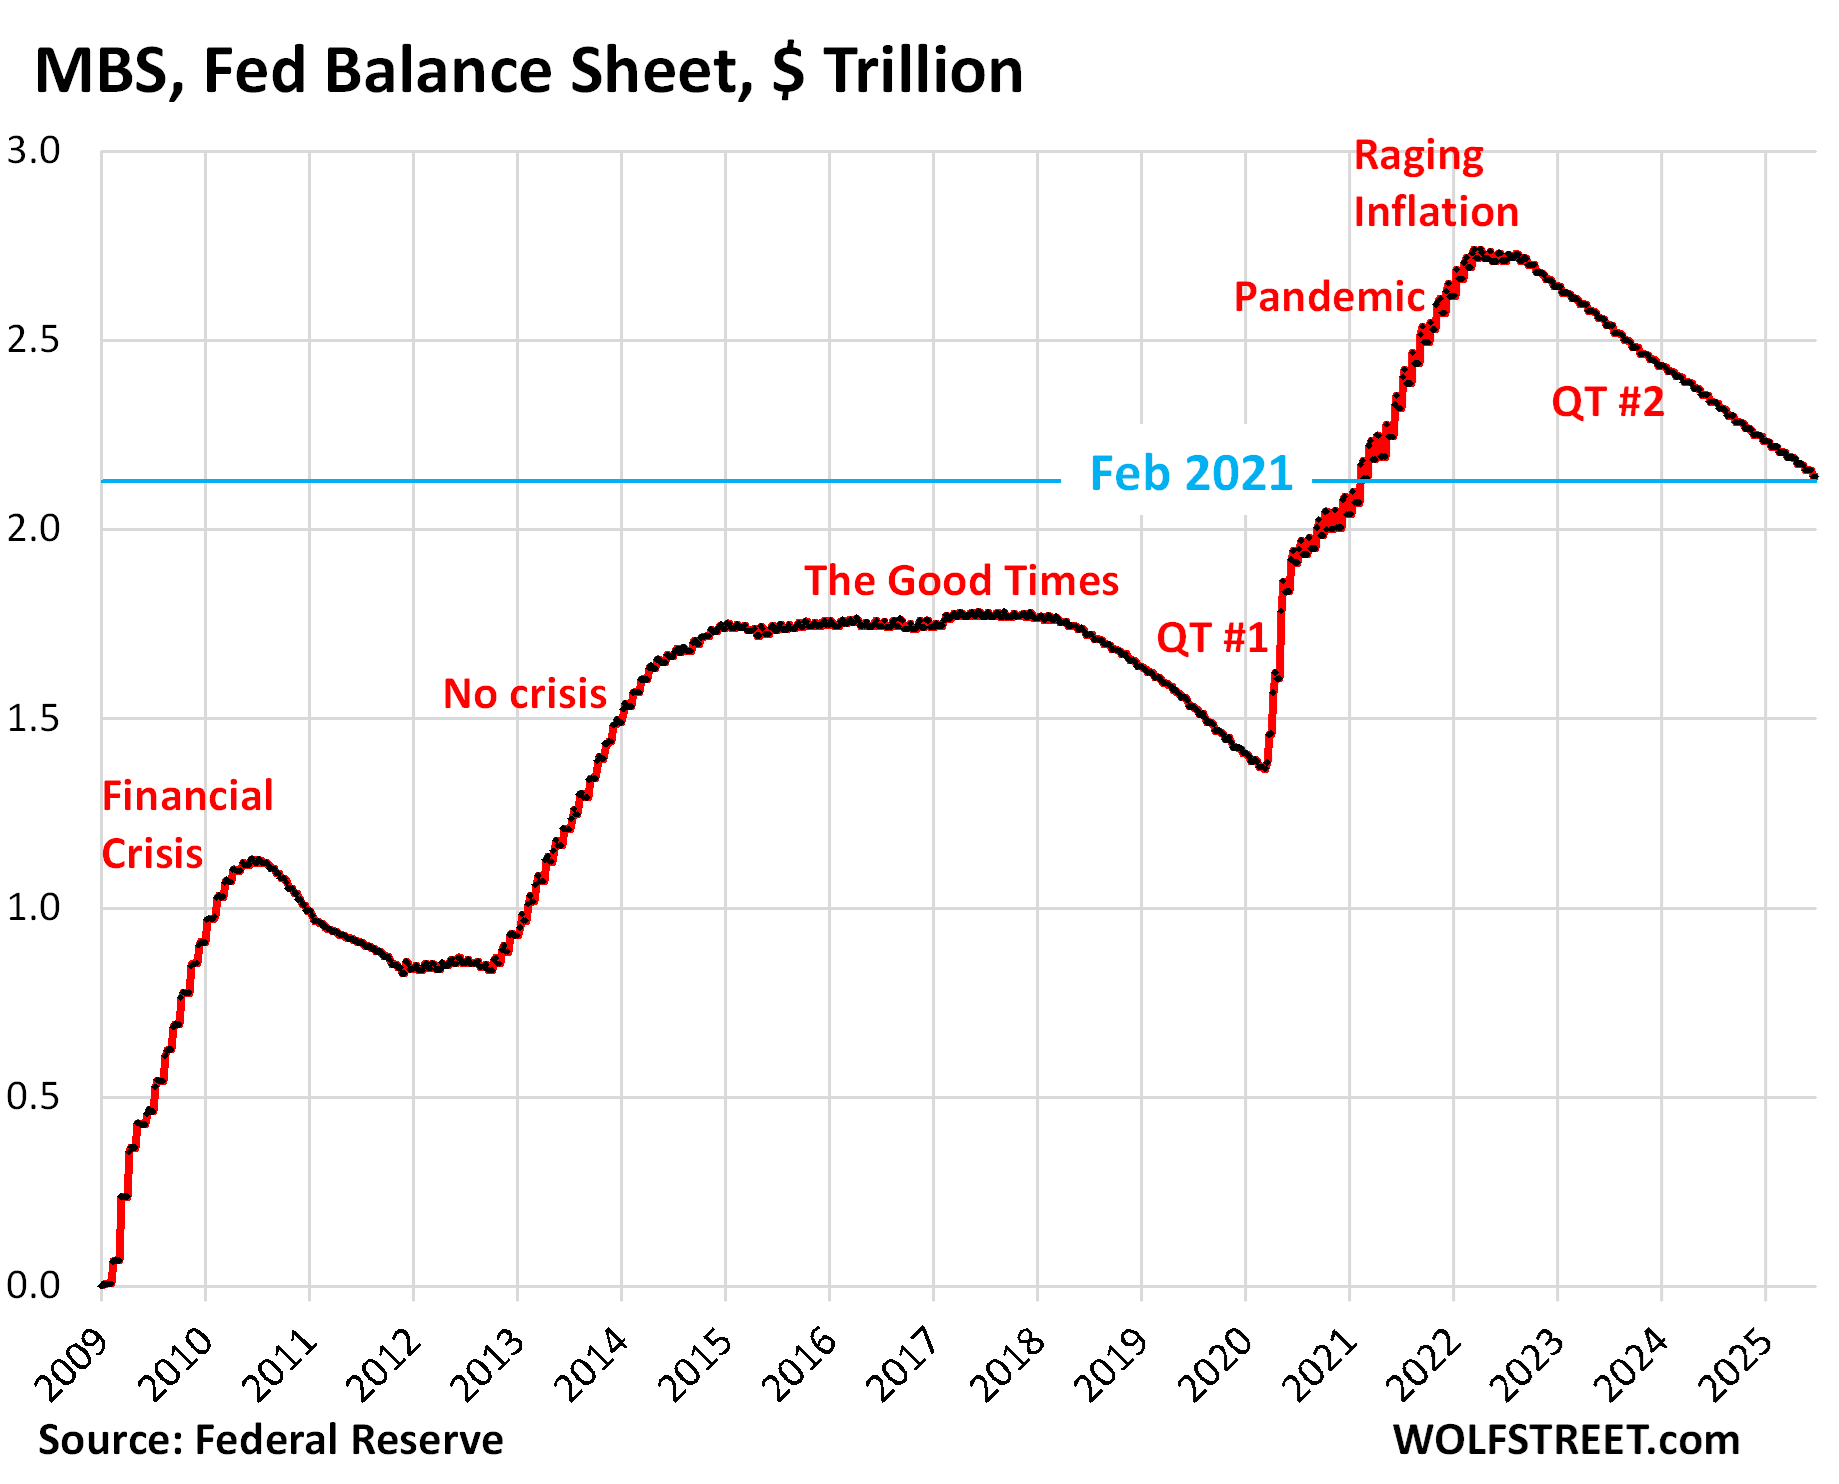
Mortgage-Backed Securities (MBS): -$17.7 billion in June, -$602 billion from the peak, to $2.14 trillion, where they’d first been in February 2021.
The Fed has shed 22.0% of its MBS since the peak in April 2022, and 43.8% of the $1.37 trillion in MBS that it had added during pandemic QE.
The Fed holds only “agency” MBS that are guaranteed by the government, where the taxpayer would eat the losses when borrowers default on mortgages.
MBS come off the balance sheet primarily via pass-through principal payments that holders receive when mortgages are paid off (mortgaged homes are sold, mortgages are refinanced) and as mortgage payments are made. But sales of existing homes have plunged and mortgage refinancing has collapsed, and far fewer mortgages got paid off, and passthrough principal payments to MBS holders have slowed to a trickle. As a result, MBS have come off the Fed’s balance sheet at a pace that has been mostly in the range of $14-18 billion a month.
The pace of the MBS reduction is not limited by the Fed. If pass-through principal payments were to become a torrent again during a refi boom, the Fed would re-invest any pass-through principal payments above $35 billion a month in Treasury securities, and total QT would reach $40 billion a month, the theoretical maximum under the current QT regime.
Bank liquidity facilities:
The Fed has three bank liquidity facilities. There was little activity in June. The Fed has been exhorting banks to start practicing using these facilities with “small value exercises,” or at least get set up to use them, and pre-position collateral so that they could use them quickly.
- Central Bank Liquidity Swaps ($37 million)
- Standing Repo Facility, or SRF ($0 million).
- Discount Window: $6.4 billion, up by $3.5 billion from a month ago. A year ago, it was at the same level. During the SVB panic, it had spiked to $153 billion.
The SRF swung into action on June 30 for one day. The weekly balance sheet presents the Fed’s holdings as of the close of business on Wednesday. The balance sheet is then published on Thursday afternoon. On today’s balance sheet, reflecting Wednesday July 2, the balance of the SRF was zero.
On June 30, at the end of the quarter, the SRF was active for one day and had an overnight balance of $11 billion. Those repos matured the next day and were unwound, and by the end of the day, the balance was back zero. On Wednesday July 2, the day of the Fed’s weekly balance sheet, the balance was also zero.
The Fed has been urging approved banks to use the SRF and has worked on improving it, including by adding a morning auction as of June 26 just in the nick of time for the quarter-end, in addition to the classic afternoon auction. The idea is that banks can draw on the SRF and then lend the proceeds to the regular repo markets when liquidity pressures push up repo rates above the Fed’s minimum bid rate (currently 4.5%), to profit from the spread.
And this apparently happened at the end of the quarter for one day. The daily SRF data from the New York Fed shows this action: $11 billion for one day on June 30.
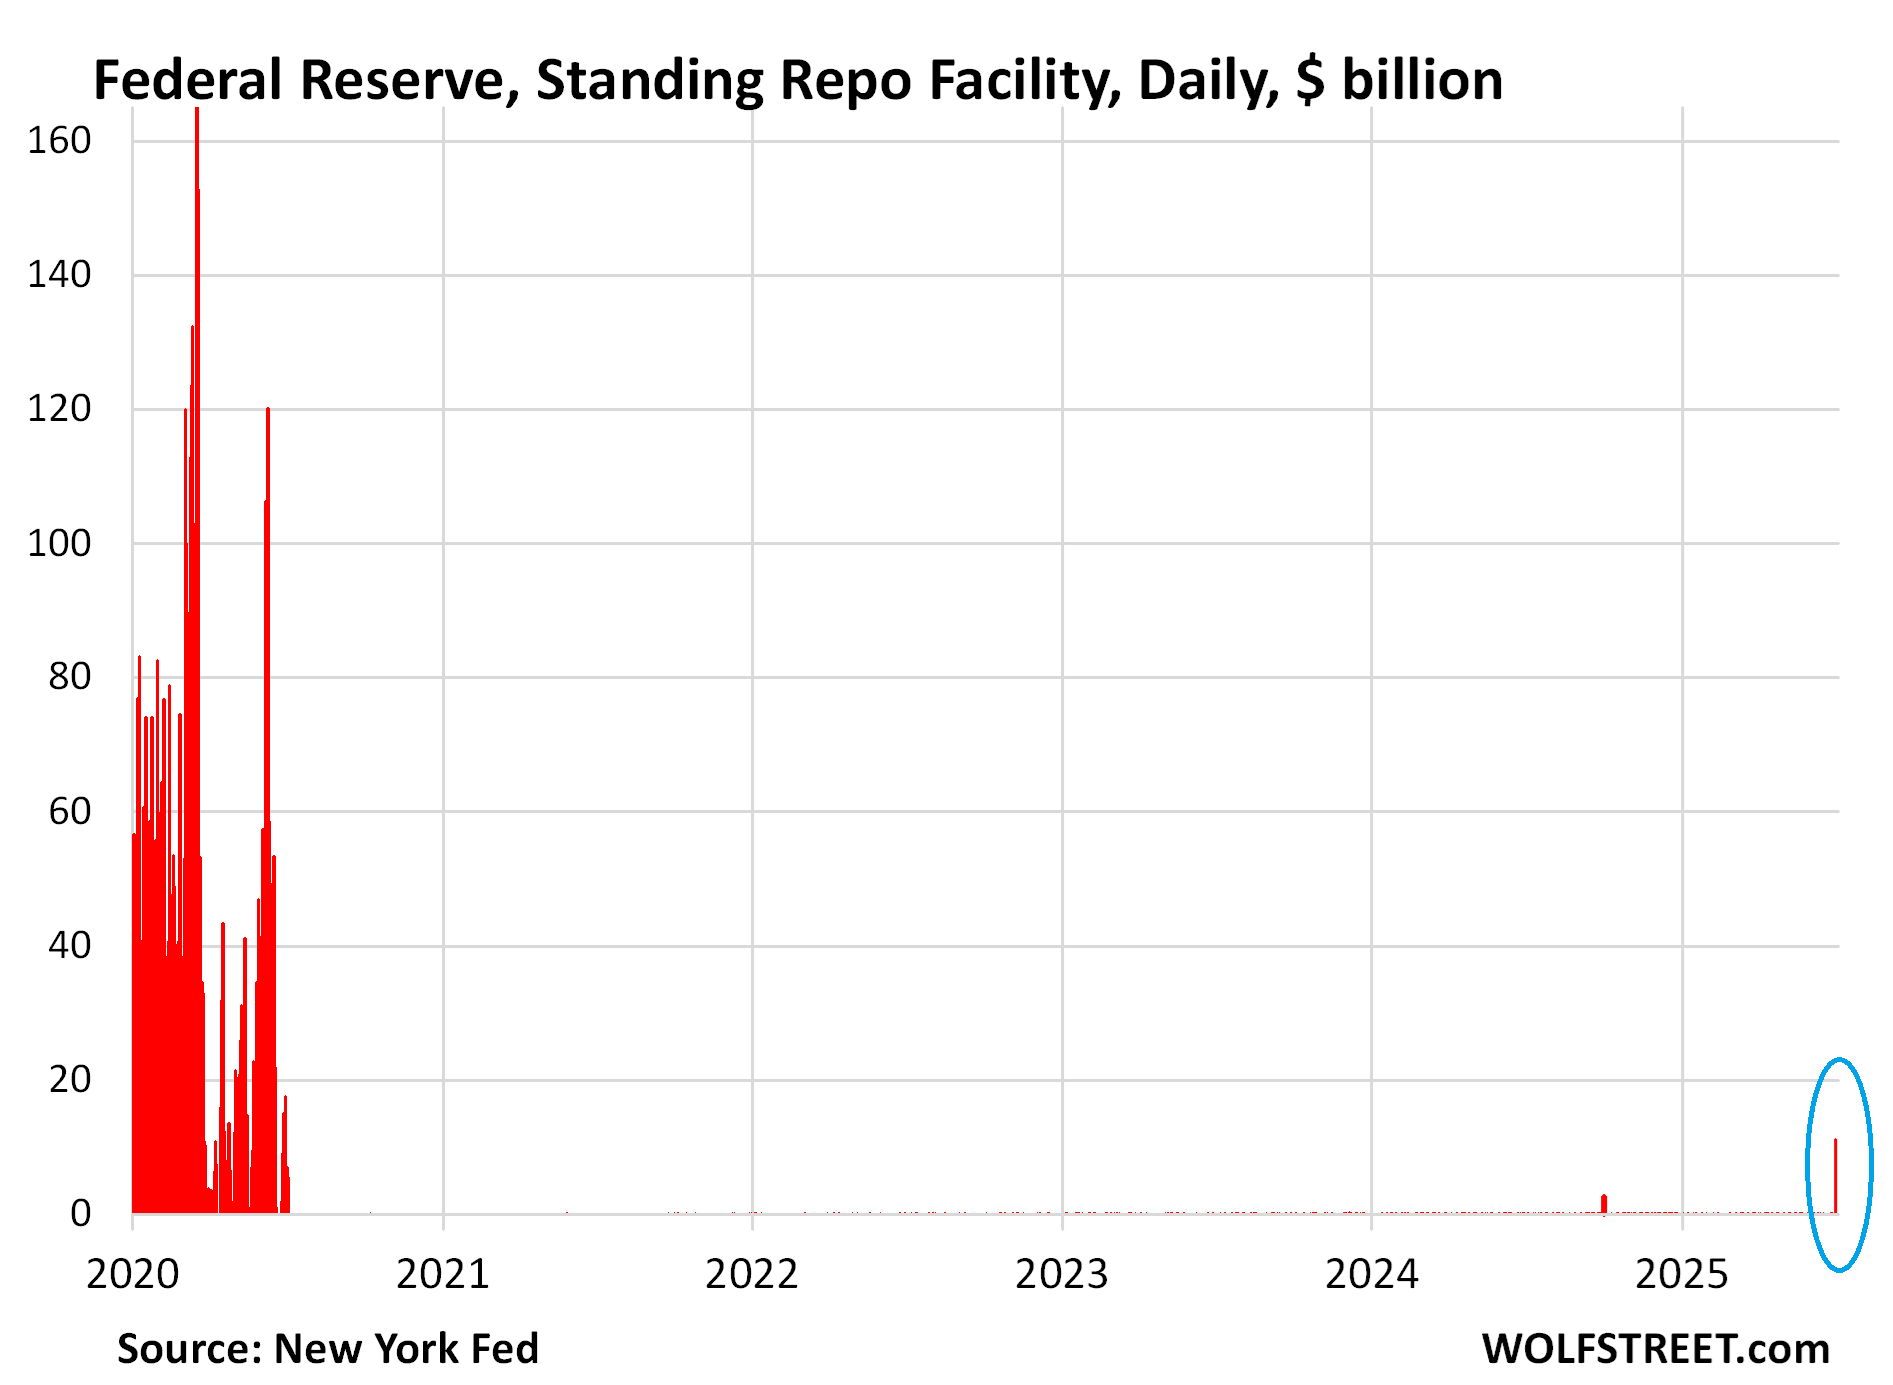
The SRF was revived in July 2021, after Bernanke had killed it in 2009, and is designed to avoid another repo market blowout, like the one in the fall of 2019, when repo market yields exploded 10% as banks refused to lend to the repo market. To calm it down, the Fed then ended up undoing a big part of the 2017-2019 QT. This taught the Fed a lesson, and now it has the SRF to avoid that fate.
Enjoy reading WOLF STREET and want to support it? You can donate. I appreciate it immensely. Click on the mug to find out how:

![]()
Perhaps dumb question but how does the recent debt ceiling increase play into the picture? I assume not much as demand seems high for treasuries and if not just would mean higher yields.
https://wolfstreet.com/2025/05/11/how-the-debt-ceiling-is-now-pouring-liquidity-into-financial-markets-only-to-suck-it-back-out-very-fast-later-this-year/
Thanks!
So… we all live happily everafter???
Wolf, are treasury interest payments offsetting QT? Yes, the Feb balance sheet is decreasing, but does that translate into pure liquidity draining or do other factors offset it, like treasury interest payments or other?
Also, any ideas why the ON RRPO balance has slowly been growing over the last several months? Was declining consistently but has a slight upwards trend in recent months that I don’t understand.
1. “are treasury interest payments offsetting QT?”
No, the Fed destroys the cash it receives from interest payments (the Fed doesn’t have a “cash” account; instead it creates cash to pay for something and destroys cash when it gets paid).
But TIPS pay interest PLUS inflation protection. The Fed destroys the interest, but the inflation protection is added to the principal and not paid in cash, so the Fed cannot destroy it until it receives it when the TIPS mature.
In mid-July, $8 billion in TIPS mature and the Fed gets paid the $8 billion plus the added $2.8 billion in inflation protection as part of the redemption (total nearly $11 billion). In theory, Treasury QT should then be over $6 billion ($5 billion in QT, minus ca $1.3 billion in inflation protection from other TIPS, plus redemption of $2.8 billion in inflation protection). But I’m not sure how the Fed will actually deal with it. That’ll be in my next balance sheet report on Thursday, August 7.
2. “why the ON RRPO balance has slowly been growing over the last several months”
Read this:
https://wolfstreet.com/2025/05/11/how-the-debt-ceiling-is-now-pouring-liquidity-into-financial-markets-only-to-suck-it-back-out-very-fast-later-this-year/
So, the Fed has taken 3 years to reduce their massive balance sheet by a measly 25%. My bet is that they are far more likely to hit $10 trillion before they ever get it down to $1 trillion. And those “regional bank failures” in 2023 were some of the largest in US history, and resulted in the US govt essentially guarantees all bank deposits. But no worries there. Our bankrupt Uncle Sam can always borrow more money.
Well, it’s never going down to a trillion again because it can’t – Wolf has explained this. However, you are correct, “up like a rocket, down like a feather” is the FED’s modus operandi. It’s disgusting, quite frankly. They’re disgusting.
The Fed’s assets cannot ever get back to “$1 trillion.” The Fed’s assets ALWAYS grew before QE with cash in circulation (liability on the Fed’s balance sheet). A balance sheet has to balance: assets = liabilities + capital. ALWAYS. As the Fed’s liabilities grow, it’s assets HAVE to grow.
The Fed NOW has five big liabilities. Three of them are demand-based and the Fed doesn’t control that demand. Only the first two — reserves and ON RRPs — are a reaction to QE/QT;
1. Reserves (cash that banks deposit at the Fed). Always must have a substantial balance, see below.
2. Overnight reverse repurchase agreements (ON RRPs) with domestic counterparties (cash from money market funds and other domestic entities). That can and will go to near zero.
3. Currency in circulation (paper dollars in pockets and under mattresses globally) – demand based, as you step up to the ATM, you want the ATM to have the paper dollars that you want to withdraw.
4. Treasury General Account (TGA), the government’s checking account. Demand based. That balance is decided by the US government. Before 2009, it was with JP Morgan and other banks, but during the Financial Crisis, it was moved to the New York Fed. So that instantly increased the Fed’s balance sheet.
5. Reverse repurchase agreements with foreign official counterparties. Where they park their dollar cash. Demand based.
Please read this:
https://wolfstreet.com/2024/03/23/the-feds-liabilities-how-far-can-qt-go-whats-the-lowest-possible-level-of-the-balance-sheet-without-blowing-stuff-up/
Reserves CANNOT go to zero because those are the banks’ account balances at the Fed with which they pay each other trillions of dollars every day in transactions. When you buy stocks through your broker, that cash you pay to settle the purchase goes through the banks’ reserve accounts, even if your broker is not a bank. When a big merger closes and $500 billion in cash are paid, that $500 billion goes through the reserve accounts, from one bank to the other bank. Given the trillions of dollars a day in banking transactions, the reserve balances will always be significant, but they can be a lot lower than today. That’s what QT can accomplish.
The balance sheet is now down to what probably shoulda/coulda/woulda been the post pandemic peak, that created the wild excesses that (probably) drove the first wave of inflation to the crest.
At the current pace, the unwinding of the 12 year MBS experiment will be completely unwound in a total of approximately… 12 years?
The next wave of inflation will be the continuous erosion of confidence in any type of fiscal responsibility, as evidenced by a complete lack of concern for a balanced budget, let alone overall debt reduction (or even leveling for that matter?).
Which will happen more quickly? Inflating away my purchasing power or the government debt? Rhetorical question.
Is this a bad event? Does it represent a liquidity concern with the banks? I’m confused by the number of times it shows up on your last chart. The previous times were during crunches.
If you are convinced, like I am, that QE is a terrible and destructive policy, then the SRF (last chart) is a good thing. That’s how the Fed used to deal with crises, such as 9-11, before QE.
Repos are overnight and unwind the next day. If they’re not renewed, they vanish automatically and don’t cling to the balance sheet for years and decades, like long-term Treasuries do. So if there is a liquidity squeeze somewhere, the banks can borrow at the SRF, supply liquidity to the squeezed area where rates are high, and make money off the spread. When the liquidity squeeze is over, the SRF goes back to zero.
The Fed should have never done QE. It should have just kept the SRF active and let it resolve on a temporary basis the urgent problem.
During 9-11, the stock market, the bond market, and other markets shut down for days, and that was a huge issue, and the Fed’s SRF supplied lots of liquidity, and after three weeks, it was all resolved, and nothing clung to the balance sheet. That’s how crises are supposed to be handled.
I’m glad to see the SRF back in operation. It tells me that the Fed is looking for ways to permanently get away from QE and go back in a modified version to how it used to do things before QE.