The Fed improves its Standing Repo Facility to prevent another repo market blowout as the balance sheet continues to drop.
By Wolf Richter for WOLF STREET.
Total assets on the Fed’s balance sheet declined by $36 billion in May, to $6.67 trillion, the lowest since April 2020, according to the Fed’s weekly balance sheet today.
Since peak balance sheet at end of QE in April 2022, the Fed’s QT has shed $2.29 trillion, or 25.6% of its total assets.
In terms of Pandemic QE, it has shed 47.7% of $4.81 trillion in assets it had piled on from March 2020 through April 2022.
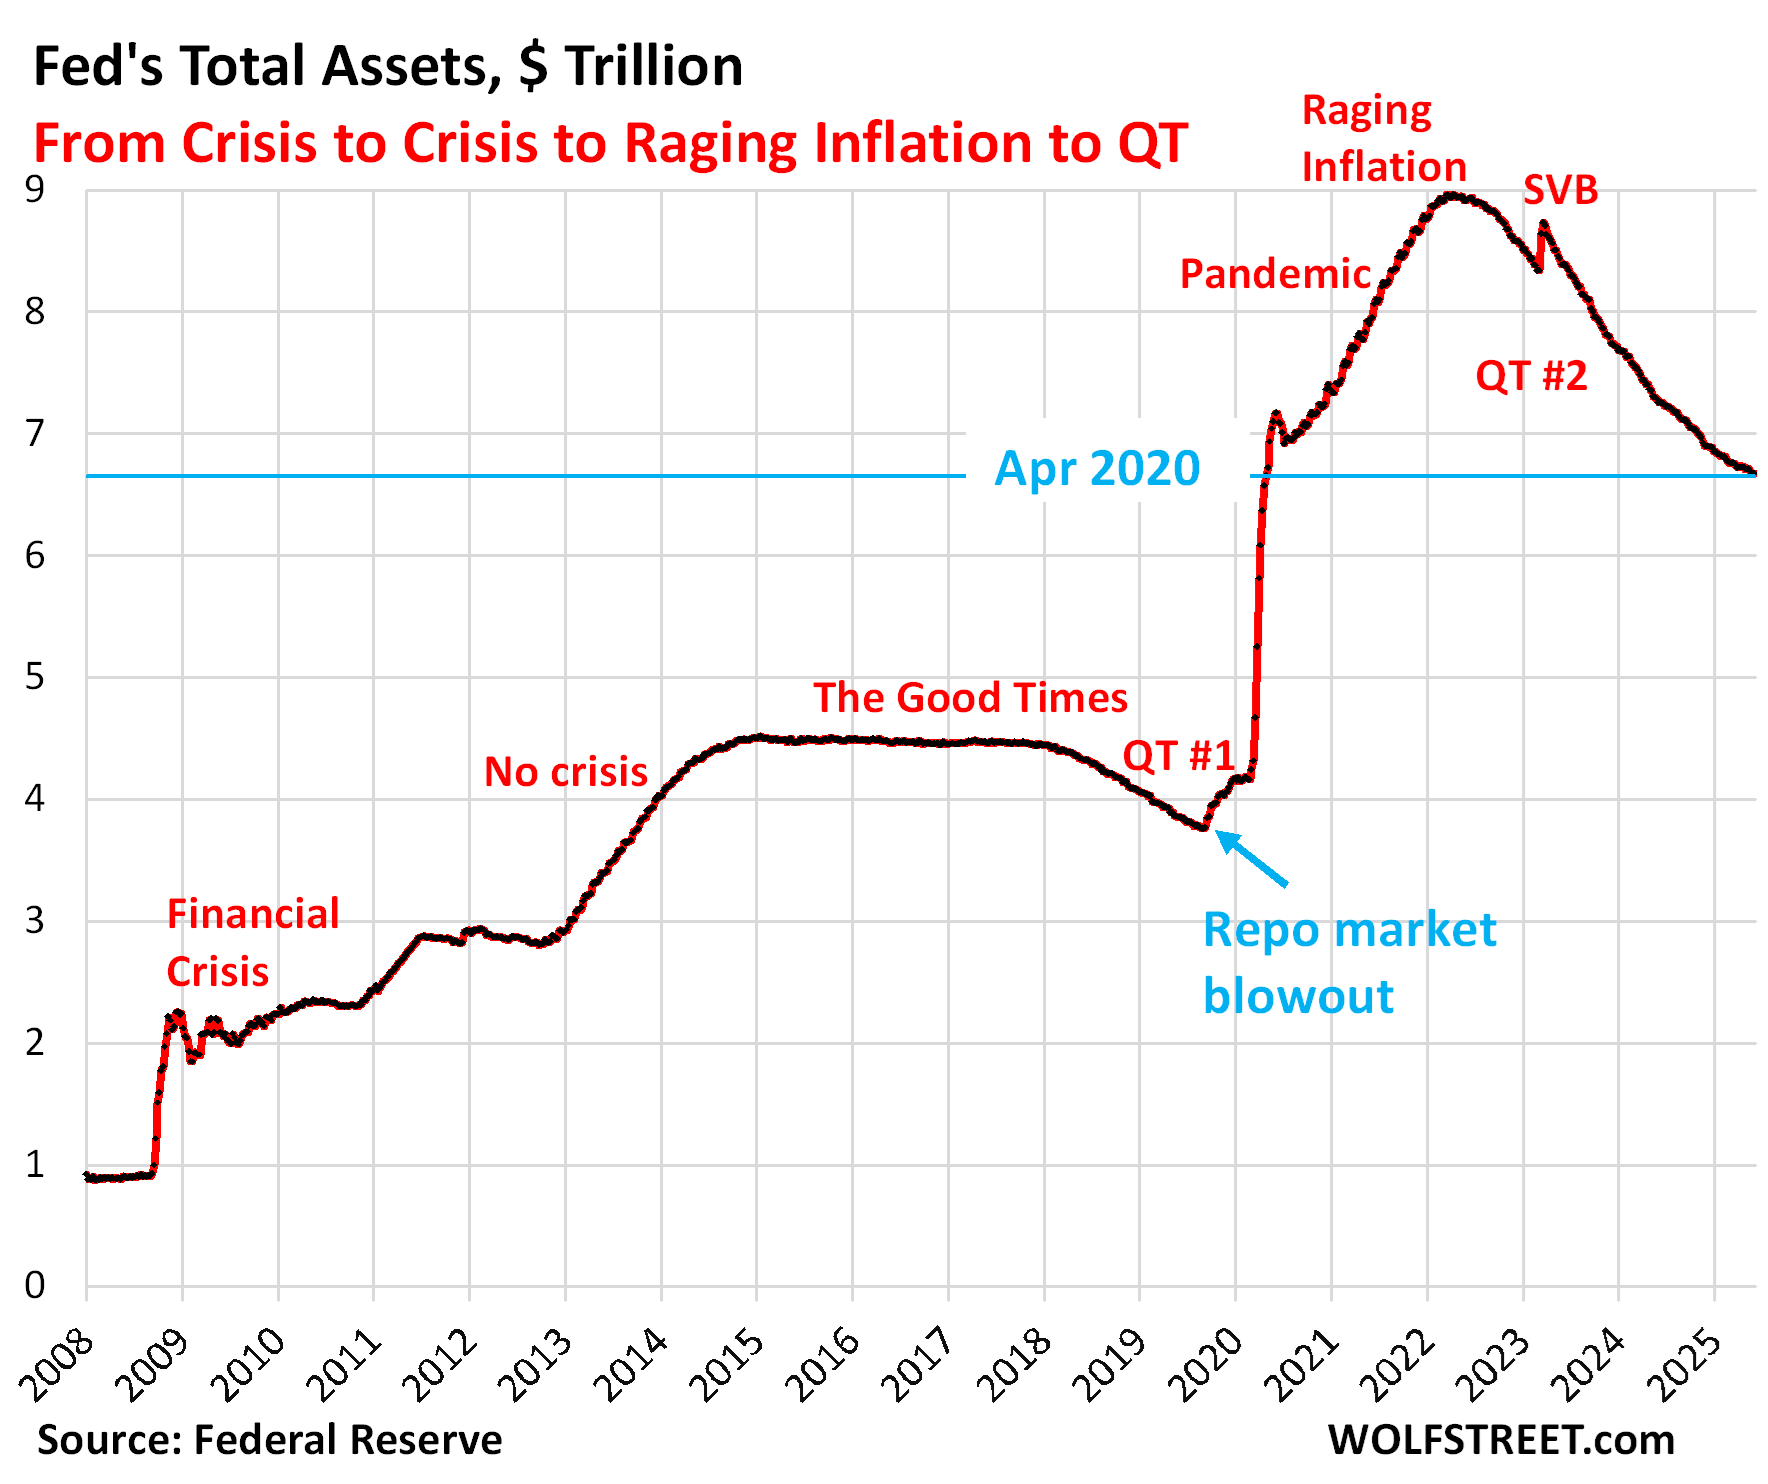
In April 2020, the Fed had piled $1.47 trillion in securities onto its balance sheet, in just that month. To get to a pre-April 2020 balance sheet, QT would have to run for another $860 billion, on top of the $2.29 trillion already under its belt, for a total of $3.15 trillion in QT, to bring total assets below the $5.81 trillion where they’d been at the beginning of April 2020.
At the recently reduced average pace of $20 billion a month, it would take 43 months. QT has already been going on for 35 months, and nothing outside of a few regional banks, led by SVB, has blown up yet.
QT assets.
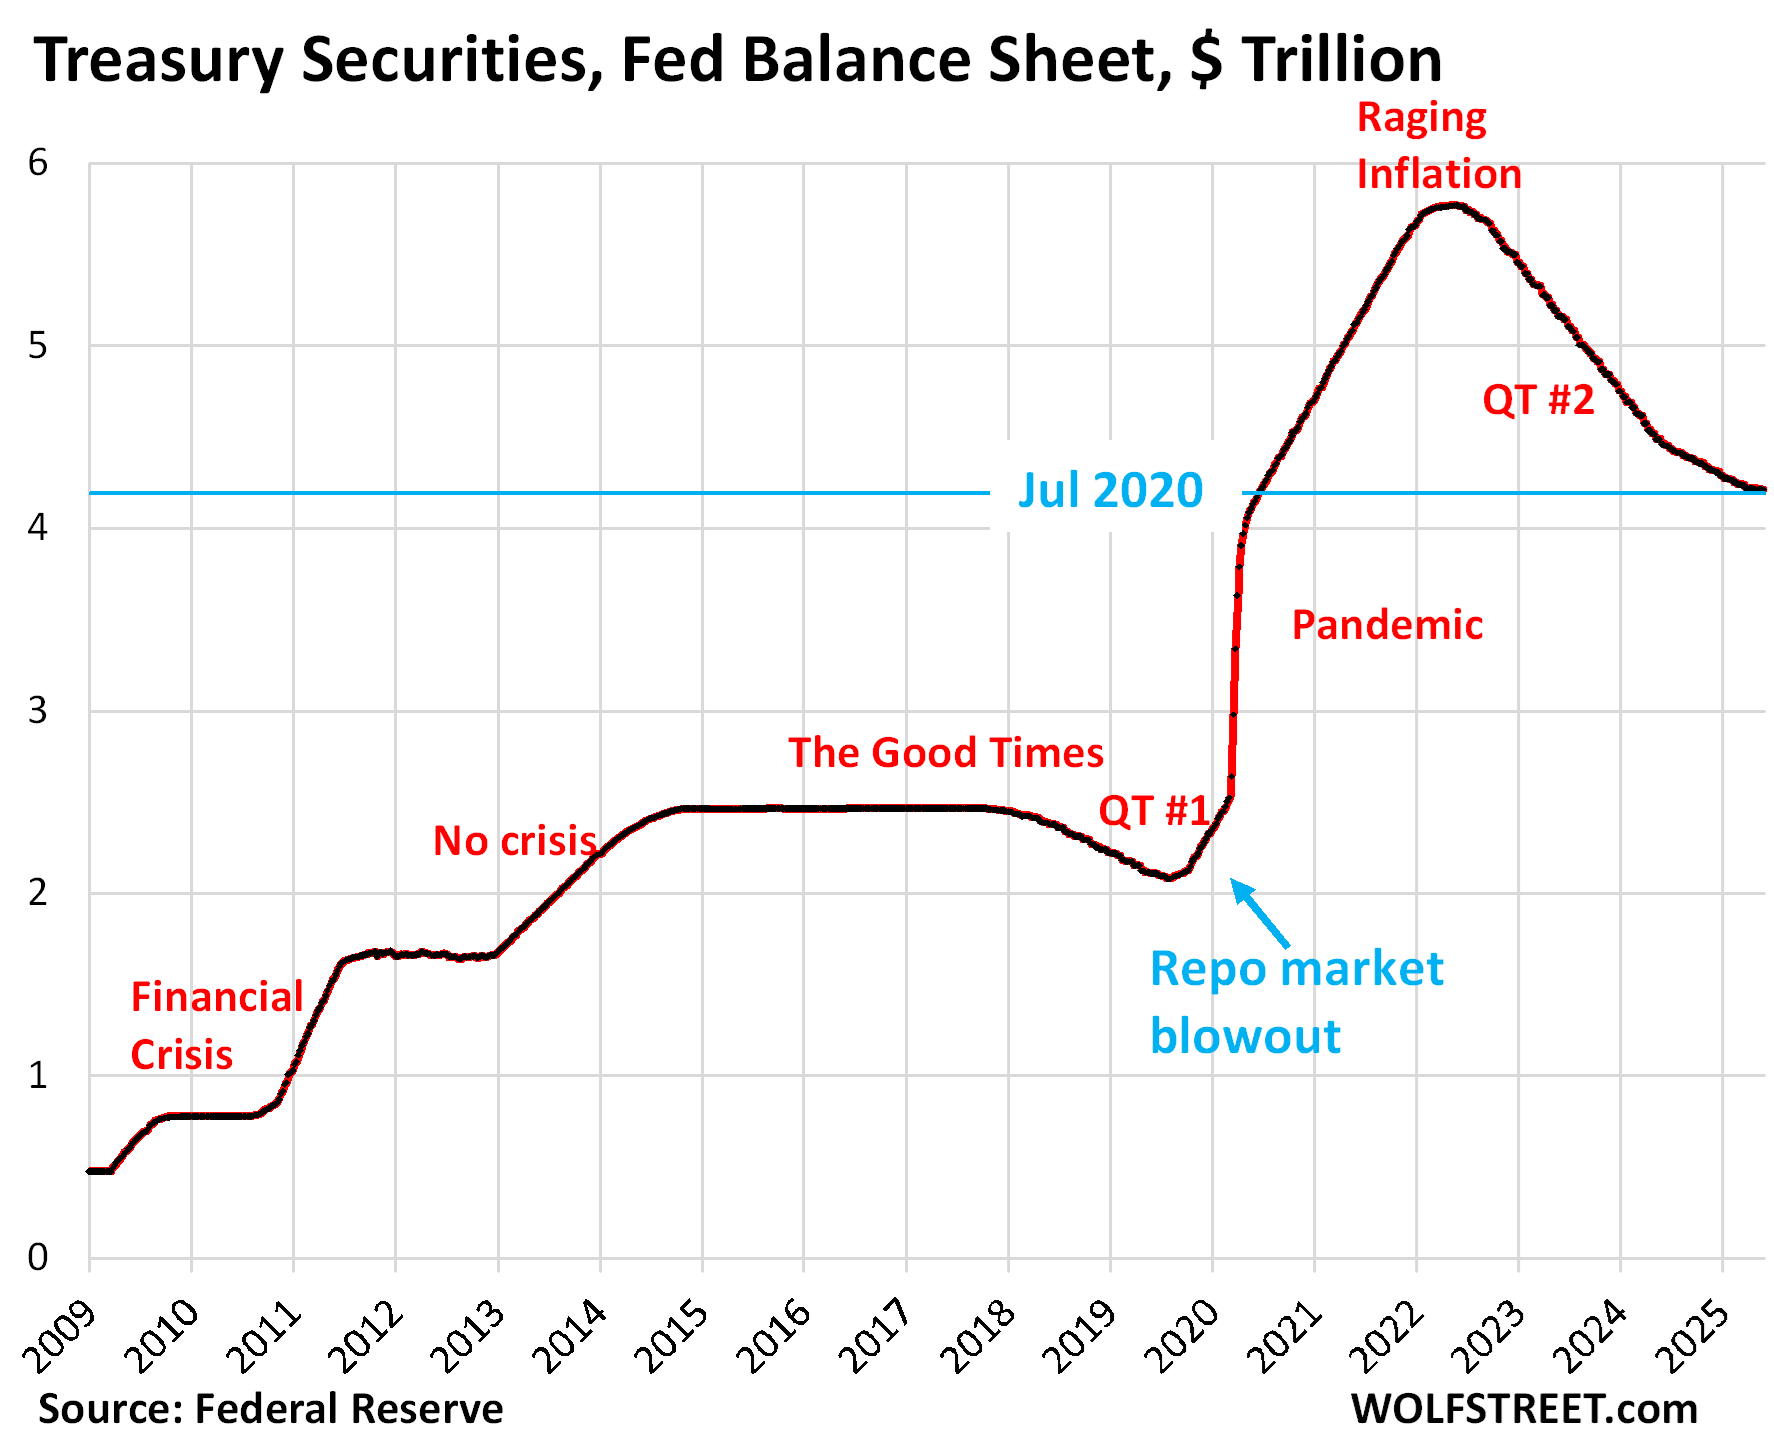
Treasury securities: -$3.7 billion in April, -$1.56 trillion from peak in June 2022 (-27.0%), to $4.21 trillion, the lowest since July 2020.
During pandemic QE, the Fed had piled on $3.27 trillion in Treasury securities. It has now shed 47.7% of that.
Treasury notes (2- to 10-year) and Treasury bonds (20- & 30-year) “roll off” the balance sheet mid-month and at the end of the month when they mature and the Fed gets paid face value.
Given the Fed’s huge Treasury holdings ($4.21 trillion), large amounts of securities mature every month. The Fed gets paid for them, and they come off the balance sheet. If the Fed didn’t do anything, its holdings would shrink rapidly. To limit the monthly shrinkage of its holdings and thereby the liquidity drain on the financial markets, it reinvests a portion of the proceeds from maturing securities into new securities that it buys at auction. The remainder “rolls off” the balance sheet and reduces the balance sheet. As of April, the roll-off has been lowered to $5 billion a month. The overage is re-invested.
Included in the Fed’s Treasury holdings are $424 billion of Treasury Inflation Protected Securities (TIPS). The amount of inflation protection that TIPS holders receive is not paid in cash but is added to the TIPS balance to be paid when the TIPS mature. So the Fed’s TIPS balance grows with the inflation protection. In May, the Fed received $1.13 billion in inflation protection, which was added to the TIPS balance, which had the effect of reducing the roughly $5 billion in Treasury roll-off to $3.7 billion.
The chart shows the effects of slowing Treasury QT from $60 billion a month initially, to $25 billion a month starting in June 2024, and to $5 billion starting in April 2025.
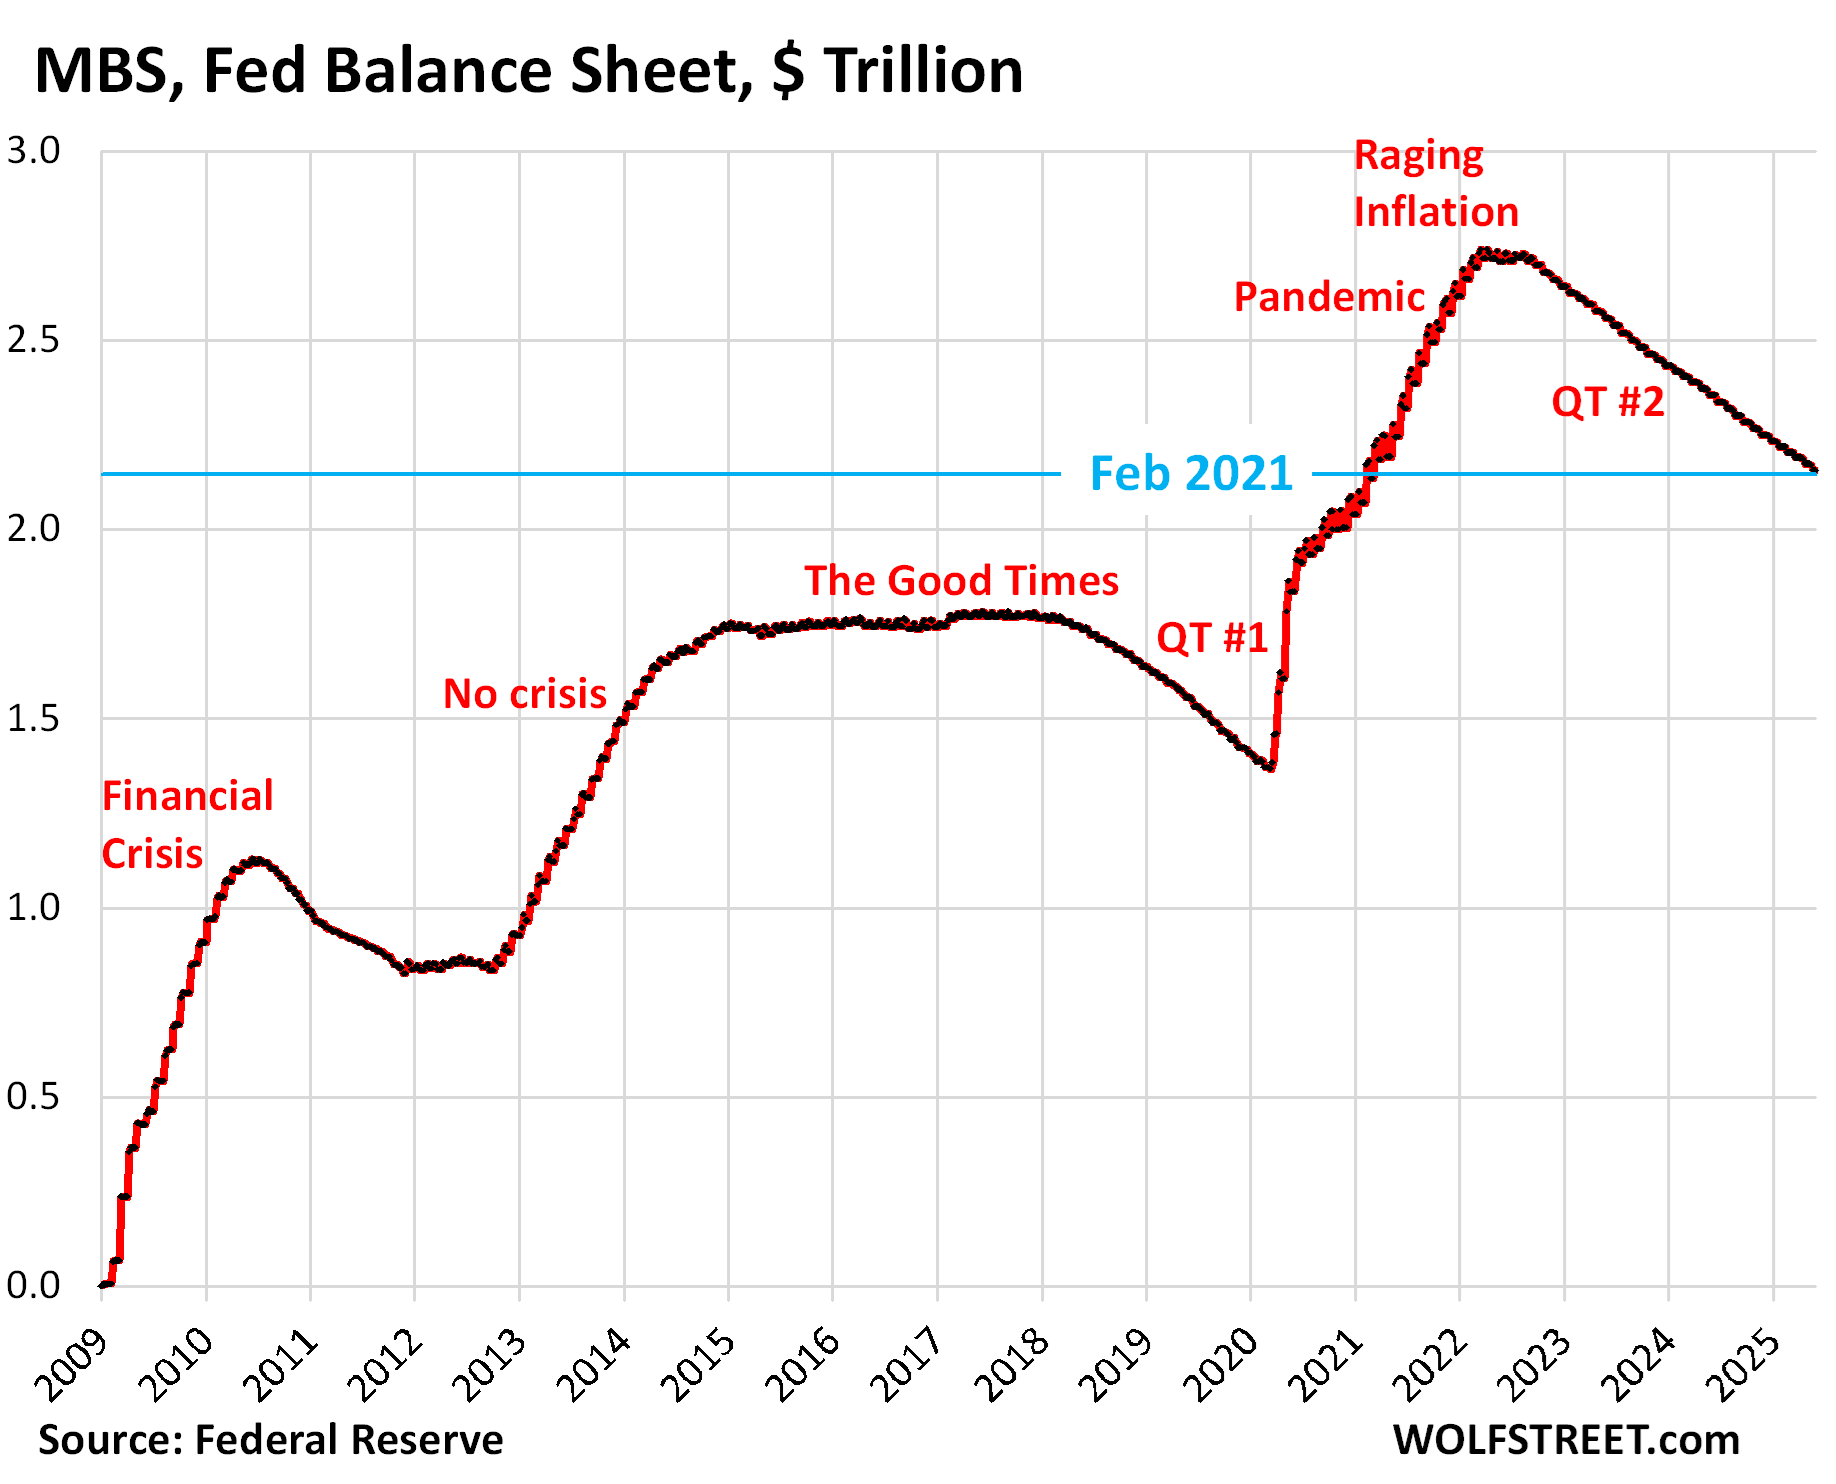
Mortgage-Backed Securities (MBS): -$16.8 billion in May, -$584 billion from the peak, to $2.16 trillion, where they’d first been in February 2021.
The Fed has shed 21.3% of its MBS since the peak in April 2022, and 42.5% of the $1.37 trillion in MBS that it had added during pandemic QE.
The Fed holds only “agency” MBS that are guaranteed by the government, where the taxpayer would eat the losses when borrowers default on mortgages, not the Fed.
MBS come off the balance sheet primarily via pass-through principal payments that holders receive when mortgages are paid off (mortgaged homes are sold, mortgages are refinanced) and as mortgage payments are made. But sales of existing homes have plunged and mortgage refinancing has collapsed, and far fewer mortgages got paid off, and passthrough principal payments to MBS holders, such as the Fed, have slowed to a trickle. As a result, MBS have come off the Fed’s balance sheet at a pace that has been mostly in the range of $14-17 billion a month.
The pace of the MBS reduction is not limited by the Fed, and if pass-through principal payments were to become a torrent again, as they had during the refi boom in 2020-2022, the Fed would re-invest any pass-through principal payments above $35 billion a month in Treasury securities. In that event, total QT would reach $40 billion a month, the theoretical maximum under the current setup.
Bank liquidity facilities: inactive.
The Fed has three bank liquidity facilities. They were essentially inactive in May. The Fed has been exhorting banks to start practicing using these facilities with “small value exercises,” or at least get set up to use them, and pre-position collateral so that they could use them quickly.
- Central Bank Liquidity Swaps ($16 million)
- Standing Repo Facility ($1 million)
- Discount Window: $2.9 billion, down by $0.6 billion from a month ago. During the SVB panic, it had spiked to $153 billion.
What else contributed to the $36 billion decline in assets?
The balance sheet declined in total by $36.4 billion in May. But Treasury securities declined by only $3.7 billion and MBS by $16.8 billion, for a combined decline of $20.5 billion.
Another $13.6 billion of the $36.4 billion decline came from changes in these three accounts:
Discount Window borrowing fell $0.6 billion, as noted above.
“Other assets” fell by $10.6 billion.
This $10.6 billion decline consisted mostly of accrued interest from its bond holdings that the Fed had set up as a receivable (an asset) previously, and that it was paid in May. When the Fed receives interest payments, it destroys that money and it comes off the balance sheet, and the account declines by that amount (the Fed doesn’t have a “cash” account, like companies do; it creates money when it pays for something and destroys money when it gets paid).
This account also includes “bank premises” and other accounts receivables and will always have some balance.
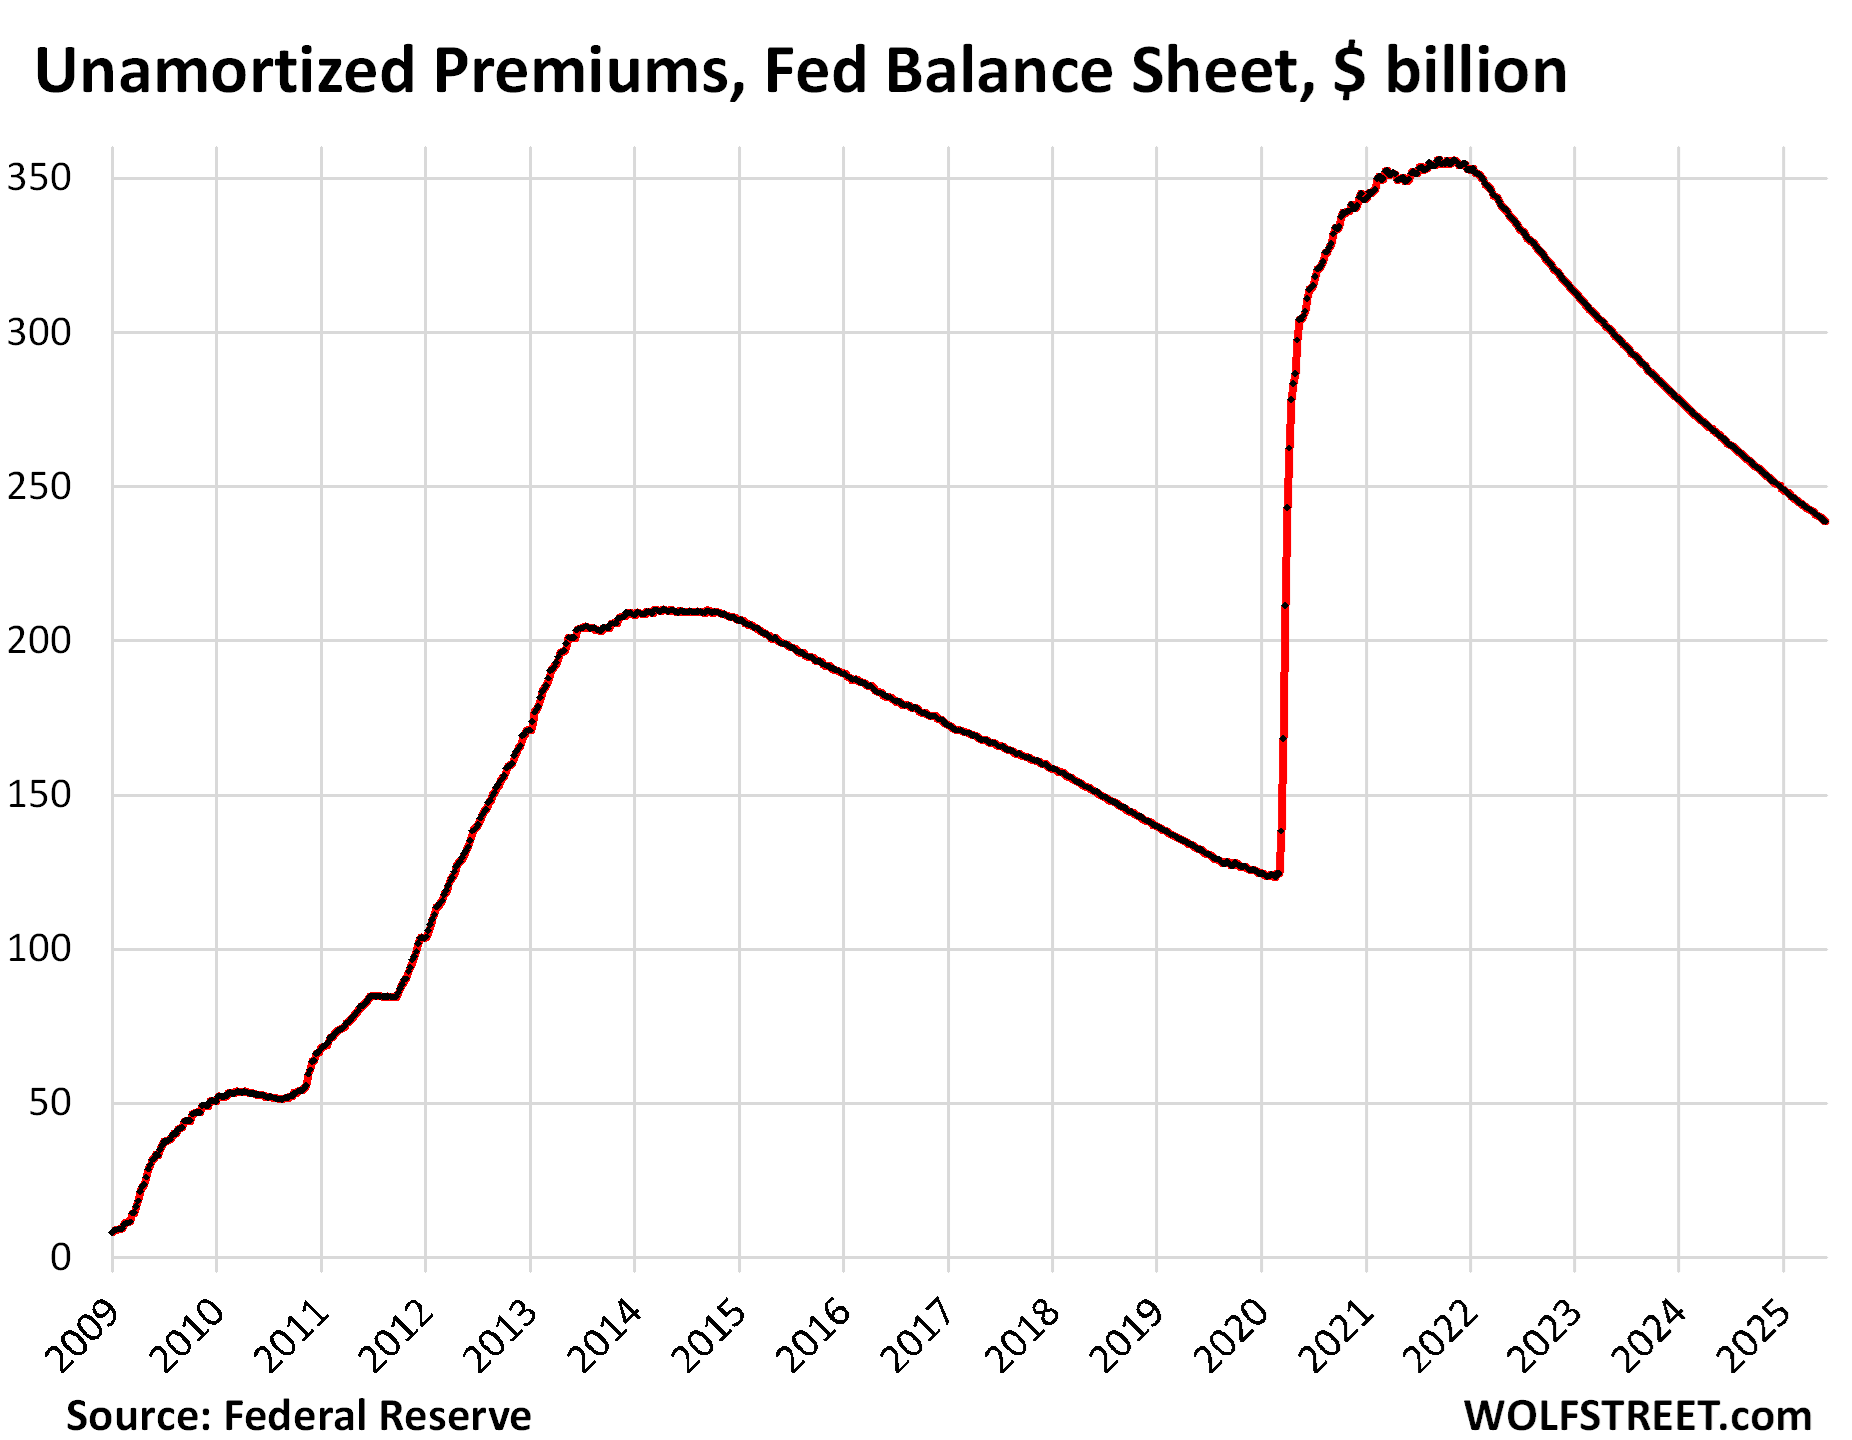
“Unamortized premiums” fell by $2.4 billion.
Unamortized premiums are a regular accounting entry with which the Fed writes off the premium over face value it had to pay for bonds during QE that had been issued months or years earlier with higher coupon interest rates and that had gained value as yields dropped before the Fed bought them. Like all institutional bondholders, the Fed amortizes that premium over the life of the bond. The remaining balance of unamortized premiums is now down to $239 billion, from $356 billion at the peak in November 2021:
Not another repo-market blowout, please.
The assets-to-GDP ratio. Before the QE era began in 2009, the Fed’s balance sheet grew over the years roughly in line with the economy as measured by “current dollar” GDP (neither balance sheet nor GDP adjusted for inflation). This assets-to-GDP ratio was 6.0% in 2008.
QE drove the ratio to 25% by December 2014. As QE stopped and the balance sheet remained flat while GDP kept growing, the ratio fell. QT-1 in 2018 and 2019 accelerated the decline of the ratio, until it hit 18% in Q2 2019 and fell below 18% in Q3 2019…
And then the repo market blew out. Oh goodness, what a mess that was. The Fed stepped back in, and by December 2019, the ratio had risen to 19%.
During pandemic QE, the assets-to-GDP ratio spiked to 35.5% in Q2 2020 as GDP collapsed while the Fed’s balance sheet exploded. As GDP bounced back, the ratio dropped for one quarter, but then the GDP bounce-back slowed while QE continued faster than GDP rose, and the ratio returned to 35.4% in Q1 2022, when QE stopped.
After three years of economic growth since Q1 2022 and $2.29 trillion in QT, the ratio has now dropped to 22.3%, just above where it had first been in Q3 2013.
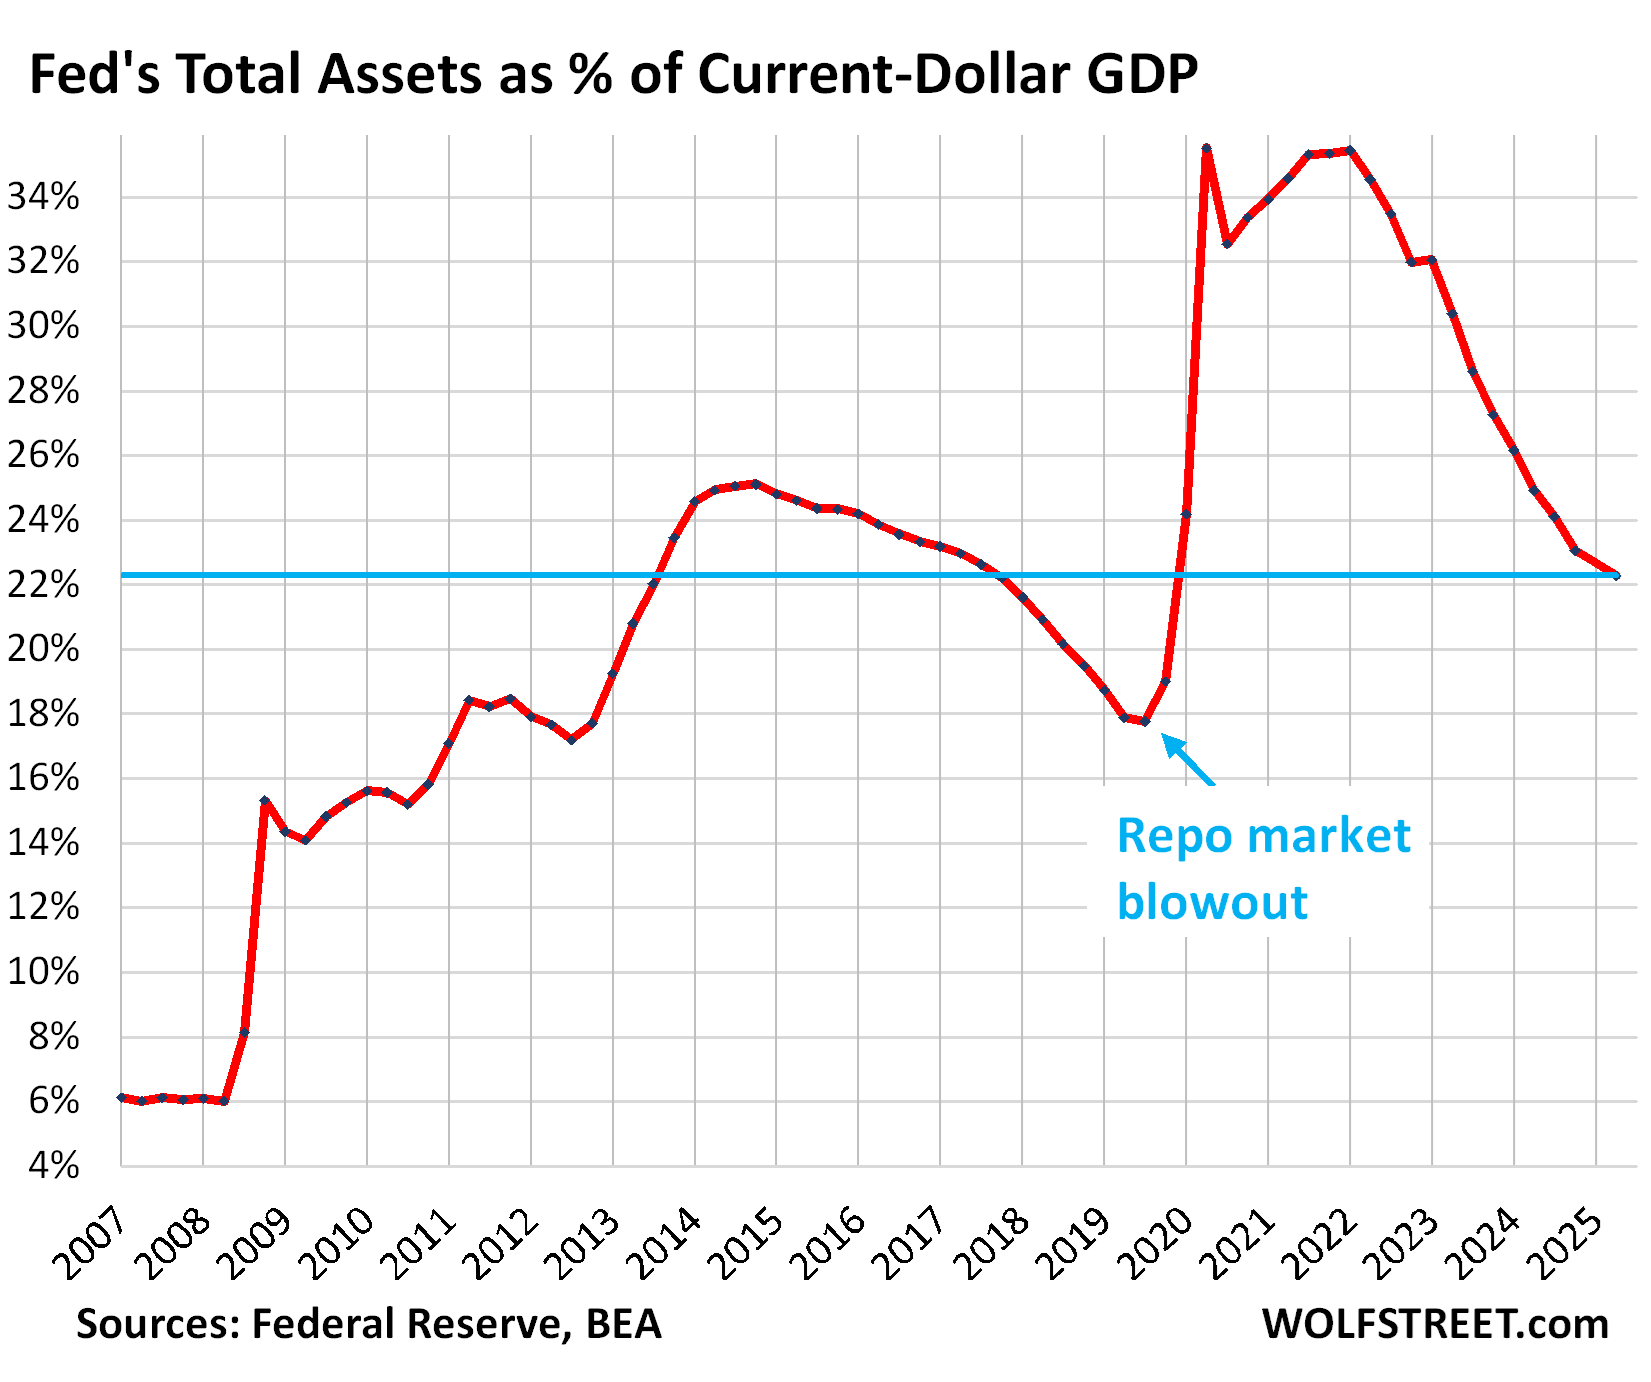
We note with a lopsided smile: When the ratio dropped below 18% in September 2019, the repo market blew out, and the Fed stepped back into it by loading up its balance sheet again, this time with repos. Which taught the Fed a lesson. And it has talked a lot about it.
So in July 2021, it revived the Standing Repo Facility (SRF), which it had scuttled in 2009. It then worked to improve the SRF, including by adding an auction in the morning, in addition to the afternoon auction, so that banks could use it more easily to deal with any ripples in liquidity flows.
The daily morning auctions will start on June 26 with an aggregate operation limit of $500 billion.
The afternoon auction currently has an aggregate operation limit of $500 billion, but when the morning auction becomes operational, the limit of the afternoon auction will be reduced by the accepted amount of the morning auction. In other words, the combined total from both auctions remains at $500 billion.
Banks are not using the facility at the moment because the Fed’s minimum bid rate (currently 4.5%) is generally higher than the repo market rate. But they can use it, and it would make sense for them to use it, and they could profit from using it, if rates in the repo market rise above the Fed’s minimum bid rate, as the banks could borrow from the SRF and lend the proceeds to the repo market to profit from the spread, which would likely prevent another repo market blowout before it even got started.
But this issue is also why the Fed has slowed QT so much — to give liquidity plenty of time to move to where it’s needed without blowing something up.
Enjoy reading WOLF STREET and want to support it? You can donate. I appreciate it immensely. Click on the mug to find out how:

![]()
I haven’t read this yet Wolf, but man, I have been following your site for about a month now and I have learned a lot
I appreciate the time you spend on this stuff and breaking it down so well.
I also love your commentary in the comments. I’ll donate again!
Thanks Wolf.
Because of additional 10 Billions in Other category, more QT this month than anticipated.
I wish FED accounted for TIPs balance when they calculate monthly limit for Treasury Securities. So we will get Net 5 Billion consistently. 5 Billion is already very low amount. When QT limits was higher, those TIPs balance was lesser in %. Now its like 20-30% of monthly limit.
I understand they may not know May number in May. But they can use April (Prior month) TIPs balance. So if FED got 1.5 Billion in April, then FED will QT of 6.5 Billion in May. So Net result will be always 5 Billion.
I read that the Treasury is now buying old longer dated Treasury securities in the marketplace to support it’s bill/note auctions. Please comment, Wolf. This alarms me, the Treasury is now doing QE/QT? I thought this was the non-political province of the FED only.
Reverse operation twist, not QE.
They’ve been doing buybacks for a year, started by Yellen.
I discussed this last year a bunch of times, including in August and October.
October 2024:
https://wolfstreet.com/2024/10/25/treasury-buybacks-october-update-on-the-bond-market-bloodletting/
August 2024:
https://wolfstreet.com/2024/08/28/treasury-department-aggressively-pushes-down-long-term-interest-rates-via-shift-to-t-bill-issuance-and-bond-buybacks/
They’re buying back older notes and bonds, often at a massive discount, such as 70 cents on the dollar.
But they don’t have any cash to do that, so they have to sell new bonds (borrow more) to get the cash to buy the old bonds.
If you had read any of my articles about Treasury buybacks, you would understand that this is not QE, and sites or YouTubers that claim that the buybacks are QE are lying to you, and you should never go back to these stupid-ass liars. QE involves the creation of money. The Treasury cannot do that. It has to borrow money (by selling more Treasuries thereby increasing the Treasury auction sizes) to get the cash to buy back those old bonds.
This sounds more like a Ponzi scheme.
It’s only a Ponzi scheme when everyone wants to cash in the Treasuries at the same time.
OK…got that…so Treasury is selling more treasuries in order to buy more treasuries…if any third world country will do that, they will BK in short order…
Due to current US reckless spending-I wonder for how much longer the world will keep it’s blind faith in US dollar…..
Re: But they don’t have any cash to do that, so they have to sell new bonds (borrow more) to get the cash to buy the old bonds.
Here’s a question, possibly hidden in plain site:
When treasury has gone through buyback gymnastics in the past, were they also out of cash?
Seems like that activity, to have an empty cash account and then go on a relatively large spending spree is like a drunk sailor on ketamine using a canceled credit card.
Be that as it is, seems like a debt ceiling or some statutory regulation should prevent that activity from happening — seems contractually suspect, suspicious and illegal — but who am I to question pirate magic?
Redundant:
During periods when the government had a budget surplus looooooong ago, if ever, it might have been able to buy back Treasuries from its surplus without having to sell new Treasuries.
In terms of the debt ceiling, the math goes like this: They bought back $1 billion face-value of 2.37% 30-year bonds issued in 2021, and paid 61.8 cents on the dollar for them, so they paid $618 million for them (May 29 buyback auction), so they will need to sell only $618 million in securities (added to the debt) to buy back that $1 billion face-value of bonds (subtracted from the debt). So in effect, they lowered the debt outstanding by $382 million (+$618 million – $1.0 billion = -$382 million). This effect on lowering the debt by buying back the low-coupon-rate bonds of 2020-2022 was one of the reasons cited for the buybacks.
In terms of the interest expense, with this buyback, they replace $1 billion in 2.37% bonds (that cost the government 2.37% of $1 billion every year for 30 years = $23.7 million per year in interest) with, for example $618 million of 3-month T-bills that currently cost the government 4.34% a year (=$26.8 million). If the Fed cuts rates, they can refinance them at a lower rate and save some interest expense too. If rates rise in the future, it might increase the interest expense.
Sorry to be a (chronic) oain — but was just going over the possible origin of buybacks — still reading:
U.S. DEPARTMENT OF THE TREASURY’S DEBT BUYBACK PROPOSAL
106th Congress (1999-2000)
The original proposal was based on a budget surplus — and the mechanics of how to manage a government that was experiencing fewer debt problems.
There’s interesting old arguments as to the cost tradeoff of swapping maturities, in order to use current buybacks to achieve longer term efficiencies — but, turning that old argument 180 in this era of super expansive monster deficits, is really distorting and mutating reality.
The government then, had a surplus which allowed them to make a bet to save taxpayers future cash — versus today, when the government has a deficit of about $40 trillion, and betting with money they don’t have. If the current clowns get it all wrong, they make a black hole far worse for taxpayers. It’s like a ridiculous distraction that momentarily takes away focus on the vast amount of interest being paid for the growing debt problem — a few billion in swaps is like using a leaf blower in a hurricane — the buyback charade is stupid.
Nobody truly knows as they have never been audited, it wouldn’t be a surprise if they have 2 sets of books. They are serial bubble blowers and despotic in nature enabling waste, fraud and corporate, government criminality on a scale that Doge just shined a light on….tip of the iceberg…
“Nobody truly knows as they have never been audited,”
Ignorant BS. The Fed’s financial statements are audited EVERY YEAR!
The annual financial statements are audited, like those of any big company, by a big auditing firm. In the Fed’s case, they’re audited by KPMG. You can see the 2024 audited annual report here:
https://www.federalreserve.gov/aboutthefed/audited-annual-financial-statements.htm
The Federal Reserve System is also audited by government auditors. Here are the audits the Federal Reserve is subject to:
https://www.federalreserve.gov/publications/2023-ar-federal-reserve-system-audits.htm
Wolf how much did the FED add in the month of March 2020 to their balance sheet for reference?
Uh-oh! You just might get a RTGDFA! Or maybe a CTGDFC (check the charts).
I think the first chart answers your question.
curious boy
March 2020: $1.65 trillion
April 2020: $1.47 trillion
May 2020: $592 billion
Wolf,
My question is not related to this specific article you have written and I know how much you dislike if comment or question is not related to article but I am asking due to way market is behaving today. May non farm payrolls are out and number is 139K vs forecast of 126K. This is such a BS. Basically we lowered our expectations and numbers came out better than our lowered expectations and market is rallying above 6000? Previous numbers were 147K so technically 139K number is lower than before. I work in manufacturing sector and we have slowed down to scary levels and same is the case for our customers and suppliers. This whole thing screams manipulation.
Markets are efficient and like 99% forward-looking. The ADP print was significantly down, and markets reacted negatively. Subsequently, news was 24/7 about a weak labor market.
The number came out, and it’s not great, but it’s average. They aren’t bad, and there are signs of some weakness.
After the ADP print, bond yields went down in anticipation of a fed cut but now they are back up because the job market isn’t that bad.
What exactly is being manipulated? Adjustments to prior months were made, just like in the last administration, because the data that comes out gets scrubbed.
Fed is able to taper without major market tantrum, unemployment at 4.2%, wages increasing, labor market adding jobs, it all seems pretty decent. And the Fed has somewhere to go, now, with core PCE down around 2.5% and possibly heading lower. So there’s a floor under asset prices. Looking ahead is still very uncertain, and the fiscal side hasn’t played out yet, which is why there’s also a ceiling. 10 year jumping about but mostly in this 4.25-4.75% range kind of reflects that thinking. Need the spending bill drama to play out.
Here it is:
Excluding Federal Government Jobs, Payrolls Grow by 161,000 in May, Wages Jump, Despite All Moaning and Groaning
“Federal government jobs fell by 22,000, to the lowest share of total payrolls since… whenever.”
https://wolfstreet.com/2025/06/06/excluding-federal-government-jobs-payrolls-grow-by-161000-in-may-wages-jump-despite-all-moaning-and-groaning/
The three-month average (red line) includes all revisions:
In terms of the markets: markets do what they do because they do it. Right now, the S&P 500 backed off a bunch from earlier this morning and is below 6,000 again. No telling where it will end up. It’s just what markets do.
The 10-year yield jumped by 9 basis points. Maybe on inflation fears (wage growth), maybe on dashed rate-cut hopes, maybe on whatever.
139K is fine. It’s very close to the 12-month average. It’s better than a whole bunch of months last year. Payrolls’ low point was in mid-2024. The three-month average rose for the second month in a row. This is not a hot labor market anymore. It’s an OK labor market that is growing at an OK pace.
I never pay attention to “consensus” estimates or forecasts. It’s not a “consensus.” It’s an average in a survey of a bunch of economists. It’s useless. And I ignore it.
Wages are rising faster, and that’s good for workers, spending, consumption, savings, and investment — all of which are good for economic growth now or in the future. But they might provide some fuel for inflation. So dashed rate-cut hopes?
and yeah manufacturing payrolls are down, but were way down before too
https://www.investing.com/economic-calendar/manufacturing-payrolls-1531
Steady as she goes. Still over a billion a day off the balance sheet. As the economy grows and national debt continues to increase that billion will seem smaller and smaller. I guess if the Fed can maintain this pace – let’s say through the next presidential election – then that’s another trillion gone. Steady rates and less money sloshing around will hopefully finally get inflation down under 2%. We all need calmer waters for a while.
I’m a fairly new student of the Fed, but if they are letting MBS roll of their balance sheet at this rate, shouldn’t this have a significant impact on housing prices? If they aren’t artificially propping up values anymore, along with inventory at record levels, and the average mortgage rate at 7%… Seems like prices should come down at a faster clip…
Home prices have started to come down pretty hard in a lot of markets already. See for example:
https://wolfstreet.com/2025/05/26/the-10-big-cities-with-the-biggest-price-declines-of-single-family-homes-from-their-peaks-through-april-7-to-21/
@wolf
I would guess that usage of the SRF will be public information. Will this be with a lag or are the auction results reported live ala treasury auctions.
I would expect that SRF participants will be anonymous. Has this been confirmed or otherwise?
The New York Fed reports the SRF daily. The Federal Reserve Bord of Governors reports it on its weekly balance sheet as of Wednesday (the data in my article).
There has been no activity to speak of, just a few million bucks every now and then, so I don’t include a chart in my article because there is nothing to see, though I report the dollar figure ($1 million) under the heading “bank liquidity facilities.”
Here is the daily chart through this morning:
Wolf, great information as usual, but I wouldn’t sweat another repocalypse. There’s still at least $3T excess of easy money floating around with most of it drawn to malinvestment as moral hazard reigns and there is just no incentive for wasting time calculating risks and heeding them. Let’s see who is naked. It will be good for everyone. Growth in GDP does not warrant a balance sheet above $3T or even anything close.
The Fed’s balance sheet needs to be well over $3T. Wolf posted on this previously.
https://wolfstreet.com/2024/03/23/the-feds-liabilities-how-far-can-qt-go-whats-the-lowest-possible-level-of-the-balance-sheet-without-blowing-stuff-up/
Interest rates are about where they should be. Not too high so as to break anything, not too low so as to continue encouraging the financial engineers. Not so low as to suppress savings. High enough (one hopes) to cause house prices to come down. High enough to somewhat frustrate the spenders in government, but not so high at to cause an immediate crisis.
Wouldn’t it be ironic if Powell turns out to be one of our better Fed chairmen. Even more ironic, if, as many people wonder/suspect/think, that Powell is not cutting rates to harm Trump and it turns out that not cutting rates and holding them here may turn out to be just what we need.
If we can just avoid the multiple wars that so many in the Senate seem to want on multiple fronts…maybe things will turn out ok.
The repo market blowout in 2019 wasn’t a lesson the Fed should have needed to learn. Before QE, a SRF was necessary. It would stand to reason then the SRF would again become necessary when QE ended. I don’t think they deserve any praise for this new SRF.
No one “praised” them.
Mission accomplished – blow the most gigantic, outrageous everything bubble in world history.
You’re not going to get a repo like spike if the FED is lowering policy rates. 2019 was just like the introduction of interest on reserves.