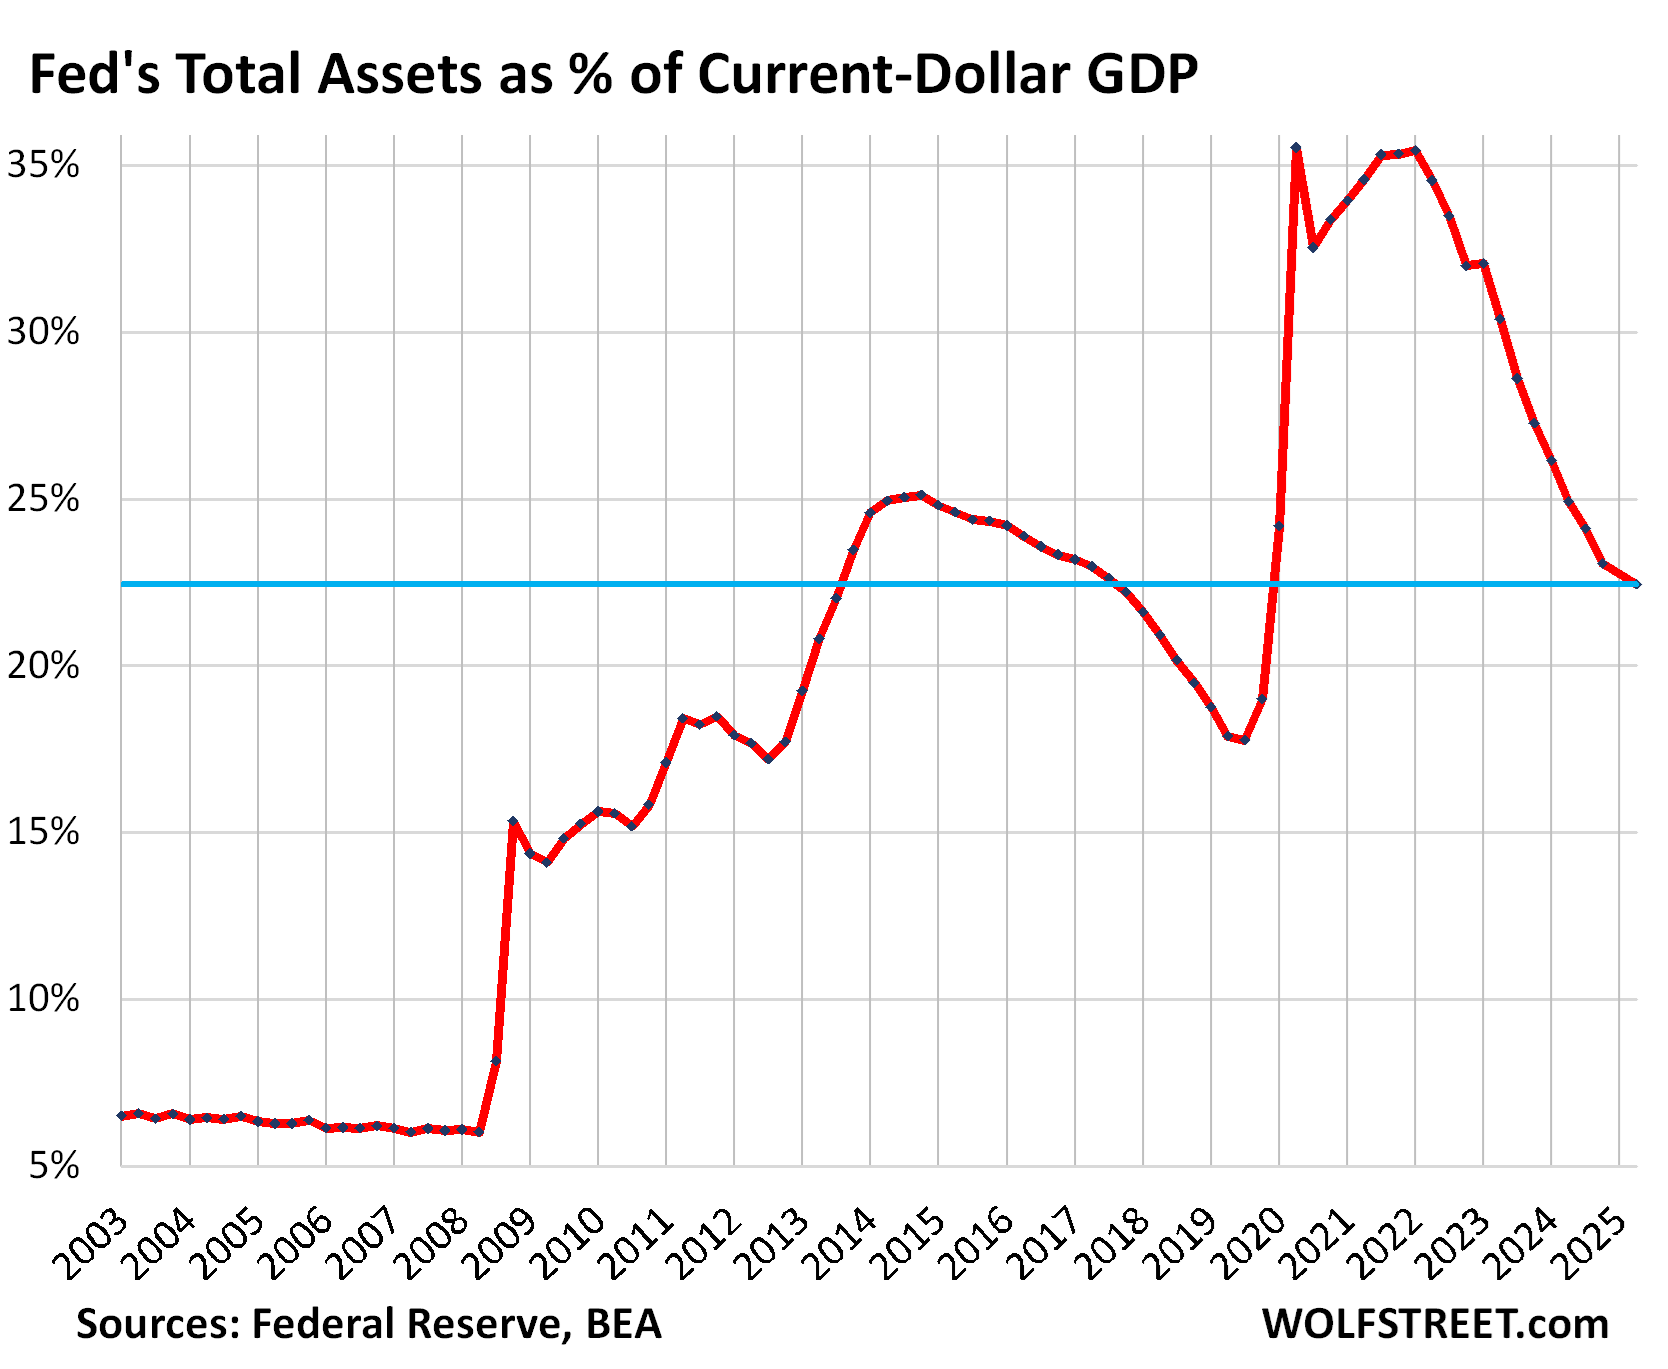
Quantitative Tightening has shed 25.2% of total assets. The Assets-to-GDP ratio declined to 22.4%, first seen in 2013.
By Wolf Richter for WOLF STREET.
Total assets on the Fed’s balance sheet declined by $14 billion in April, to $6.71 trillion, the lowest since April 2020, according to the Fed’s weekly balance sheet today.
Since peak balance sheet at end of QE in April 2022, the Fed’s QT has shed $2.26 trillion, or 25.2% of its total assets, and it has shed 46.9% of $4.81 trillion in pandemic QE it had piled on from March 2020 through April 2022.
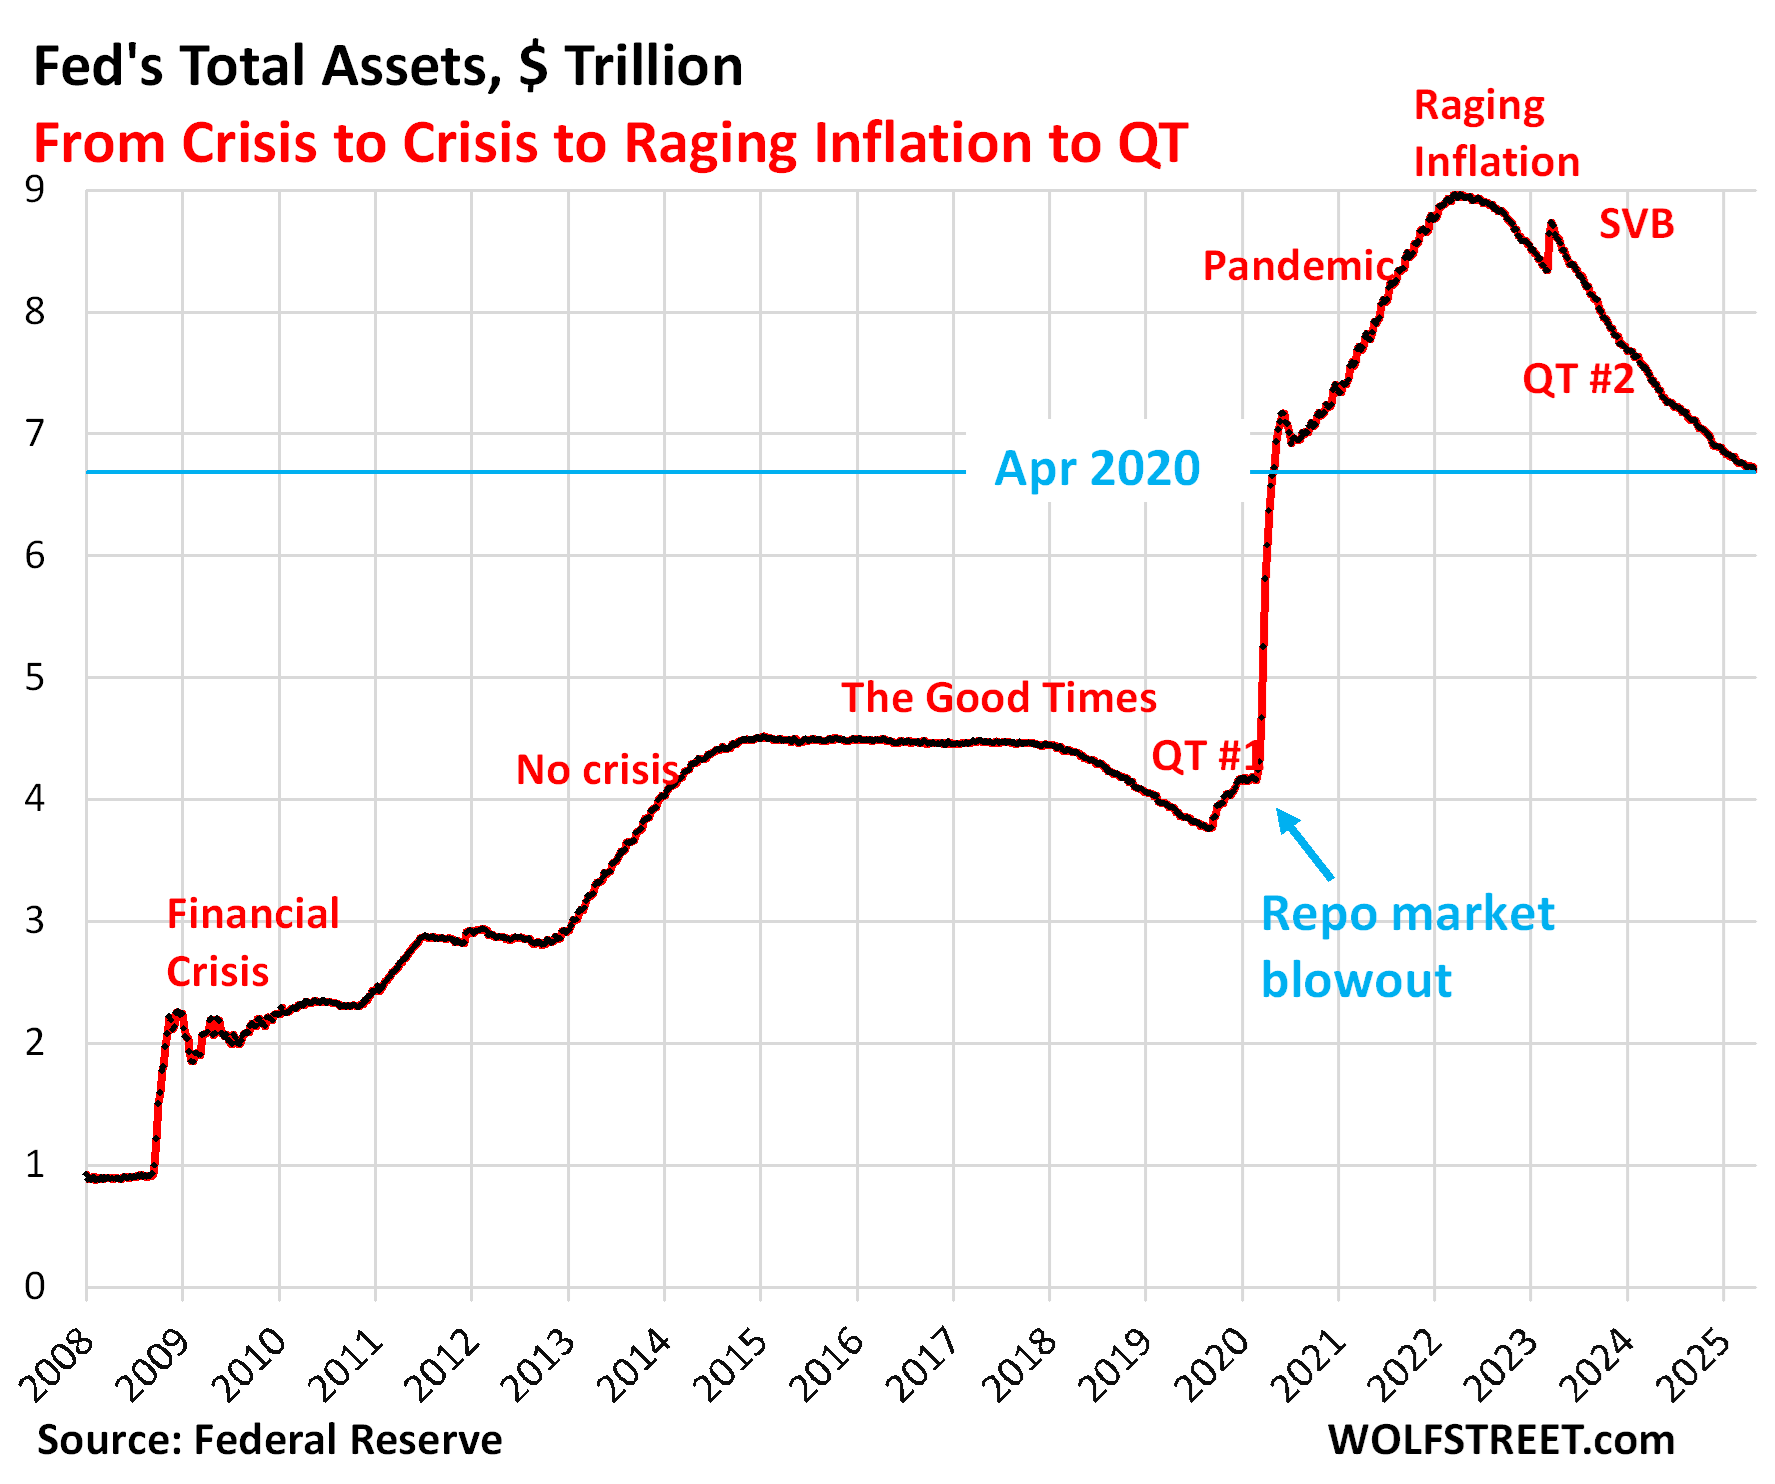
April was the first month of the slower-paced QT announced formally at the last FOMC meeting, under which the Treasury runoff has been reduced from $25 billion a month to $5 billion a month. The pace of QT of Mortgage-Backed Securities was not reduced or capped; it’s a function of principal payments that borrowers make that are passed through to MBS holders. Whatever those pass-through principal payments are, that’s what comes off the balance sheet.
QT assets.
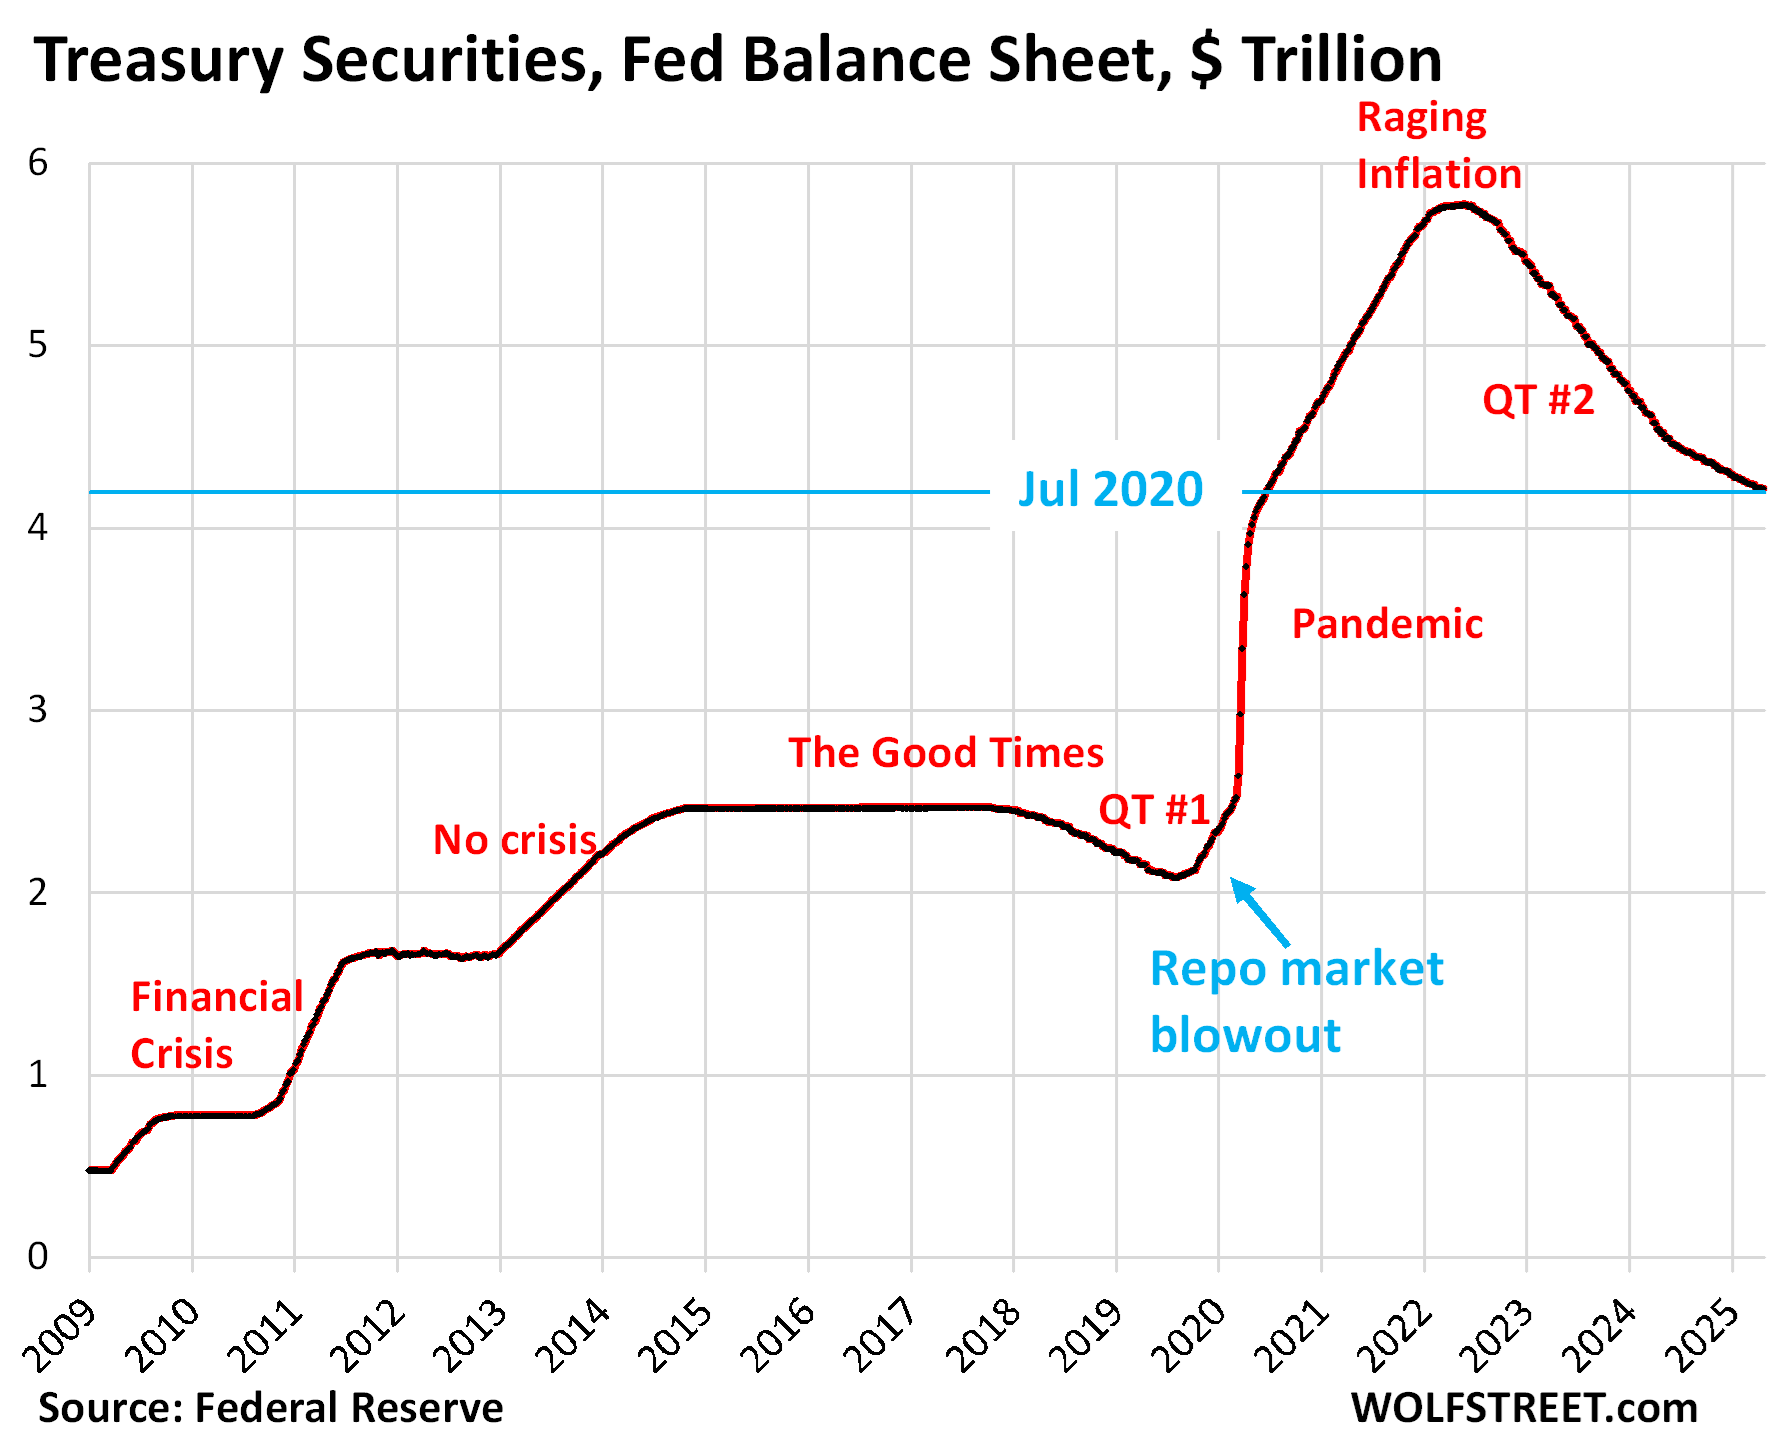
Treasury securities: -$3.2 billion in March, -$1.56 trillion from peak in June 2022 (-27.0%), to $4.22 trillion, the lowest since July 1, 2020.
In terms of the $3.27 trillion in Treasury securities piled on during pandemic QE, the Fed has shed now 47.6% of them.
Treasury notes (2- to 10-year) and Treasury bonds (20- & 30-year) “roll off” the balance sheet mid-month and at the end of the month when they mature and the Fed gets paid face value. As of this month, the roll-off has been capped at $5 billion per month.
Given the huge Treasury holdings of $3.27 trillion and the large amounts of securities that mature every month and that now have to be replaced, there are some squiggles, there always have been squiggles, but now they show up more because $5 billion in QT is a lot smaller than $25 billion or $60 billion, which had been the original Treasury QT amount.
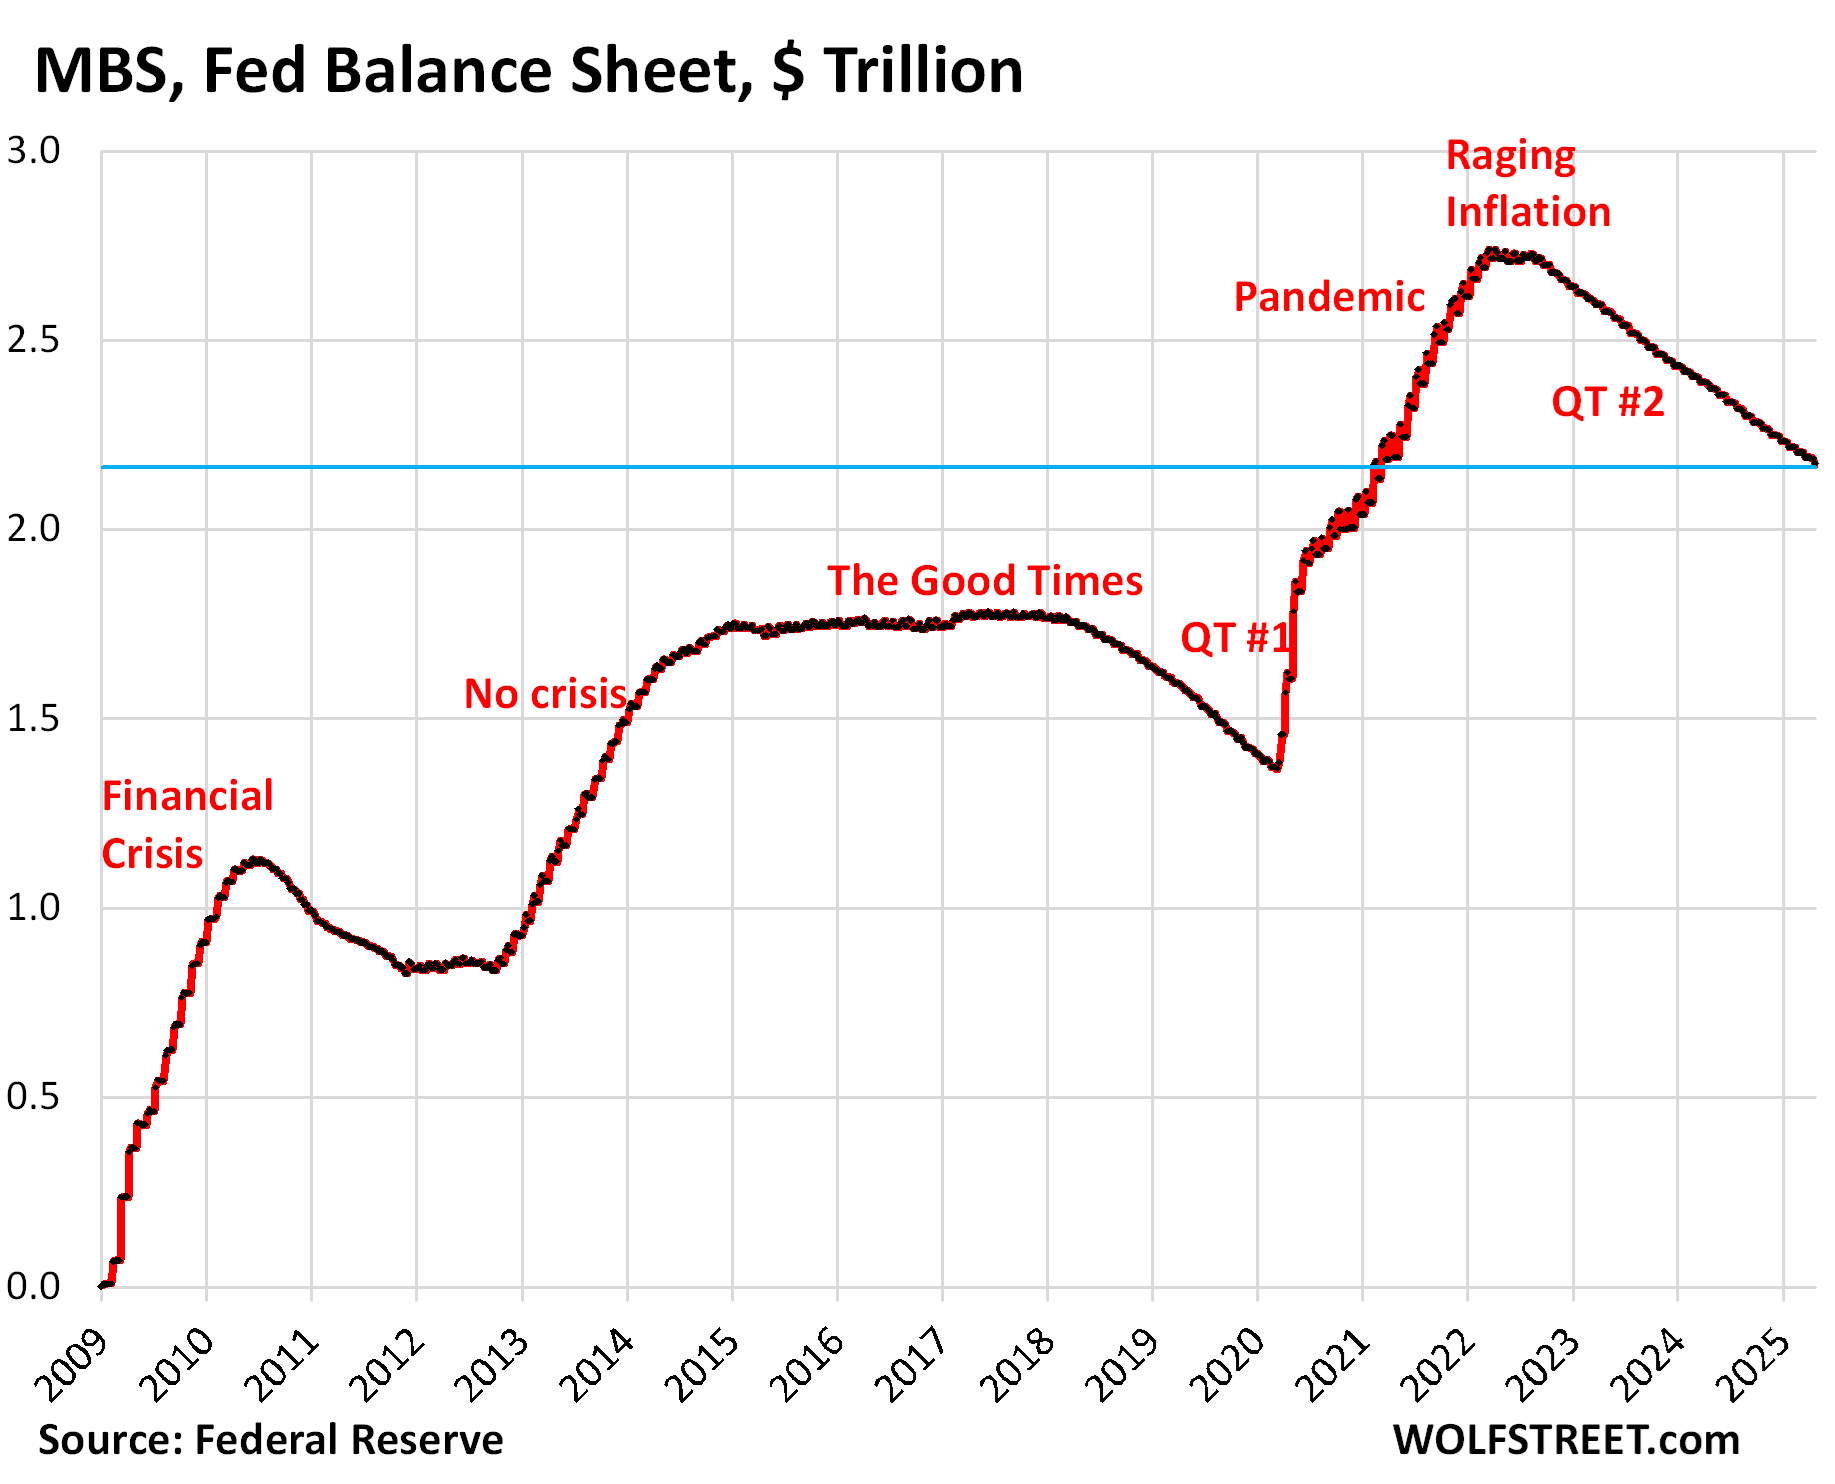
Mortgage-Backed Securities (MBS): -$16.1 billion in April, -$567 billion from the peak, to $2.17 trillion, where they’d first been in February 2021.
The Fed has shed 21% of its MBS since the peak in April 2022. In terms of the $1.37 trillion in MBS that the Fed added during pandemic QE, it has shed 41% of them.
MBS come off the balance sheet primarily via pass-through principal payments that holders receive when mortgages are paid off (mortgaged homes are sold, mortgages are refinanced) and when mortgage payments are made. But as sales of existing homes have plunged and mortgage refinancing has collapsed, far fewer mortgages got paid off, and passthrough principal payments to MBS holders, such as the Fed, have become a trickle. As a result, MBS have come off the Fed’s balance sheet at a pace that has been mostly in the range of $14-17 billion a month.
The Fed holds only “agency” MBS that are guaranteed by the government, where the taxpayer would eat the losses when borrowers default on mortgages, not the Fed.
Bank liquidity facilities: inactive.
The Fed has three bank liquidity facilities, after it shut down the two (BTFP and Loans to the FDIC) that it had invented during the March 2023 bank panic.
And these remaining three are essentially inactive. The Fed has been exhorting banks to start practicing using these facilities with “small value exercises,” or at least get set up to use them, and pre-position collateral at the Discount Window so that they could use it quickly, etc..
- Central Bank Liquidity Swaps ($62 million)
- Repos ($111 million)
- Discount Window: $3.5 billion, up by $1.3 billion from a month ago. During the SVB panic, it had spiked to $153 billion.
What else was part of the $14 billion in QT?
The balance sheet declined in total by $14 billion in April. But Treasury securities declined by $3.2 billion and MBS by $16.0 billion, for a combined decline of $19.2 billion.
Discount Window borrowing increased by $1.3 billion, as noted above, which increased the balance sheet by $1.3 billion and thereby reduced the QT amount to $17.9 billion (from $19.2 billion).
“Other assets” increased by $5 billion, which reduced the QT amount to $12.9 billion (from $17.9 billion).
This $5 billion consisted mostly of accrued interest from its bond holdings that the Fed set up as a receivable (an asset) in April. When it receives that interest payment in May, the Fed destroys that money and it comes off the balance sheet, and the account declines by that amount (the Fed doesn’t have a “cash” account, like companies do; it creates money when it pays for something and destroys money when it gets paid).
Since this account also includes “bank premises” and other accounts receivables, it will always have a balance.
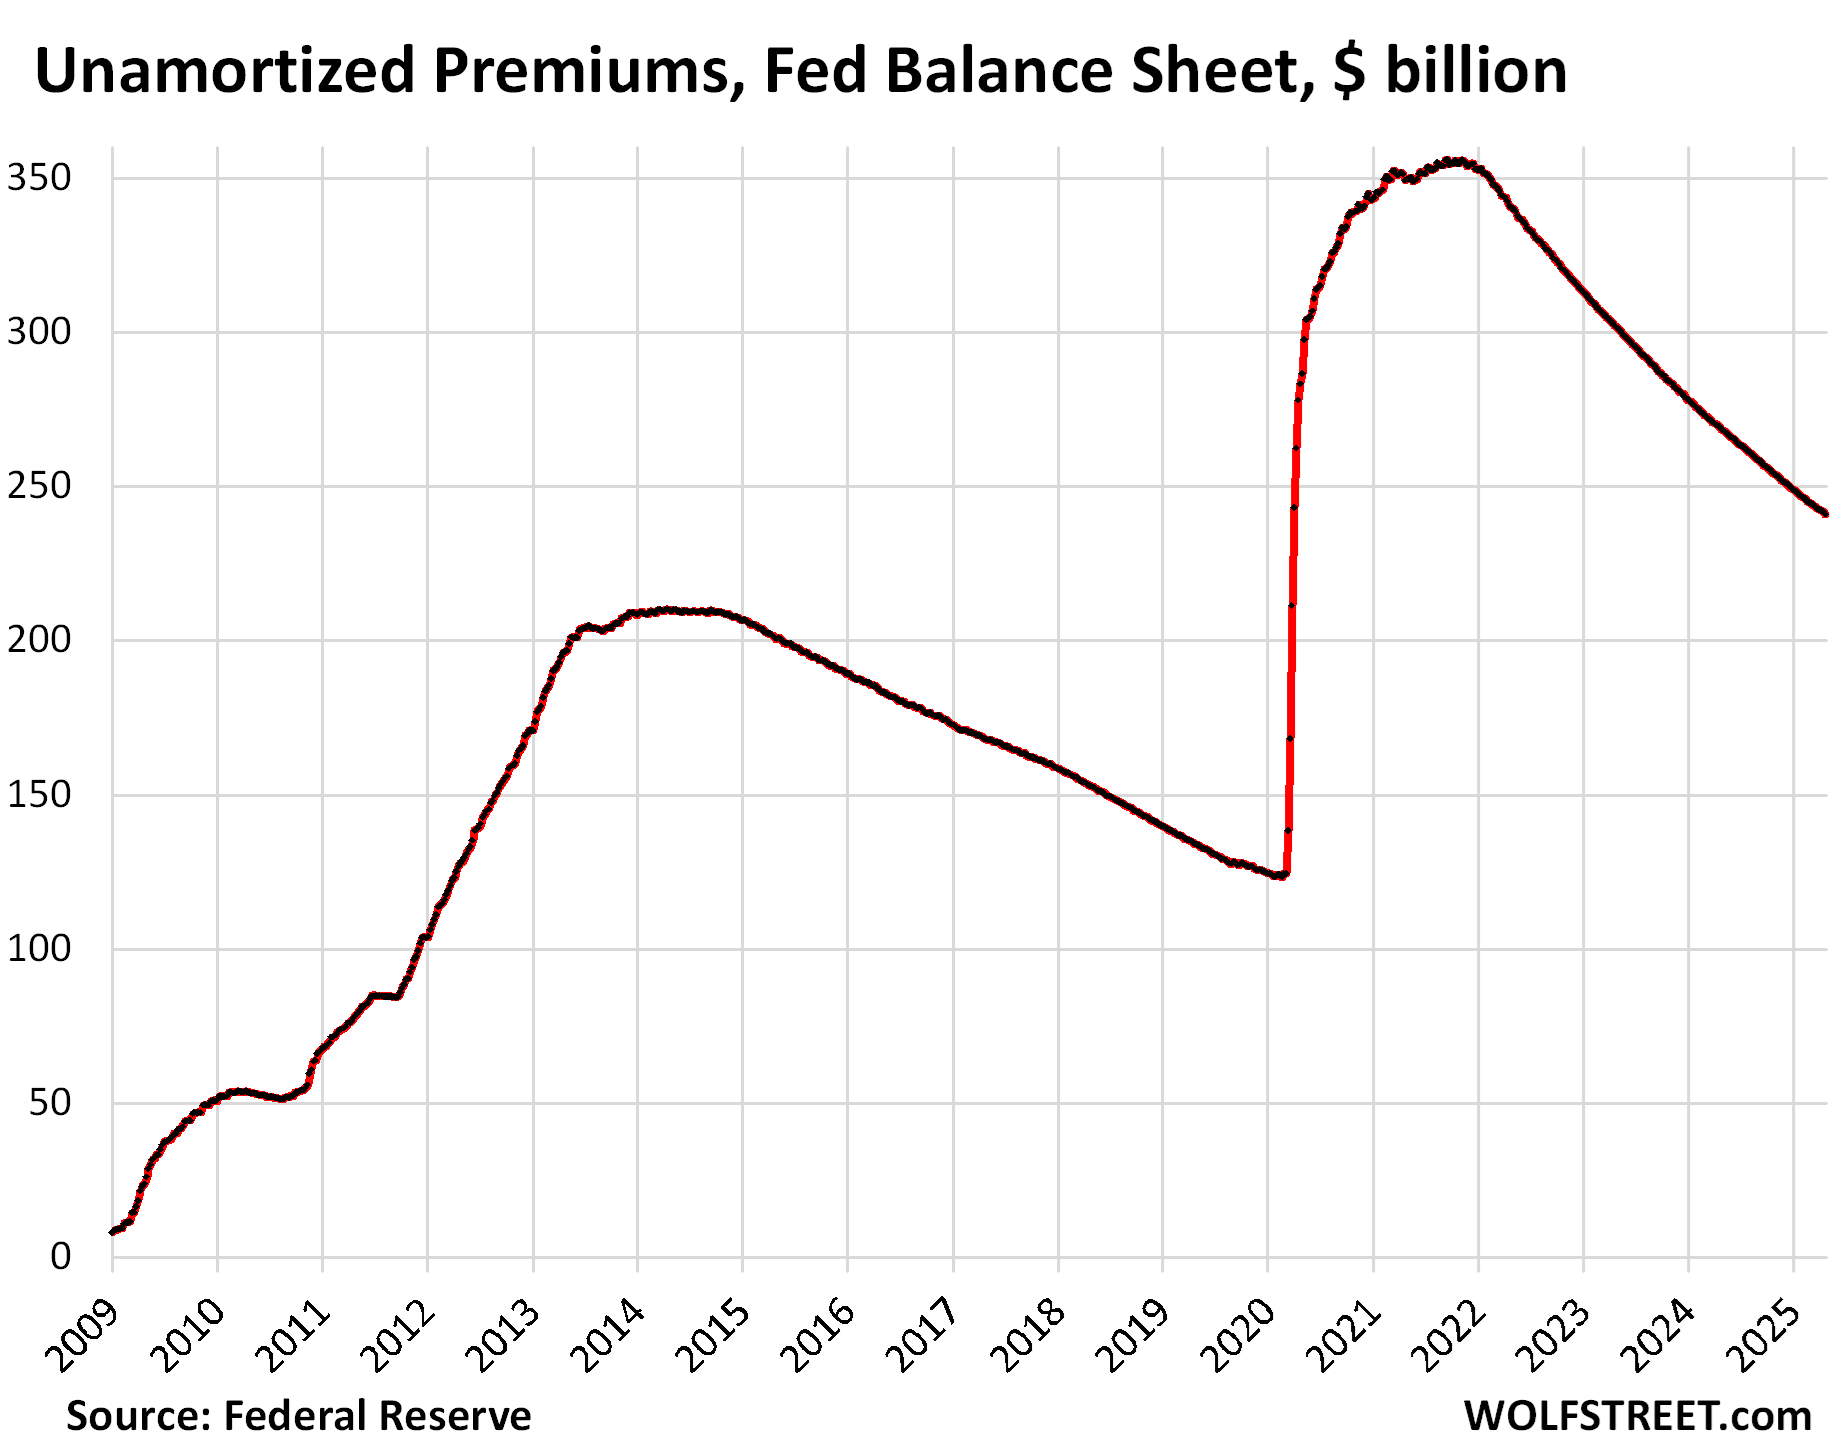
“Unamortized premiums” declined by $1.8 billion, which increased the QT amount to $14.7 billion (from $12.9 billion). And that $14.7 billion is about by how much total assets declined.
The unamortized premiums are a regular accounting entry with which the Fed writes off the premium over face value it had to pay for bonds during QE that had been issued months or years earlier with higher coupon interest rates and that had gained value as yields dropped before the Fed bought them. Like all institutional bondholders, the Fed amortizes that premium over the life of the bond. The remaining balance of unamortized premiums is now down to $241 billion, from $356 billion at the peak in November 2021:
The assets-to-GDP ratio. Before QE started in 2009, the Fed’s balance sheet grew over the years roughly in line with the economy as measured by “current dollar” GDP (with neither the balance sheet nor GDP adjusted for inflation). This assets-to-GDP ratio was 6.0% in 2008 before all the QE craziness started.
At the end of QE Infinity in December 2014, the assets-to-GDP ratio hit 25%. It then declined as GDP grew while the balance sheet was at first flat and then declined during QT-1.
During pandemic QE, the assets-to-GDP ratio spiked to 35.5% in Q2 2020 as GDP collapsed while the Fed’s balance sheet exploded. As GDP bounced back, the ratio dropped for one quarter, but then QE continued even faster than GDP rose, and the ratio returned to 35.4% in Q1 2022, when QE stopped.
After $2.24 trillion in QT and three years of economic growth since Q1 2022, the ratio has now dropped to 22.4%, just above where it had first been in Q3 2013:
QE has produced years of hangover for the Fed. In case you missed it: Fed’s Operating Losses Declined to $78 Billion in 2024, “Unrealized Losses” Rose to $1.06 Trillion
Enjoy reading WOLF STREET and want to support it? You can donate. I appreciate it immensely. Click on the mug to find out how:

![]()
FED always jumped the gun for reducing the QT amounts. One side Powell says we still have abundant reserves. So we can go for longer with slower QT. I understand that thinking but then they didn’t have to slow down Treasuries so fast.
We all know Real Estate Market is down with lower Sales. So only Monthly payments principals will go for MBS. So MBS roll off very slowly.
To much caution is not good too.
They started talking about selling MBS outright again to bring the MBS roll-off up to $35 billion a month — just last week, after being quiet about it since the March 2023 bank panic. Plus $5 billion in Treasuries, and they’re back at the $40 billion they were doing before April. They really want to get rid of the MBS. So this may have been the plan, one baby step at a time.
Just curious, but who would buy these MBS’s? And how would they be packaged?
They’re government guaranteed with similar risk-profile as Treasury securities. But they’re a hassle to deal with because of the passthrough principal payments that constantly reduce the balance, and so you have to constantly buy new MBS to keep the balance steady. Yields are higher than Treasury yields for that reason. In addition, they’re callable. So individual investors generally don’t buy MBS directly though they can buy ETFs and mutual funds that invest in them.
But there is lots of demand from institutional investors: banks, bond funds, insurers, RETIs, etc.
Thanks!
just to clarify wolf’s point for people who don’t know, but “callable” means that the “borrower” can terminate the loan early.
in the u.s., residential mortgages never have, or at least I’ve never seen, prepayment penalties or prohibitions on prepaying. so if you buy mbs, you basically know that it won’t last the whole length of the loan, as if rates drop, your borrower will refinance and pay it off early.
since mbs are an aggregation of many securities, any odd behvaiors from individual homeowners are unlikely to affect the whole pool.
Average life of an SFR mortgage in the US is 7 years. Either the home is sold, refied, or foreclosed.
So the Fed buys new treasury securities each month to replace the ones in excess of $5B that rolled off, is that right?
Correct.
What maturity are the Treasuries they buy with the excess?
Are they extending the average life of their treasury holdings?
They buy a pro-rata amount of each across maturity the spectrum to keep the average duration relatively steady. You can see how much was bought for SOMA as “add-ons” for each auction on TreasuryDirect.gov by going to Auctions > Announcements, Data & Results and looking through the PDFs of each Note, Bond, and TIPS auction.
I don’t see the graph for assets to GDP ratio?
Oops. Thanks. It’s there now.
This isn’t like watching paint dry, it’s like watching a tree grow.
Rule #1 Any action in the world, especially major action, has consequences. For example, print money and you get inflation, period. So QT will have major consequences and is NOT like “watching paint dry” like Treasurer Yellen said (not the best qualified for job).
This is what a reckless, shoot-from-the-hip, win-lose style of government gets us.
How does this play into increasing global liquidity and tariff pressures on inflation?
Dang.
That Fed assets to GDP chart is a stunner.
Have never seen that before.
Thanks for the post as always.
What seems to be the end goal here ? Does the FED plan to bring back assets to 2020 levels ? How long would it take ?
If they shed all their agency MBS (suddenly or gradually), then does that impact housing prices in any way ?
Wolf, do you think we will have a more precise estimation of the level of QT if we adjust it for inflation?
1. QT is NOT an “estimate.” Period. These are actual balance sheet dollars, down to the penny as of Wednesday after close of business.
2. The bottom chart shows Fed assets as a percent of nominal GDP. So both in current dollars. Since the inflation factors are in both the numerator and denominator, they cancel out (basic math). So go back upstairs and look at the last chart.
Your last sentence, lol. So right!
If QT and QE are primary arsenals in Feds pocket along with interest rate, I really don’t understand why Powell dropped monthly QT so low. Look at stock market today, tariff what tariff? We are already out of market correction. Balance sheet needs to go below 2020 level and we are not going to make it with such small drawdown per month. Housing market is down because mortgage rates are high and home buyers are hesitant and folk like me who locked in 2.6% are not ready to switch houses. Wolf has written articles where 10 year bond rate which has big impact on mortgage rate is tied to future inflation and reducing feds rate as our president is asking for not going to have big impact. If inflation is a worry and stocks are overvalued then take the money out of market so it becomes expensive to spend money. We need to that QT graph falling like a curtain just as up it went like a rocket during Covid. Unemployment is low, market is doing good despite major disruptions from white house and fed is still hesitant when it comes to QT. Feels more like Wall Street dictates policy than policy makers acting independently.
i don’t disagree that wall street dictates policy, but the current market has very little to do with qt or qe. it’s more based on the idea that qe will resume if things go wrong. thing about it. the market is nearly double where it was in april 2020 when the fed’s balance sheet was where it is today.
it’s not the balance sheet or qt. it’s the appearances that the fed will do whatever it takes, whether it’s the svb bailout, qe or whatever else.
i also agree that inflation will be a major problem, especially in services and house prices, as long as stocks stay levitated.
That last chart to me shows an economy and financial system that hasn’t been able to stand on its own two feet in 17 years. Without the Fed backing everything with these artificial low bond rates “sure we’ll buy it” the whole system would probably collapse. Now with Treasury QT basically “off”, we have to watch the MBS roll off at a snail’s pace. Even if they sell some to get up to $35B a month that’s still at least five years of crutches on the US housing market. What’s the loss on a 30 year mortgage issued at 3% that now has to be sold to yield 7%? Like a big magic money printing gift.
@wolf
I know they’ve spoke about MBS and where they would like the bond mix to end up. Are you aware of any FED talk regarding where they would see the balance as %GDP ending up in some sort of future equilibrium scenario etc?
I’d guess 15-18% from the data, but I’d expect someone must have looked into this a little more deeply.
They don’t look at it that way. I remember Powell being asked about it some time ago at a press conference, and he said pretty much, we don’t look at it that way. And then he went into some of the mechanics of how they’re looking at it (the level of reserves).
I just use this as an illustration of the size of the Fed’s balance sheet in the context of the economy.
The Fed needs to focus on getting all the MBS and CMBS off their balance sheet. It’s criminal that they bought that toxic crap in the first place.
If you think of the FED as Wall St.’s “fence” then it all makes sense. -g-
Yes, I mean that in both ways. As a protective fence and as a jewel thief’s fence.
Wolf – thanks for the note “the Fed doesn’t have a “cash” account, like companies do; it creates money when it pays for something and destroys money when it gets paid.” So in effect, the Fed is saying that we need less debt assets in the economy (Treasury Securities and MBS) and more cash? If I understand the mechanics, the Fed is buying the debt assets (already backed by the government) and giving holders of those assets cash, which they can then spend. I guess the Fed ends up with the assets because of market conditions where those securities are not so easily converted to cash, but the cash is needed in the economy. It seems that cash is not actually being “created” in the sense that if I have $1 in a Treasury obligation, I would be getting $1 cash in USD (which is also a Treasury obligation) in the exchange with the Fed. But I can now use that dollar to buy stuff. In other words, the Fed is lubricating markets that are sticky and hurting the economy. Is this correct?
“… the Fed is buying the debt assets (already backed by the government) and giving holders of those assets cash, which they can then spend.”
That’s QE.
QT is the opposite, but it works by not replacing maturing securities. When a security matures, the Fed gets paid that cash and destroys that cash. That’s QT.
Your second part is not how that works.
QE facilitated our UniParty’s Oligarchy. They will fight to keep it.
This QT series that Wolf does is my favorite.
I found nothing more horrifying than than the Federal Reserve doing QE, buying $80billion in Treasuries & $40 billion in MBS in in 2008, then in 2020 $120 billion in Treasuries & $80 billion in MBS.
It should never been allowed. And Europe was even worse. QT is healing that wound, but it looks like wall street hates QT. QT probably won’t last much longer.
After QE, I watched the price of homes & the American dream sky rocket away from Americans & my family.
Wolf should make his web site half financial analysis & the other half psychiatric thearapy for those of us who are Heart broken when looking at our economy.
Wolfstreet is #2 best web site on the web. #1 best site is zerohedge.
I am your #1 fan wolf! Keep up the great work!