Surging homeowner insurance and other homeowner costs fuel OER CPI, which is now hotter than rent CPI.
By Wolf Richter for WOLF STREET.
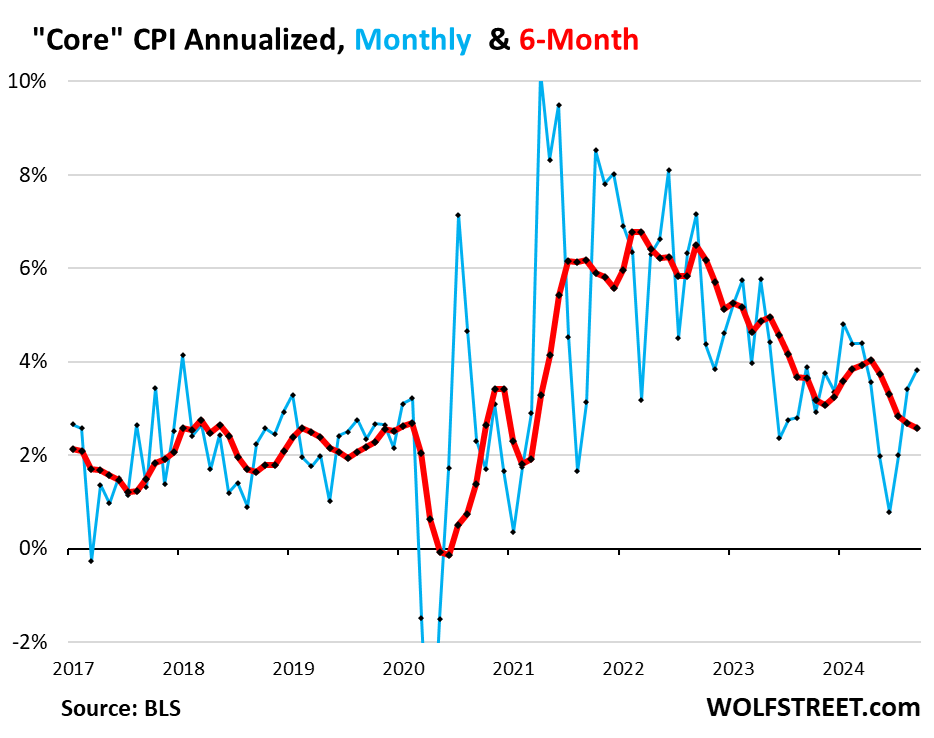
On a month-to-month basis, the “core” Consumer Price Index – which excludes the volatile food and energy components – rose by 0.31% (+3.8% annualized) in September from August, the third acceleration in a row, and the biggest increase since March, driven by suddenly rising prices of used vehicles, in what is a sharp flip from the steep plunges before, and stubbornly high inflation in services (blue line in the chart below).
The 3-month average “core CPI” rose by 3.1% annualized, the second month of acceleration in a row as the low reading in June has now fallen out of the 3-month average (not shown in the chart below).
The 6-month average – which irons out most of the month-to-month squiggles – eased to +2.6% (from +2.7% in the prior month) as it still includes the low reading in June (red):
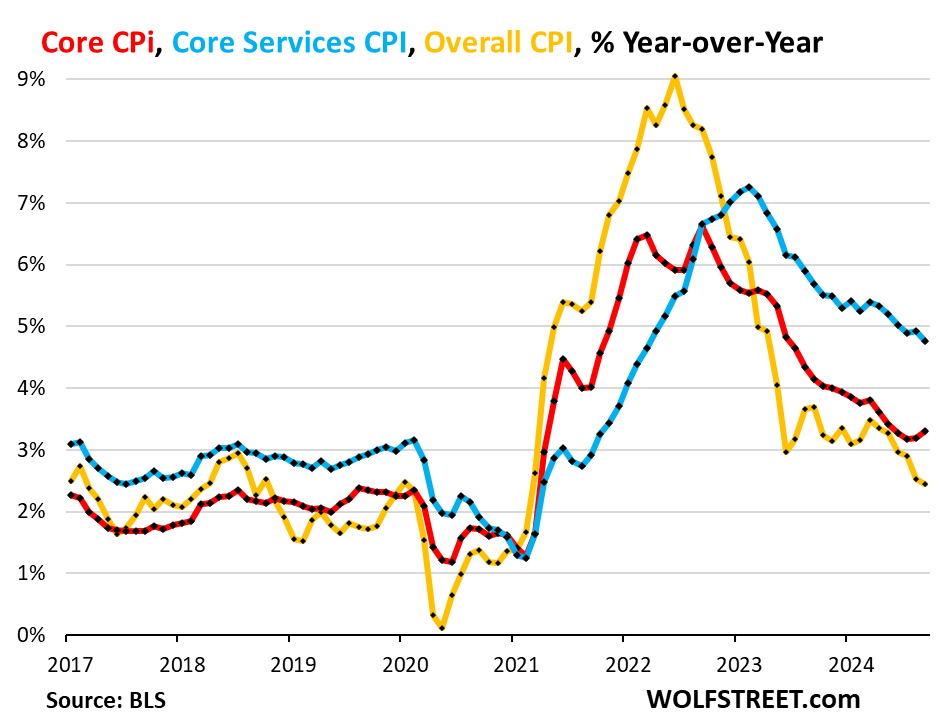
Year-over-year, in summary:
- Core CPI accelerated for the third month in a row to +3.3% (red in the chart below).
- Core Services CPI decelerated a hair to +4.8% (blue).
- Overall CPI, driven down by plunging gasoline prices, decelerated to +2.4% (yellow)
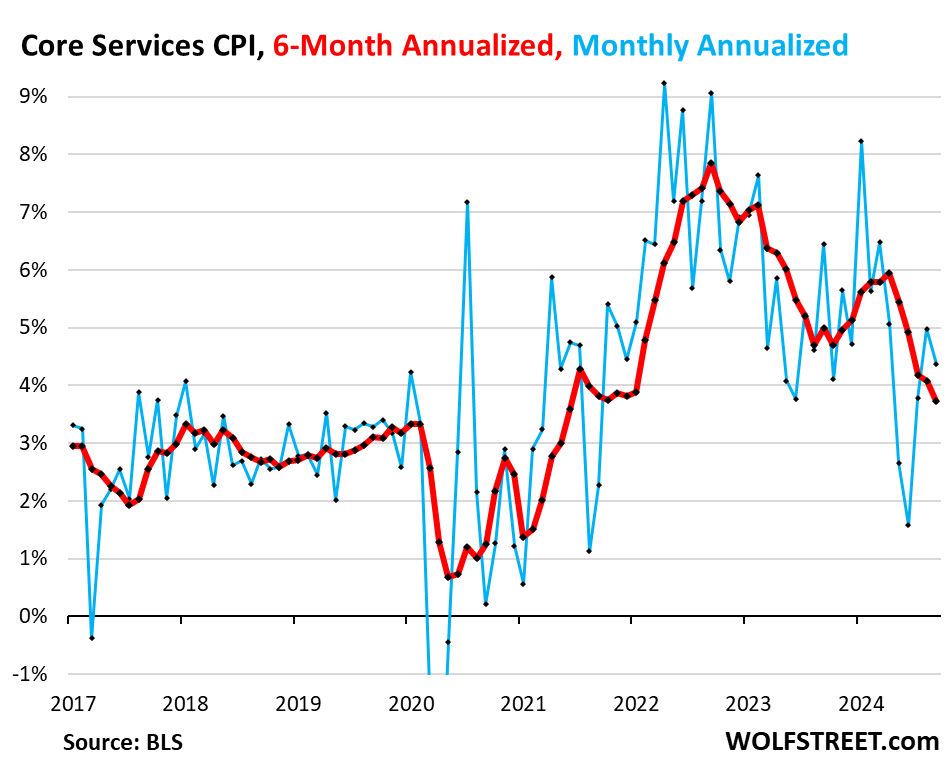
“Core services” CPI.
Core services CPI decelerated to a still high +4.4% annualized in September from August, compared to +5.0% in the prior month (blue line in the chart below).
The 3-month core services CPI, which no longer includes the very low reading in June, accelerated to 4.4% (not shown in the chart).
The 6-month core services CPI, which still includes the low reading in June, decelerated to 3.7% annualized, the smallest increase since January 2022 (red).
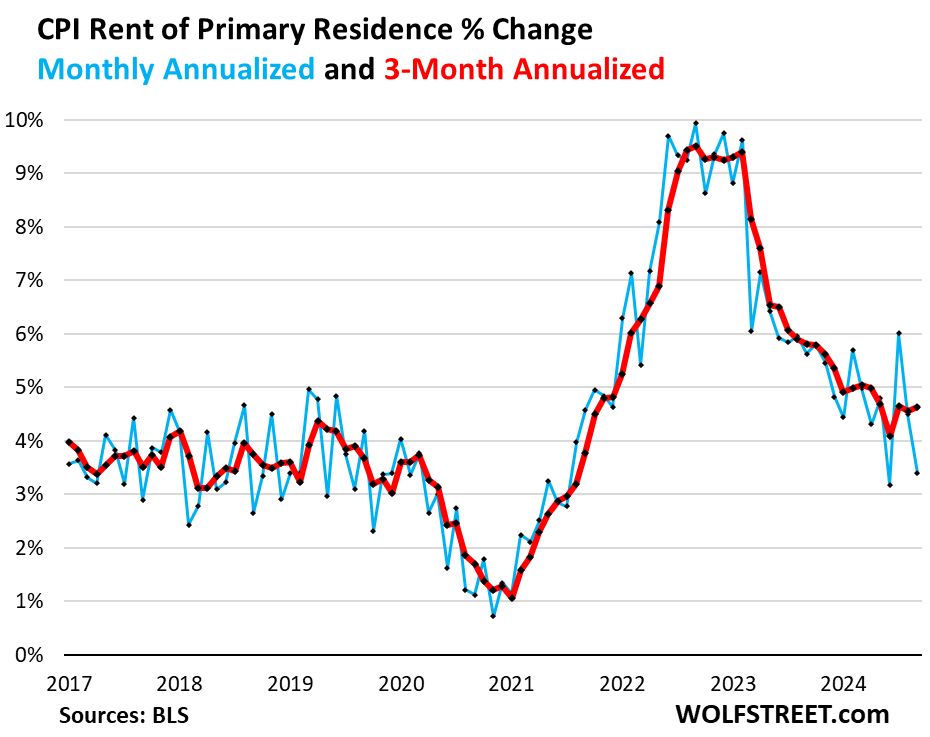
The housing components of core services.
Rent of Primary Residence CPI decelerated to +3.4% annualized in September from August. It has been zigzagging up and down in the same range roughly all year (blue).
The 3-month rate accelerated a hair to +4.63% (from 4.56% in the prior month). After cooling a lot in 2023, rent inflation hasn’t cooled much this year.
Rent CPI accounts for 7.7% of overall CPI. It is based on rents that tenants actually paid, not on asking rents of advertised vacant units for rent. The survey follows the same large group of rental houses and apartments over time and tracks the rents that the current tenants, who come and go, paid in rent for these units.
The Owners’ Equivalent of Rent CPI has also been zigzagging up and down all year. In September, it decelerated from August to +4.1%, after two months of sharp acceleration (blue).
The three-month OER CPI accelerated to 4.9% annualized, the second month of acceleration in a row (red).
OER CPI indirectly reflects the now soaring day-to-day expenses of homeownership: insurance, HOA fees, maintenance, and property taxes.
It accounts for 26.9% of overall CPI. It estimates inflation of “shelter” as a service for homeowners – as a stand-in for the services that homeowners pay for, such as interest, homeowner’s insurance, HOA fees, maintenance, and property taxes. It is based on what a large group of homeowners estimates their home would rent for, with assumption that a homeowner would want to recoup their cost increases by raising the rent.
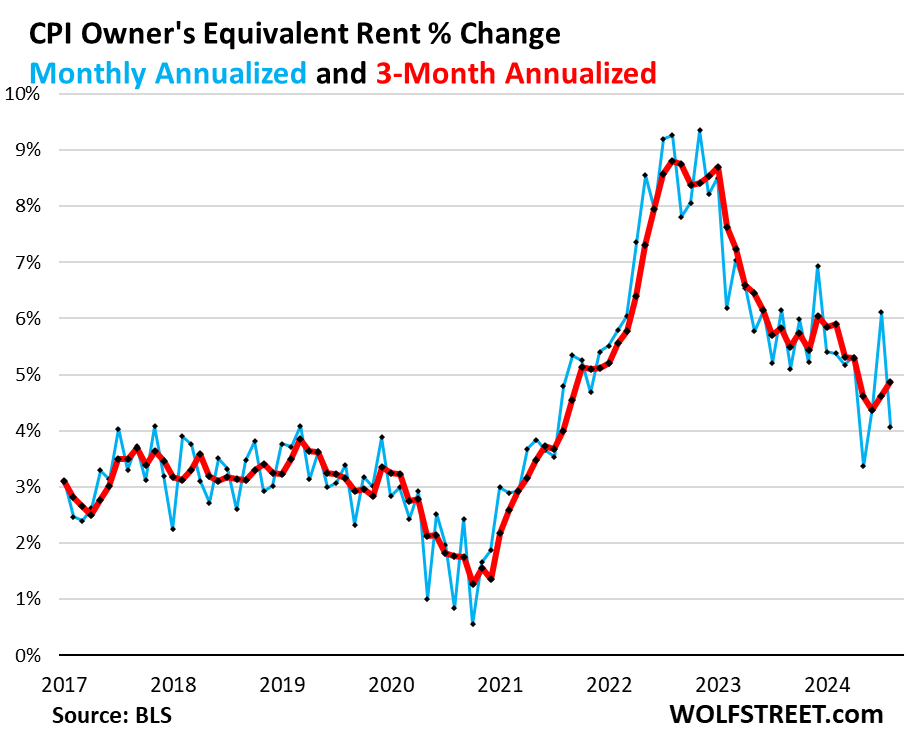
Homeownership expenses push up OER: OER indirectly covers the expenses of insurance, maintenance, HOA fees, and property taxes, whose now surging costs could continue to fuel OER, and could see to it that it continues to run hotter than rent CPI.
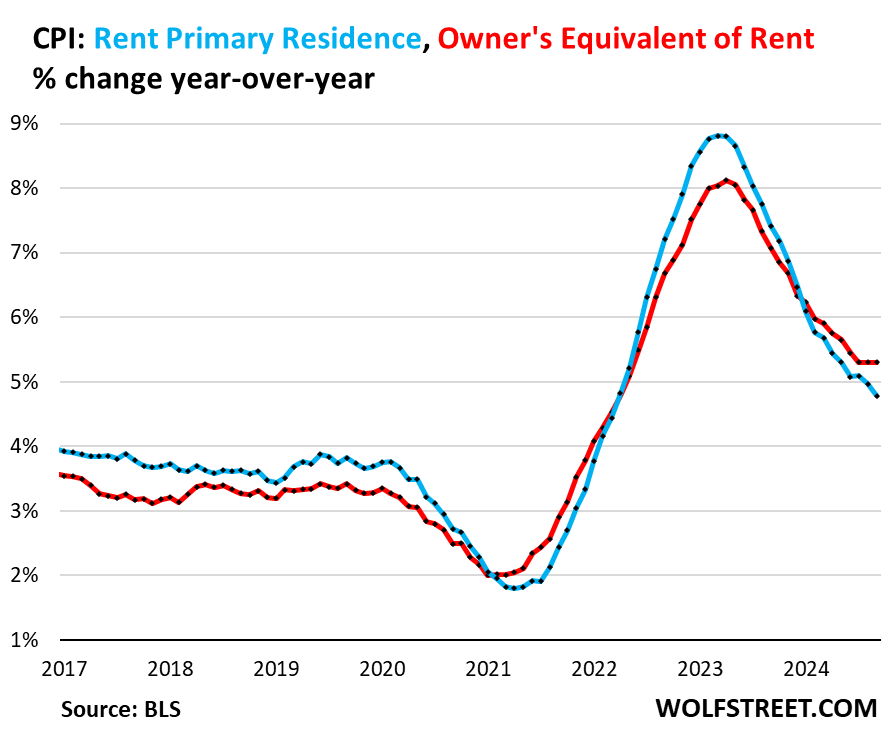
Year-over-year, OER v. Rent CPI. OER rose by 5.3%, the third month in a row of rising at this pace, having broken the trend of year-over-year declines (red line). But the CPI for rent decelerated to 4.8% (blue).
That OER runs hotter than rent is unusual. It reflects perhaps the reality that homeownership is now substantially more expensive on a month-to-month basis in the US overall than renting an equivalent home, and that these expenses (except mortgage rates) continue to surge far faster than rents.
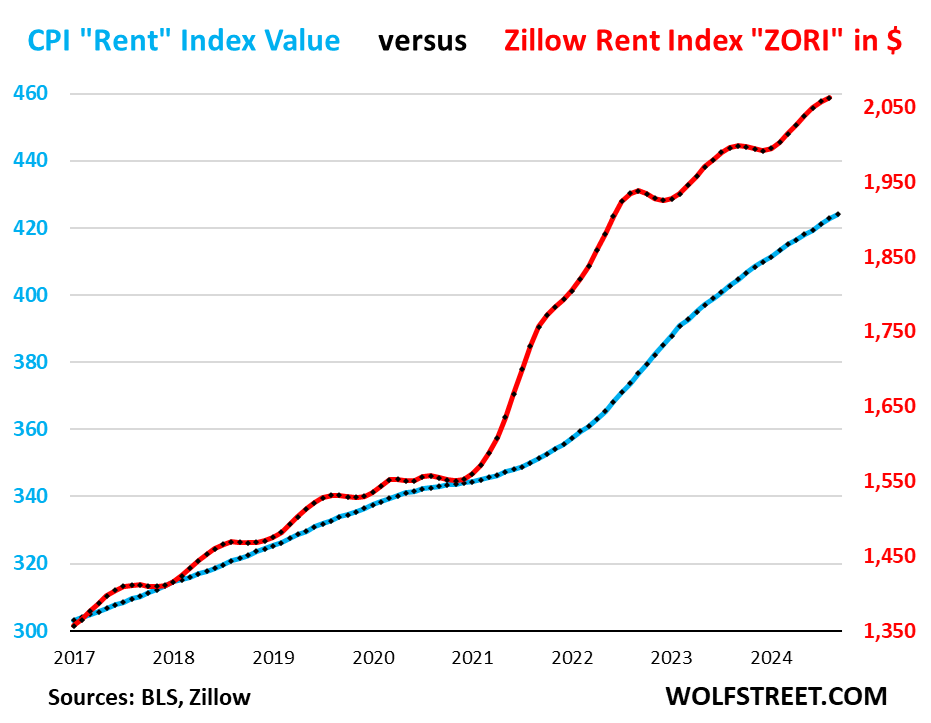
“Asking rents…” The Zillow Observed Rent Index (ZORI) and other private-sector rent indices track “asking rents,” which are advertised rents of vacant units on the market for rent. Because rentals don’t turn over that much, the ZORI’s spike in 2021 through mid-2022 never fully translated into the CPI indices because not many people actually ended up paying those high asking rents.
For August, the ZORI rose by 0.22% month-to-month and by 3.4% year-over-year. Zillow has not yet released the ZORI for September.
The chart shows the CPI Rent of Primary Residence (blue, left scale) as index value, not percentage change; and the ZORI in dollars (red, right scale). The left and right axes are set so that they both increase each by 55% from January 2017. The ZORI was up by 52% from January 2017, and the CPI Rent was up by 40% over the same period.
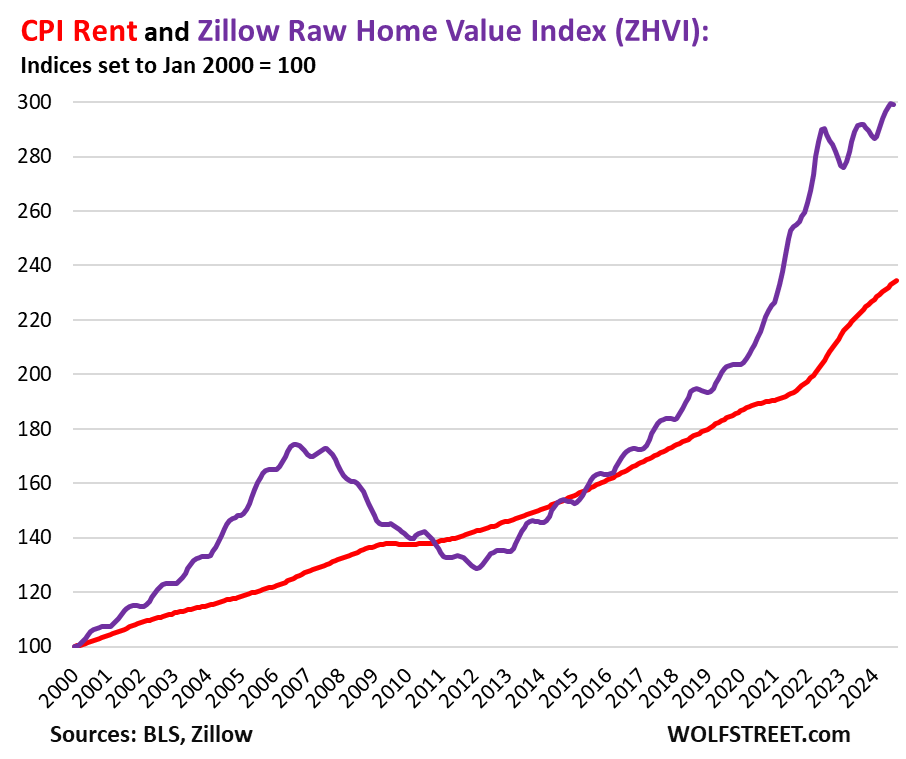
Rent inflation vs. home-price inflation: The red line in the chart below represents the CPI for Rent of Primary Residence as index value. The purple line represents Zillow’s “raw” Home Value Index for the US [this is also the data set we use for our Most Splendid Housing Bubbles in America series]. Both indexes are set to 100 for January 2000:
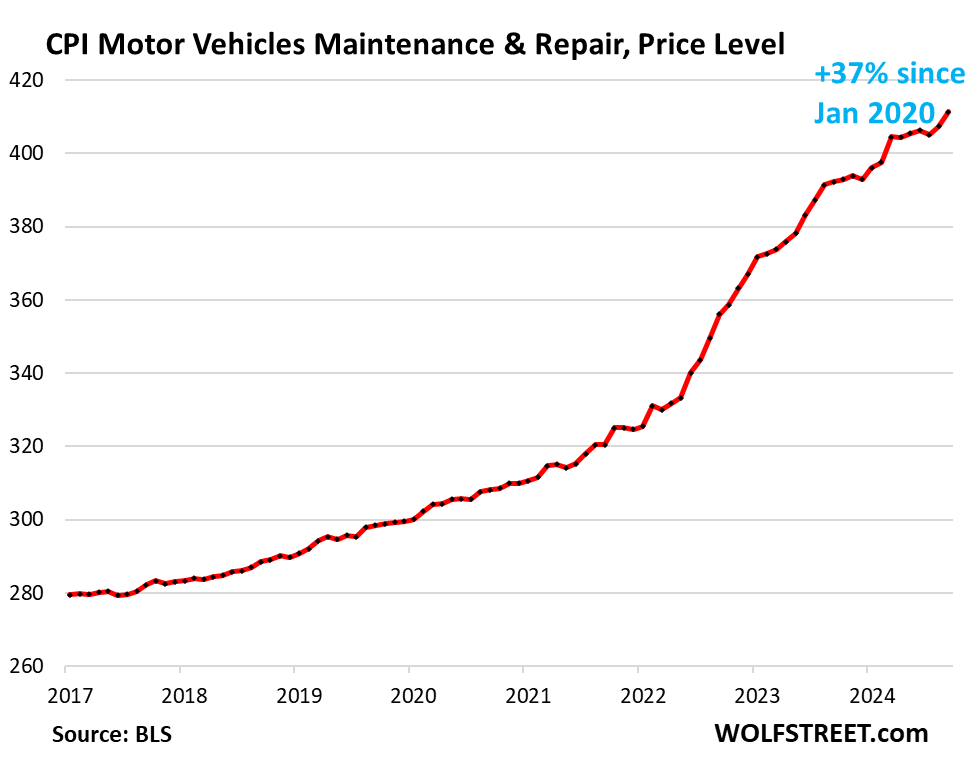
Motor-vehicle maintenance & repair inflation spiked by 12.1% annualized in September from August (+0.96% not annualized), after months of deceleration. This pushed the year-over-year increase to 4.9%, the highest since June.
Since January 2020, it has spiked by 37% as labor costs of auto-repair technicians have surged, and as prices of replacement parts have surged.
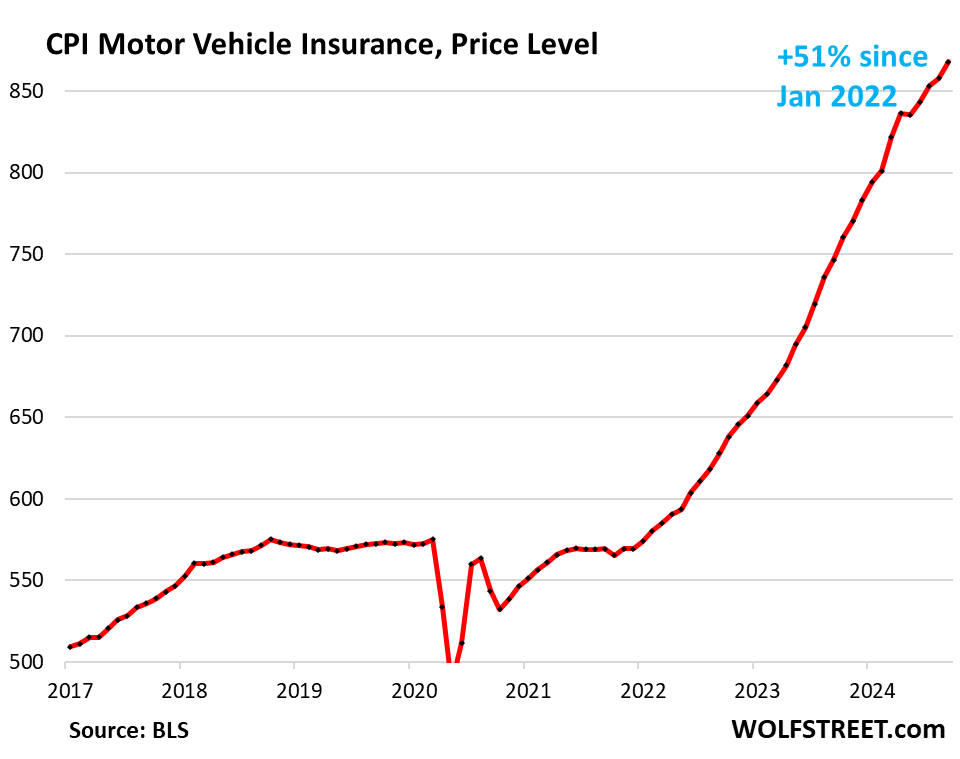
Motor vehicle insurance inflation spiked by 15.2% annualized in September from August (+1.2% not annualized), and by 16.3% year-over-year.
Since 2022, it has exploded by 51% because motor vehicle repair costs surged, and because used-vehicle prices (replacement values) had exploded in 2021 and 2022. But then it continued to surge, even as used vehicle prices have dropped, because auto insurers fattened up their profit margins. For example, GEICO, Buffett’s Berkshire Hathaway’s auto insurance unit, reported big increases in premiums despite reduced costs of claims that caused underwriting profits to more than triple!
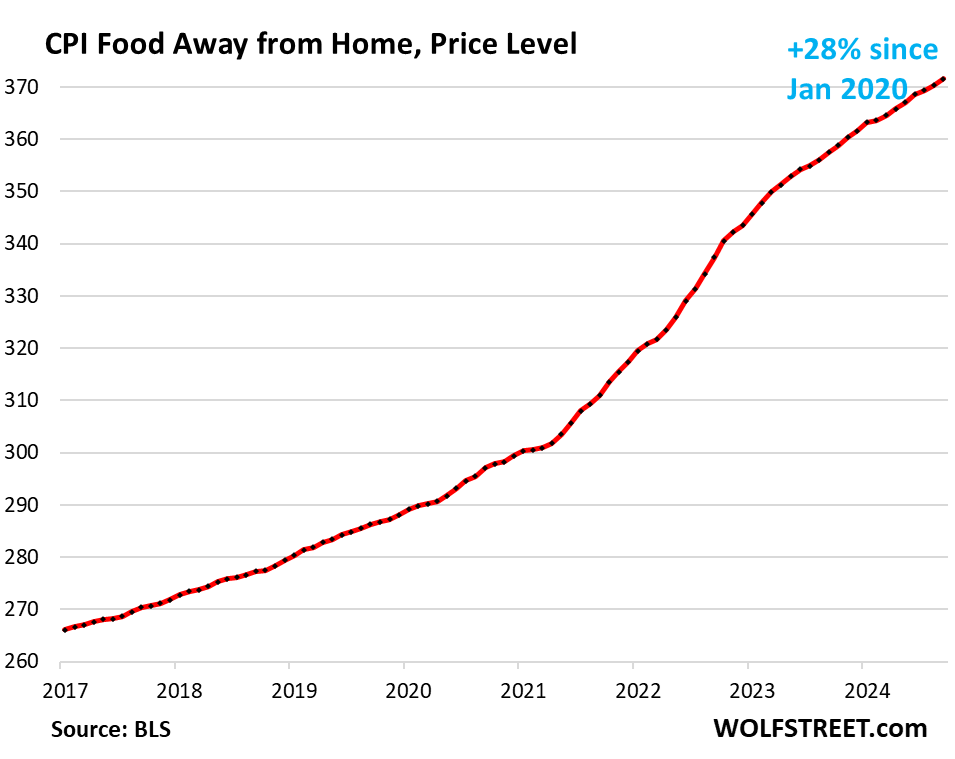
Food away from Home CPI – often called food services – includes full-service and limited-service meals and snacks served away from home, food at cafeterias in schools and work sites, food served at stalls, etc.
- In September from August annualized: +4.1%, an acceleration
- Year-over-year: +3.9%.
- Since January 2020: +28%.
Core services CPI overall has risen by 23% since January 2020.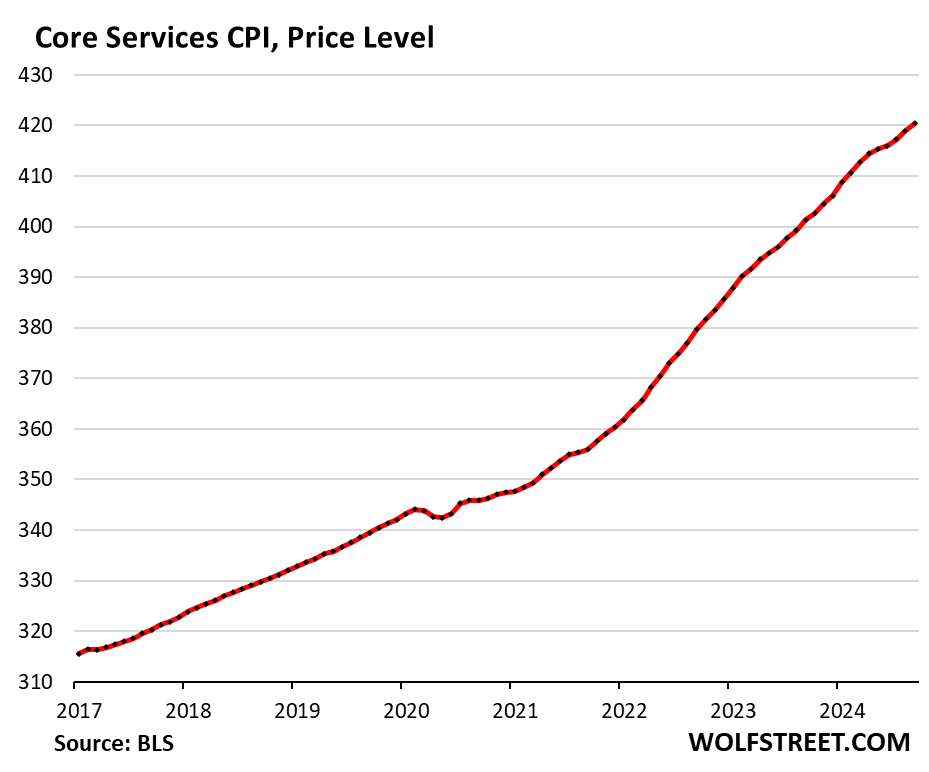
| Major Services ex. Energy Services | Weight in CPI | MoM | YoY |
| Core Services | 65% | 0.4% | 4.9% |
| Owner’s equivalent of rent | 26.9% | 0.3% | 5.2% |
| Rent of primary residence | 7.7% | 0.3% | 4.8% |
| Medical care services & insurance | 6.5% | 0.7% | 3.6% |
| Food services (food away from home) | 5.4% | 0.3% | 3.9% |
| Education and communication services | 5.0% | 0.1% | 2.3% |
| Motor vehicle insurance | 3.0% | 1.2% | 16.3% |
| Admission, movies, concerts, sports events, club memberships | 1.8% | -0.7% | 2.1% |
| Other personal services (dry-cleaning, haircuts, legal services…) | 1.5% | 0.1% | 4.1% |
| Lodging away from home, incl Hotels, motels | 1.5% | -1.9% | -2.8% |
| Motor vehicle maintenance & repair | 1.2% | 1.0% | 4.9% |
| Public transportation (airline fares, etc.) | 1.0% | 2.4% | 0.6% |
| Water, sewer, trash collection services | 1.1% | 0.7% | 4.8% |
| Video and audio services, cable, streaming | 0.9% | 0.0% | 1.8% |
| Pet services, including veterinary | 0.4% | -0.3% | 5.6% |
| Tenants’ & Household insurance | 0.4% | -0.5% | 2.2% |
| Car and truck rental | 0.1% | 1.2% | -6.8% |
| Postage & delivery services | 0.1% | -0.3% | 5.2% |
Durable goods.
New and used vehicles dominate. Other durable goods include information technology products (computers, smartphones, home network equipment, etc.), appliances, furniture, fixtures, etc. All categories have been experiencing price declines starting in late 2022, following the price spike during the pandemic. But the sharp month-to-month price declines in motor vehicles ended in September.
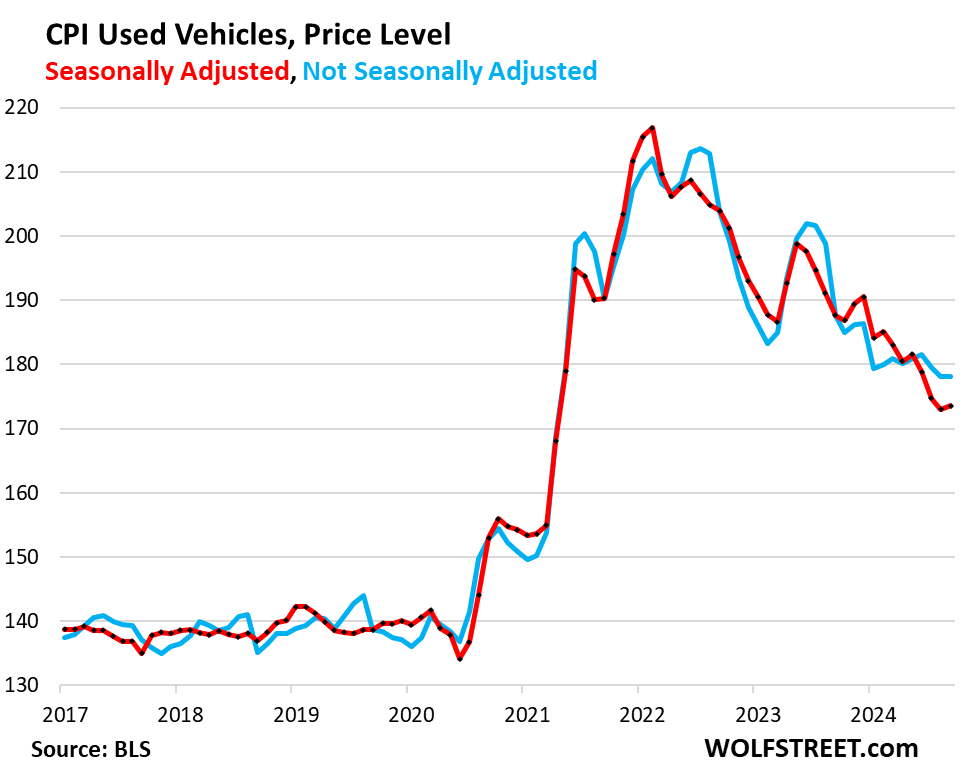
Used vehicle CPI flipped. In September, used vehicle prices did a massive U-turn, to an increase of 3.8% annualized (+0.31% not annualized), seasonally adjusted, from a series of month-to-month plunges — deep in the double digits (annualized) in 5 of the prior 6 months that added up to a historic plunge off an even more historic spike.
The plunge of used vehicle prices since mid-2022 from the crazy spike had been a powerful contributor to the sharp cooling of core CPI. But it has now ended. And this strong tailwind for cooling inflation has turned into a mild headwind.
We’ve been expecting this flip because wholesale prices – what dealers pay to replenish their inventories – flipped three months ago [we discussed this all along the way, most recently here: More Evidence this May Be the End of the Historic Plunge of Used Vehicle Prices that Had Pushed Down CPI].
This month-to-month rise reduced the year-over-year drop by half, to -5.1% (from -10% in the prior three months).
New vehicles CPI rose 0.2% (+1.9% annualized) in September from August, the second month in a row of small increases, after months of small declines. Year-over-year, the index fell by 1.3%.
Prices of new vehicles have been sticky after the blistering spike from early 2021 into early 2023 – unlike used vehicle prices – and have only given up a little ground since the peak, despite the glut of new vehicles on many lots, and amid calls for big incentives and discounts to move the vehicles. The index is up 19% from January 2020:
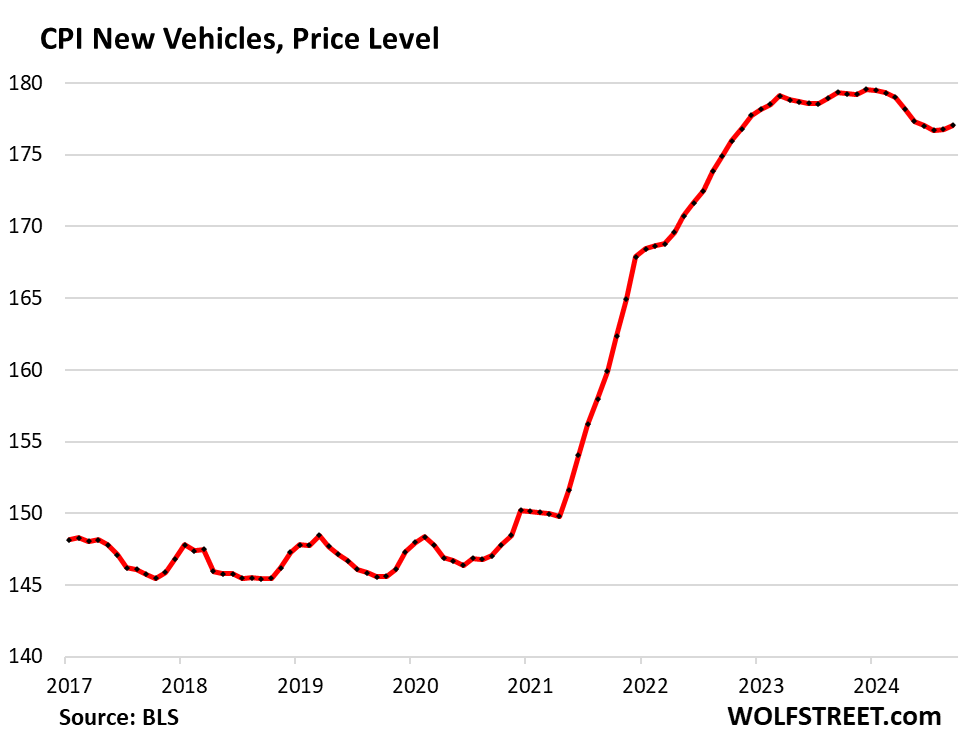
In the years before the pandemic, the new vehicle CPI zigzagged along a flat line, though vehicles were getting more expensive. This is the effect of “hedonic quality adjustments” applied to the CPIs for new and used vehicles and some other products (see our explanation of hedonic quality adjustments in the CPI).
| Major durable goods categories | MoM | YoY |
| New vehicles | +0.2% | -1.3% |
| Used vehicles | +0.3% | -5.1% |
| Information technology (computers, smartphones, etc.) | -1.2% | -7.9% |
| Sporting goods (bicycles, equipment, etc.) | -0.3% | -2.3% |
| Household furnishings (furniture, appliances, floor coverings, tools) | 0.0% | -2.2% |
Food Inflation.
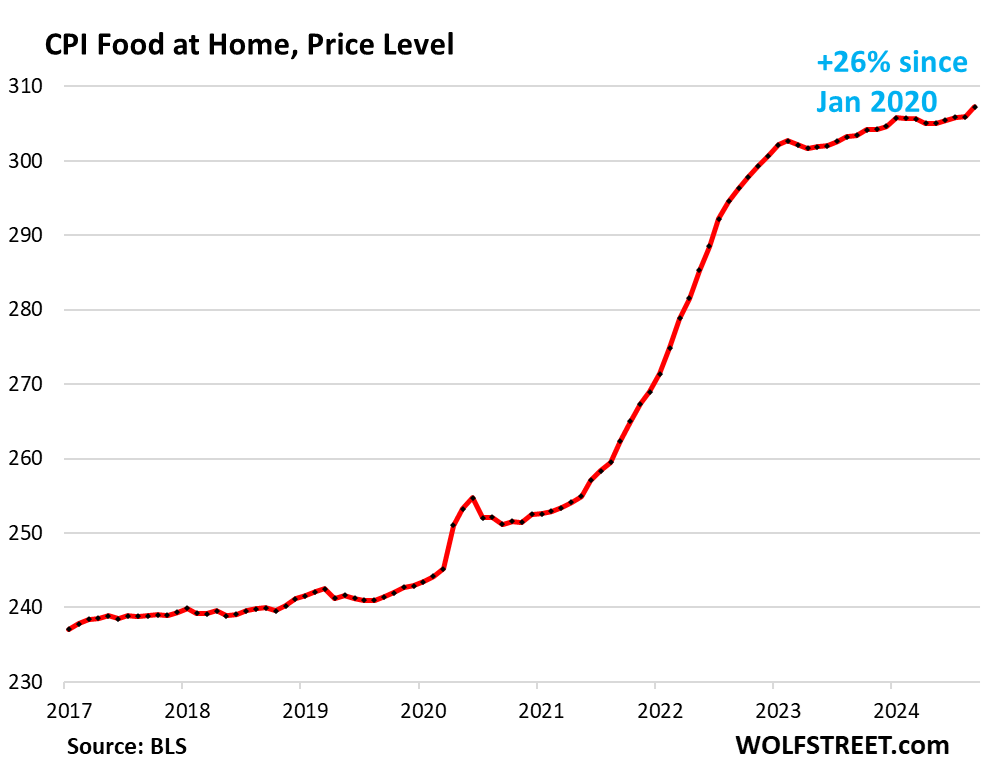
Inflation of “Food at home” – food purchased at stores and markets and eaten off premises – flattened out this year at a very high plateau, but in September rose again. The CPI for food at home is up by 26% since January 2020.
| MoM | YoY | |
| Food at home | 0.4% | 1.3% |
| Cereals, breads, bakery products | 0.3% | 0.1% |
| Beef and veal | 0.6% | 4.2% |
| Pork | 0.5% | 1.5% |
| Poultry | -0.1% | 0.5% |
| Fish and seafood | -0.2% | -1.3% |
| Eggs | 8.4% | 39.6% |
| Dairy and related products | 0.1% | 0.5% |
| Fresh fruits | 2.2% | 1.6% |
| Fresh vegetables | 0.0% | 0.2% |
| Juices and nonalcoholic drinks | -0.3% | 1.7% |
| Coffee, tea, etc. | 0.8% | 0.2% |
| Fats and oils | 1.1% | 4.1% |
| Baby food & formula | 1.2% | 2.6% |
| Alcoholic beverages at home | 0.1% | 1.6% |
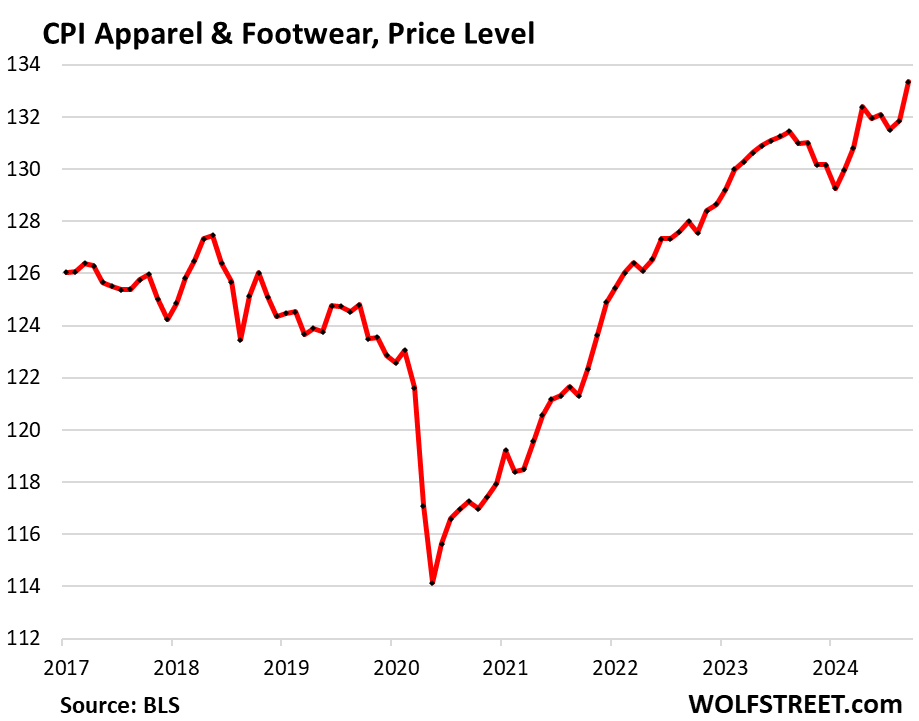
Apparel and footwear.
Apparel and footwear are components of nondurable goods, along with food, energy products, household supplies, and other stuff.
Month-to-month, the CPI for apparel and footwear spiked by 1.8% (+15% annualized). This increased the year-over-year gain to 1.1% from a flat reading in the prior month.
The trend of deflation in the years before the pandemic seems to have ended:
Energy.
| CPI for Energy, by Category | MoM | YoY |
| Overall Energy CPI | -1.9% | -6.9% |
| Gasoline | -4.1% | -15.3% |
| Electricity service | 0.7% | 3.7% |
| Utility natural gas to home | 0.7% | 2.0% |
| Heating oil, propane, kerosene, firewood | -3.1% | -13.0% |
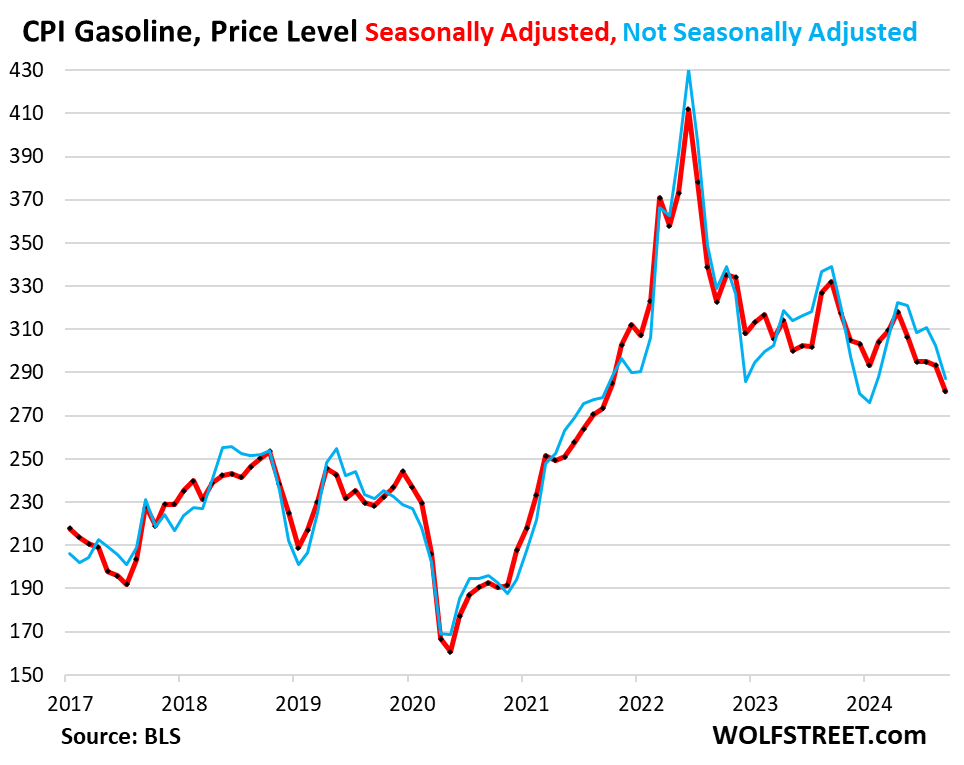
The CPI for energy covers energy products and services that consumers buy and pay for directly:
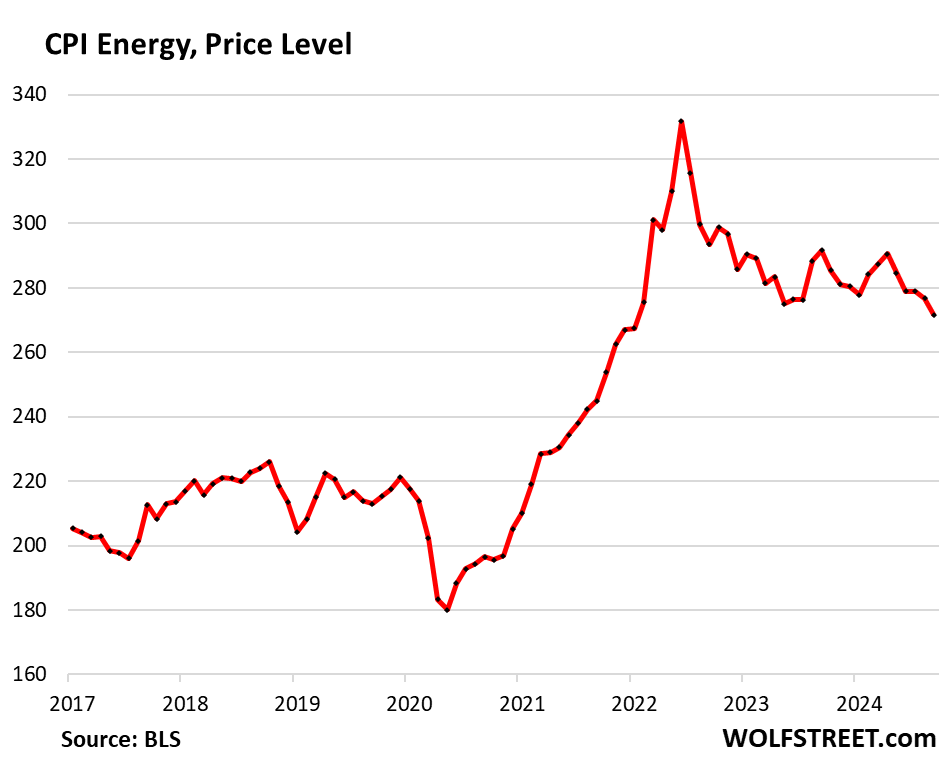
Gasoline prices, which account for about half of the energy price index, plunged in September from August, both seasonally adjusted (red) and not seasonally adjusted (blue). This was the big factor in driving down overall CPI:
Enjoy reading WOLF STREET and want to support it? You can donate. I appreciate it immensely. Click on the mug to find out how:

![]()
As you called it Wolf. Inflati5n ain’t going away
Wolf did call it. He should take Powell’s place.
oh…not so fast…MSM already gave the greenlight for another rate cut and mission on the way to accomplishment…it’s so predictable it’s not even funny…..
”
MONEYWATCH
U.S. inflation continued to cool in September, latest CPI data shows “
WSJ:
“Inflation Extends Bumpy Decline with Mixed Readings.”
On a month-to-month basis, the “core” Consumer Price Index – which excludes the volatile food and energy components – rose by 0.31% (+3.8% annualized) in September from August, the third acceleration in a row, and the biggest increase since March, driven by suddenly rising prices of used vehicles, in what is a sharp flip from the steep plunges before, and stubbornly high inflation in services (blue line in the chart below).
Says it all. Inflation, which is an insidious malady for an economy too have caught, is still alive.
The Fed is unlikely to cut at the November meeting of the FOMC and the setting of the FFR. IMO, the market for risk is at an all time low.
Ain’t going away…….?? Certainly not in home mortgages and rental. Thanks to the real estate companies and the national rental associations. And that’s probably the President’s fault right? Cause he controls those sales and rental prices……
I do like all of the other charts thought that show the strong downhill run since 2021-22. But that’s probably not the President’s trophy…….
What a mixed up shook up way to present this data…..Welcome to the White House whoever wins
The social security increase for next year was released today but nobody’s reporting it, 2.5%. I had to look it up.
I’ve been seeing the news reports on it for months now.
What will you all spend your $48 on?
5 Super Value Meals?
Or like 1 tank of gas?
Actually, anyone on social security are thankful that capitalism is normally distributed.
Personally, I hope it’s love.
Part of it on Medicare. I’ve read that Medicare premiums are projected to increase 5.9%.
Everyone reported it. Everywhere I looked I saw it. It was truly everywhere, including on the front page of the WSJ, left column near the top.
Overall CPI inflation has been pushed down by the plunge in energy prices, which has been going on all year, which you would know if you ever read my CPI articles.
2.5% will anger a lot of seniors. Not good for either Presidential candidate. Candidates won’t mention a small COLA because they don’t have the ability to increase it. Both candidates are saying they are going to help seniors but it is all tax code and/or more Medicare. My experience is that I don’t have enough money generating assets to benefit from tax code changes. More Medicare would probably benefit a few while causing premiums to go up for all. New boss same as old boss (won’t be fooled again) as the song says.
I don’t trust any of the govt data, so I expected official cpi to be down or nonexistent.
I do disagree with your tax premise, that not having substantial assets makes tax policy irrelevant to seniors. I get a very small amount from ss and pay back 10% of it in taxes. Eliminating the ss tax is a big deal to me.
You can trust the data. That’s factual and easy to get right given time to fully collect it.
It’s the interpretation of data that is difficult. Predicting it’s future is near-impossible. Highly-educated people spend entire careers on the latter and still those models get revised as more is learned.
Petunia,
“so I expected official cpi to be down or nonexistent.”
for once in your life, RTGDFA
Wolf,
Forgive me for not being more clear. I expected cpi numbers to be down but nothing I buy is down in price. I just came from the supermarket where I spent almost $500 on a month’s worth of cleaning products and a week’s worth of groceries. The total was actually frightening, but the store has tags everywhere telling us the price of an item has been cut. They are not down at all. Lying about price rises is now official policy everywhere.
Petunia,
Yes, CPI nailed it, you’re just ignorant because you choose to be because you could but don’t read the inflation articles, and so you don’t know that CPI nailed it, and you then abuse my site to spread your ignorant BS. Here is the CPI for food at home, straight from the article. For the table of price changes in various major food categories (such as “beef,” “fresh fruit,” “baby formula,” etc.) you have to go look in the article, I’m not reposting it here:
These are real, these spikes in necessities. Some not as much as others, some not at all. But… still traumatized by the price rises of “everything” not to long ago. The emotional state of our country is also to be a question.
Far off, I hear the dreadful sound of the economic death rattle .
The COLA should be indexed to an inflation basket that is actually relevant to retirees, not a generic CPI.
Seniors on average consume less food and energy and transportation, but have higher weight on medical/health costs.
Shelter is bifurcated depending on own-vs-rent-vs-LiveWithFamily, but everyone suffers from insurance and repair costs soaring.
I think Paul Volcker showed Fed chairmen how to whip inflation many years ago. This fed chairman hasn’t been as focused as Paul was, and I know Wolf has been trying to give reasons why this gradual job was as good as Volcker’s but we’ve had many instances since 1980 of fed funds rates at or near where they are now without really significant inflation. If we accept 3.3%, we’ll eventually end up in the Argentina boat.
Time to accept that he may have loosened too soon, and quit being so politically influenced. Your job is to maintain low inflation…for years 2% was the standard, so don’t stop until you get back to 2%.
Jerome Powell is reminiscent of Federal Reserve Chairman Arthur Burns; can’t figure out where inflation came from as Powell apparently doesn’t own a mirror and can’t tell the difference between descending to 2% skimming rate versus ascending to “the sky’s the limit.”
Perhaps. Certainly a different era. Burn’s mistake in financing the so called Vietnam war.
What choice did he have. His legacy currently is as a money printer responsible for the inflation of the late 60’s.
A Federal Reserve chairman, whose purpose is to fund the federal check book. Way before QE,
Yeah inflation took off at sea level , went to 30,000 feet. Then capt powell landed in Denver. Said “we’re here! Look we’ve landed safely!”
but now we’re Rocky Mountain high. ⬆️
“This fed chairman hasn’t been as focused as Paul was”
He is not only not focused, he has become a danger to everyone who believes in sound money and balanced budgets. His only focus is on the homeless population he has to look at on the way to his office. Now he’s become a politician by prematurely lowering interest rates right before the election and leaving a royal mess for the next administration. This man needs to hand in his resignation yesterday. Elevate Bowman to Fed chair.
If he were genuinely focused on the homeless population, he might have done something other than swell their numbers by driving the price of housing to the stratosphere.
Inflation wipes out government debt. Low interest rates make it less costly for government to borrow money. So if you are the government why not have your cake and eat it also? Voila, two percent interest and ten percent inflation. The devil take the hindmost.
So, inflation functions as a tax, side-stepping any need to raise taxes. Voters will not approve taxes matching the services they expect. I reckon the higher prices are how I am paying my full tax burden at this point. Goes back to the Revolution when the colonists didn’t want to pay for the French and Indian War. (I know I’m oversimplifying that.)
The GOP has made two words toxic: taxes and liberals. Americans expect government services (selfish self-interest only!) but howl over taxes to pay for them, especially if they aren’t directly benefiting from one service or another.
When it comes to liberals, they ignore the fact that the founders of this country were liberals, Enlightenment thinkers, who put their lives on the line, to initiate CHANGE from a despotic ruler to one of representative government. How blind can people be? Yet they parade around demanding free speech and gun ownership, rights they inherited from… liberals who wrote them.
The most psychopathological form of this selfish-self interest is Libertarianism, a euphemistic word for “I want it all, for me. F- the rest of you.”
How – …suspect infantilization of the zeitgeist is a historic feature of any leading society that enjoys a relatively-long period of general prosperity and geopolitical peace. (…though our abilities to study, analyze, and archive our human history are the greatest they’ve ever been, our day-to-day common memory remains stubbornly short, and willful ignorance stubbornly common…). Best.
may we all find a better day.
Volcker reign is a myth. But you’re right, Powell is worse. 2025 will show stagflation increasing.
Volcker was lucky. The hiking of rates, to an extreme degree, to stop inflation, was relatively untested. It worked, though. It started with a shutting down of residential construction and stopped the buying of existing homes.
…and the bums trying to bum a cigarette are going to have a harder time of it with them up to 59 cents apiece.
I’m a bum, just a different type of bum.
Bumming around town.
I’m bummed that the prices of everything, the car, the food, the house. The prices of the necessities of life are rising bigly.
This isn’t like the price rises of old, this is giving me the chills.
Wonder how long before I fall fate to the economic death rattle.
The graphs are absolutely nuts from 2020 on. The damage done to the consumer is holding tight. Add on 2-3%+ yr continually and keep our boat sinking forever FED.
Free markets aren’t working now with the monopolies in control. You coal miners must buy from the (corporate) company store; there are few other choices around.
The one market that amazes me, though, is bananas. Shipped 100s of miles north with the timing of the ripening worked out nearly perfectly. Still 62 cents per pound at the local wally world with virtually no price increases for years.
Where is that Wal-Mart? It’s $.39/lb at the Food Lion here in NC.
Biden’s Inflation Production Act is pumping hundreds of millions of dollars into the economy. This is a factor that increases inflation, among many other factors under “government spending” that causes inflation. Trump will be saddled with this in the next administration.
Spending is the number one problem.
I disagree. I think the number one problem is low wages.
The weight on top of at least 90 pct of the population.
Both are problems. The spending isn’t driving genuine prosperity-producing productivity.
And the failure to rein in monopolists, and other webs of corporate power, further suppresses wages. Corporate profits as share of GDP are at all time high. High profits make stock market strong. But it means workers aren’t paid as much for the value they deliver.
To earn more we have to produce more of value AND not have our share of the profits skimmed.
The establishment owns stocks and likes the current arrangement.
BG and Brant Lee, you’ve both pointed out the role of monopolies. Read David Tepper’s, “The Myth of Capitalism”. He goes through industry after industry here in the U S where duopolies or outright monopolies are controlling prices, supply and demand. He is not advocating socialism; he’s arguing that these monopolies are choking capitalism – and controlling the regulations of those industries – and need to be broken apart or truly regulated.
It’s time to stop the sh*t about one president or another causing this or that. The neglect and inflation is coming from Congress and their overlords, the campaign financiers.
Trump is most likely using the Eisenhower administration for ideas. Currently there is a large industry in importing labor and offshoring production. Just as large an industry could be built on tariffs and deportation. The Eisenhower administration is an example of this. See Operation Wetback (Wikipedia) and tariff negotiations during the 1950’s.
As Friedman said: “Inflation is always and everywhere a monetary phenomenon, in the sense that it cannot occur without a more rapid increase in the quantity of money than in output.”
So… what happens when money supply stays the same but production shuts down? Remember COVID? Stocks were hammered although some products were seeing windfall profits (supply shortages/supply chain disruptions) while others were collapsing. The issuance of money was to off-set these inevitable price shocks (inflation).
As in 2008, these were emergency measures, taken with great risk and unknown consequences, to right the economic ship. Don’t pillory the Fed. They were doing the best they could with relatively no precedent to draw from. Truly a black swan event.
That doesnt make sense. Putting more money into the economy means more is available to be spent. If theres no stimulus, producers would have to cut prices if they wanted to continue to sell products. The Fed as well as the politicians and their financiers are definitely at fault. Its the stimulus thats bad, not the recession or depression. Since then have even more debt, 20% inflation, strikes, wars, etc. we’d have been much better off without the stimulus.
Revisit the Great Depression. See what non-stimulus produced.
CARES Act, 2.2 trillion economic stimulus, signed into law by president Trump. Its both the Republicans and the Democrats causing the inflation. If people dont want inflation, they shouldnt vote for either the Republicans or the Democrats and vote Libertarian, their platform is to cut spending and debt.
Libertarians, and there are many shades of Libertarianism, boil down to: get the government off my back, but make sure that the programs that I need, the services that I benefit from, the defenses that I want – to protect MY assets – are there, but shave off the rest. Equality & Justice – who gives a flyin’ f. Liberty – that’s all we should concern ourselves with.
Sounds like you have it backwards.
Trying to uphold asset bubbles is the way of the current system that operates contrary to Libertarian principles. Libertarian platform is to stop govt suppression of interest rates, which the Republicans and Democrats have done by printing money out of thin air to buy mbs and other bonds. Libertarian policy gets rid of the cheap debt funded by savers, inflation, and future generations, the cheap debt that fuels and props up asset bubbles such as in single family homes, causing high rent inflation.
Equality of opportunity, not equality of outcome.
Even the ss increase was above 2 percent above the Core Fed Target.
I work with a lot of young people and feel terrible for them. Most of them came to the conclusion that the American dream and the system failed them. They think they’ll never own a house or live the same quality of life as the previous generations. I can’t say they’re wrong.
Inflation killed this country in two short years.
When I was one of the young people, inflation was 15% and unemployment was 8-10%, and I tried to find a job with a fresh graduate degree and no place to go. It sucked. “Quality of life” wasn’t even on my mind. Survival was. It was a terrible time to get out of school. My entire age group had the same issue. Some were luckier than others. In the end, most of them struggled for a while and got it worked out.
Now unemployment is 4.1%, there are lots of good jobs — though maybe they don’t chase down candidates like they used to a couple of years ago — and inflation has calmed down a lot. Inflation is now lower than it was for a big part of my life. Lots of young people make huge astonishing amounts of money, others struggle. Sure, not everyone gets the same.
No one ever told us that it would be easy to start out. The American Dream back then was to start with nothing, work very hard for a long time, and finally get to a place where you’re comfortable. That was the American Dream back then.
You don’t get ahead working 40 hours a week.
Very true, in many cases. It might take 60-hours-plus.
Housing affordability is a big difference between now and then. Which has adverse effects on household formation, fertility.
I got out of school that same time. Self-employed, worked a lot of all-nighters. I didn’t start into a house until I was 37. I think a lot of youths think it should happen faster or else it has failed them for all time. Cycles come and go, over longer horizons. My parents got lucky, buying a house in 1970. Then inflation took off. 24 years later I paid so much more nominally for so much less house. Not complaining, though. It has worked out.
Now the American Dream isn’t hard work. It’s to buy some asset or equity, talk it up on social media and hope you can convince some else to buy it for more on debt. That’s SPACs, private equity, crypto bros, meme stocks, some real estate and every other get rich quick scheme in a nutshell.
When were you born Wolf?
Germany
So we’ll spoken. No one credit cards, Jobs were often difficult to get though in the late 60s – 70’s you made the best of an opportunity or took what you could get. 180 days of Union Strikes in Rubber, Steel, and Auto in 69-70 wiped my families Aviation Buusiness off the face of the earth though my parents did not quit. They sent us off to work on family farms which made us proud to work even though there wasn’t pay. In Highschool there were Co-op programs I worked,40 hours per week at1.50 per hour. Save for an Auto and as you stated slowly worked it all out through education, hard work and by not complaining about what others had compared to me.
Or imperialism. Being involved in wars for all but 17 years of our history comes with a cost but also that created incredible wealth at the same time as conflict is often directly connected to economic prosperity.
Two years of inflation does damage but in a healthy, balanced economy it should recover. Poor choices often take time to catch up and no small part of our debt is linked to Iraq and Afghanistan and the broader region.
Vietnam and the War Against Terror both happened against a background of tax cuts and government borrowing. We all pay a price amortized across our lives. I think “W” Bush’s presidency the worst in a half century, or more. The monetary chieftains learned to spread out the impact of poor choices, but I’m pondering how much that is an improvement.
…where the blood of the fallen was devalued even more as the tax cuts were distributed among those remaining safe at home (…apologies for the rising bile in my throat triggered by phleep’s apt observation…).
may we all find a better day.
Failure, I was born in 1997, and I approve this message.
Myself and most of my peers that I’ve talked to wouldn’t dream of joining the military and fighting for this country. Why fight for a nation that seems to hate us?
“Why fight for a nation that seems to hate us?”
Ironically, it’s that attitude that makes many in the nation hate you.
Steve,
I know a bunch of Millennials and Gen-Zers that are out there kicking ass and taking names, they’re doing stuff, making money, advancing their carriers, running companies, starting families, getting divorced, LOL… They bought houses and condos and nice cars.
Millennials and Gen-Zers are the big home buyers right now. They’re the ones that drove up prices in 2020-2022 during the price spike. Those were the young people, some of them buying for the second or third time.
It’s not generational, it’s personal!
Why do you think these 6-9 million immigrants came over the past three years? They came with nothing, and they’re going after the American Dream, and they’re starting from scratch; and they’re going through hell to get there. And many of them will eventually get there.
Has this comment section suddenly gotten to be a hangout for spoiled self-satisfied whiners that complain because they didn’t get everything handed to them on a silver platter by the time they were 25? This stuff gets fatiguing. Whine into your pillow.
Indeed, part of the problem is that some young people can’t afford a house because other young people bought three or four of them and turned them into short term rentals.
The policy errors of the last few years created a gilded age for some and priced others out of homeownership seemingly for good, but it doesn’t break down along generational lines as neatly as some want to think. Older poor people are, by and large, still poor. Younger (and older, and in-between) people who were already affluent took advantage of cheap loans and printed cash to get even more affluent.
Wolf,
As Immigrant, I can agree and relate to work hard part and start with almost nothing to become something. After all, US is still one of the countries people want to migrate to. If I cant make in this country then I am not sure where can I? If someone doesn’t believe this, just go to US Consulates all over the world and see the people lining up.
But I do feel like FED screwed Savers, Fiscally responsible( dont know does if matters) for 13 years.
I came decade back, I felt I should be Fiscally responsible person. Dont get into too much debt. Home prices were so high so thought let us save first. But then after decade it feels like we were the fools to wait. Look at home prices. Those who bought it early and cheap, FED kept on giving them cheap money for decade now. Prop 13 in CA keeps property taxes low even though those properties are Rental now.
May be I dont have US Citizen mind. But isn’t owning a home is big part of American Dream?
Sure it can be my fault for not taking risk. But FED never played fair. They never let it be free market. Kept on buying MBS, Kept the ZIRP for 13 years. Always intervened in favor of Wall St. Huge balance sheet expansion, excessive QE. Aren’t they responsible for this housing crisis? I am not saying they are 100% responsible. But they have to take big chunk.
“But I do feel like FED screwed Savers,”
Absolutely, and not just savers, but yield investors in general — from 2008 through mid-2022 — that’s a big class of investors. It caused all kinds of damage to pension funds, including the Social Security Trust Fund, whose interest income on $2.7 trillion in Treasury securities plunged.
Well said Wolf. Lots of opportunities to make money.
I was living the proverbial paycheck to paycheck until 40ish. Prior to 40 had the kids, home loan, car loan, etc. Because of inflation, over the years the mostly fixed house payment was not so painful because my salary went up and the payment was less and less % of my income. Cars eventually paid off (Owned cars until start falling apart. One hit 17 years, one 18 years, and still own a truck that is 22 years old) and those car payments went straight to savings once the cars were paid off. It is like a bonus in pay.
Your savings accumulates rapidly once you pay off your debts on assets that go up with inflation.
Well said Wolf.
Steve B, I’m a millennial too, but I DID serve this country in the military, and proudly!
Wife and I worked our butts off, had three kids, bought a house in 2016, sold in 2021 for almost double what we paid for it. Bought (maybe stole?) another house last fall for 360k. 5 acres, 2k sq ft, and room for all the little ones. But it took TWO YEARS of searching and living with family to make it happen, waiting on a deal. Victim mentality seems to have a strangle hold on half of this generation. In my opinion, it’s never been easier in my lifetime to make money. You just have to get out there.
I don’t think people are whining or avoiding hard work. I think people are upset about the 40-50% spike in housing prices over 2 years in a lot of areas. If you weren’t lucky enough to be in a place to buy in 2020/2021 you got pretty screwed. The people who were able to buy got pretty lucky.
The difference in the those two groups in nothing to do with hard work or even financial literacy. It’s driven solely by a Federal Reserve who saw what was happening with both the housing market and inflation and sat on the sidelines. Transitory, really? The Fed thought it would what, deflate the housing prices it was seeing? The Fed doesn’t ever intentionally deflate housing prices… it only props them up. The fed didn’t need to go to 5% in fall of 2021 but it could have went to 2% to inhibit the mania.
MM1,
In some markets, housing is *down* vs 2 years ago. See Wolf’s article about that guy in FL.
“In some markets, housing is *down* vs 2 years ago. See Wolf’s article about that guy in FL.”
Yes, in markets that are actively being destroyed by serial natural disasters, housing prices are, to the surprise of nobody, going down.
In the rest of the country, that is not the case.
House prices became a bubble and it too shall pop. Housing goes in waves. The GIs returning from WW2 were also priced out of housing, can you believe it? You’re not alone historically, just in the wrong spot of the cycle.
In a bubble, people see things going up in price, so they want to buy to get in on the capital gains, and that momentum drives the price up further. Eventually sanity returns but only after prices overshoot and buyers go on strike.
Momentum has now stalled for 2 years and in many cities started to reverse, as Wolf has shown.
When prices are going down, the bubble works in reverse: owners don’t want to lose money so all the hoarded supply shows up for sale and drives prices down further.
Lowering Interest rates won’t matter too much because when prices are falling, buyers will hold out for better prices. And for sellers, net profit is all about the sale price.
There’s no stopping the coming bust, it will be epic and take a few years. But you need to be prepared for it, because under current policy regime it will be followed by another bubble.
Young people who are serious about their future need to save like crazy, and invest in themselves, in order to be ready for their turn. It has always been this way.
In past articles, Wolf has posted graphs showing “bubble 1, bubble 2, …” Graphically, these are bubbles that inflate and deflate, not back to 1982 prices, but substantially lower than the current bubble level. Bubbles are due to human error; if prices get ridiculous, back off. If you’ve absolutely got to buy crypto because it just keeps going up, take a cold shower.
Feeling bad when situation changes to negative is fine and normal. Complaining is OK to a point. Then steps should be taken to understand the changing reality and do something about it that is still in your control.
At your age I dropped my existing live and moved to a different continent to start again from scratch without any external help. Now when older it seems crazy what I have done. But when you are in 20-ties the drive forward and available energy is amazing. The live is still in front of you. Don’t waste the time whining.
It seems to me that young people expectations are not realistic. Blame the Instagram and TickTock? They wand it all now.
Steve B is tough as nails, he just needs to be chased around the block by a hungry bear.
Hard to know what’s up or down in this world… until a bears hot on your heals.
” They think they’ll never own a house or live the same quality of life as the previous generations”
Every generation thinks that. Report back in 20 years and see if it works out that way.
Every generation? You mean the generations upon generations where the cost of housing increased at the rate of inflation? Inflation adjusted home prices were more or less flat between 1902 and 1998. That qualitative truism has been a snipe hunt for at least a decade… nowhere to be found.
Sorry. Home prices started taking off around 1995, not 1998. I was eyeballing it on a 125 year graph, so you’ll have to forgive me. That’s about the time that unsecured credit (aka credit cards) started flooding the market, BTW.
BS. There was a lot of oscillation in the “more or less”. National averages hide much stronger regional trends. I studied a century of prices for the town I live in, before buying.
1946 was an epic housing inflation.
So were the late 1990s. And 2002-2008.
The current bubble is the biggest of them all but it won’t last.
Not BS. It’s the *inflation adjusted* price index for homes. In 1902 it was 100. In 1995 it was 113.45. The data comes from Robert Schiller’s data. Whatever twisted belief you have in your head doesn’t apply. Your “truth” isn’t real just because you are too lazy to do the real research. There are 3 long flat segments in the historical data: 1902 to about 1920, 1920 to about 1945, and 1945 to about 1995. There are some small wiggles around two years, 1979 and 1989, but the overall character is flat from 1902 to 1995.
One more data point: In May 2022, that index is 225, so yes, people today really are getting screwed and have it worse in tems of a 125 year time scale that took a dark turn around 1995.
I’ve always thought that Japan set the model for inflated real estate, then financial engineers around the world tried to copy the model to make personal gains at the expense of whole societies. Weak government leadership really dropped the ball there.
JeffD, wrong about the credit card orgy. I distinctly remember an NPR program, circa 1982 or so, when people were calling in describing how they maxed-out their 11 plus credit card limits and have now gotten religion. I was so astonished, I bought the cassette of that program from NPR to share with my wife.
How – always felt the explosion of credit-card credit in that era went a long way to mask the flatlining of real wage growth from the same period…
may we all find a better day.
@HowNow,
1995 is definitely about the time when credit cards started taking off. Here’s the link to the chart that makes it crystal clear:
https://www.visualcapitalist.com/wp-content/uploads/2023/10/credit-card-balance.png
For the millionth time: Credit cards are primarily used to make payments and not to borrow. Over $5 trillion a year gets paid for with credit cards, and only a minuscule amount becomes interest bearing debt. Most of it is paid off by due date.
Credit cards are now the universal payment system in the US, along with debit cards. What credit balances show is that credit cards are being used for spending. Credit card balances are month-end statement balances, and most people pay them off in full and take their 1% or 2% cash-back. They do not show interest-bearing credit card debt.
So what happened in the 1990s? Credit card balances took off in the 1990s because consumers started buying things online with credit cards, instead of buying it at the store and writing checks, from airline tickets to shoes. And even at stores, they started paying with credit cards, rather than writing checks. Today almost no one still writes a check at a grocery store. Today, checks are used almost exclusively for large amounts (when you buy a car and pay cash for it).
The “country” fails most people. By design. They know it. All you have to do is look at the life expectancy numbers, or take a trip to whatever small town in your state. Rural America is the current loser along with anyone who works for an employer, or anyone who was not a homeowner in the last 10 years. All losers in the game played now.
According to the people here they are just whiners who want the world handed to them.
Unfortunately, I live in reality and have to witness most of my family struggle to live in a system that tossed them overboard. Nothing like watching senior citizens struggle to buy groceries because of this inflation spike. But I’m so glad lots of people got to buy homes at a low rate using PPP “loans” and the cost of crappy made in China goods have decreased a bit. I’m sure I can drive an iPad to my office.
I own an expensive house and made a lot of money during the covid boom. But I also see the glaring issues it caused society.
Failure,
What you’re saying, and I agree with that: it’s personal, not generational.
This society has always been that way, creating huge opportunities that some are able to take advantage of and others are not — and in the past, some were systematically and legally blocked from taking advantage of them — and so we have this huge wealth disparity and income disparity. But it’s not a generational thing, which is why there are so many rich young-ish people and so many boomers Gen-Xers living on the streets, and vice versa.
Wolf, I never said that it was generational, per se. It’s more those without houses and other assets, and those are more likely to be younger, but not exclusively. Seniors on fixed incomes are getting screwed too.
@Wolf
I agree that it isn’t generational. But the people who have it the worst right now are the under 25 crowd and the seniors on a fixed income. I’m sure there’s also plenty of middle-aged Americans who have it just has bad.
As Wolf described. I was young once as well. All about expectations. These “young people” have had too many choices and grand expectations. They have never lived the “survival” mode. My first house purchased in early 2000 at 43 years old had an 8% mortgage and I was happy. Worked 50 hours a week. Those “young people you work with” never had it better, and it’s the same with my own children and grand children. Their expectations are simply going to have to change.
A lot of tone deafness in these comments.
You don’t have to agree with us, you just have to understand why we’re pissed off. If you don’t care as long as you have yours, that’s fine too, but just don’t be surprised when political winds don’t go as you wish.
Steve B – a good observation of human nature and it’s at once magnificent/miserable history on the spacecraft…
(True equilibrium always sought, rarely attained…).
may we all find a better day
That energy graph almost mirrors the oil graph.
Here in NC the power companies burn A lot of natural gas. I guess it comes from a pipeline somewhere? From like Texas or Canada maybe.
Also some solar and nuclear. But I dunno how much the solar arrays help. Hopefully some! Although I doubt I see any kind of discount on the bills which have almost doubled in the last year.
Natural gas is the cleanest burning hydrocarbon in existence, and we have a virtually unlimited supply of it in the western hemisphere.
Abundant energy is keeping overall inflation from being much higher.
Where I live in NYC every used car dealer/used car lot is overstocked, and I mean there is literally no place to put any more cars, so it looks to me like a humongous used car glut is coming, if it is not here already.
I am watching the stock Carvana (CVNA) it has a market cap of almost $23 Billion and it has done nothing but lose money since its IPO. They have $5 billion in debt that they will NEVER be able to repay. 14% of the float is short, I don’t know how this stock stays up, it is a train wreck waiting to happen.
I am still keeping my prediction that the S&P is a LOCK to see 4500 again at some point.
Feels like when it comes to cars and houses, there’s still a huge disconnect between dealers/sellers who are delusional about what they want vs what’s the reality…
This is a more extreme end of a comparison, case in point. Brand new Z06 one dealer advertised $10K off MSRP (which is not something one can dream of back in the insane time) to SoCal dealers still want $5K markup over MSRP. You see the same thing with houses for sale all over the place.
Rule ^ of investing. Speculation over the price a certain stock is gambling.
Far from investing.
Florida, Georgia, NC need a lot of no flooded cars. This demand will change the market some, particularly if it is the insurance industry that is picking up most of the bill.
Knock-on effects from global warming. In time, the insurance companies won’t exist. Those companies/investments will morph into something other than insuring property or, probably, human lives either.
As a locomotive engineer — looking out four months, I see risk of a collision between sticky inflation, overly aggressive Fed tinkering, higher yields, lower equity earnings that spill into lower P/e ranges, increased volatility, decline in gold and continual data ambiguity revisions that slow the GDP train down, as it descends from the mountain pass.
The engine isn’t going to be burning the same level of fuel in regard to the “normal” level of the last four years.
I think there’s also going to be a deficit premium added into future trading — there’s no free lunch ahead.
More rate cuts = increasing the brake pipe pressure. When the Fed is done cutting, you’re back at 90psi.
When they eventually ends QT (whenever that is), you’ve moved the throttle to notch 1. Rescuing the repo market, notch 2.
If they actually do QE again (very unlikely imo), that’s notch 8 grinding up a hill w/ 5000 feet of train. Just watch out for those wet leaves, it’s fall after all.
So you are buying TLT instead of shorting TLT? You’ll need to post under the TLT alter ego.
Gemini AI says this:
So, while it’s true that Treasury yields can decline during a repo crisis, this doesn’t necessarily contradict the general trend of rising interest rates. The specific dynamics can vary depending on the severity of the crisis, the actions taken by central banks, and broader economic conditions.
I was just trying to make an analogy to railroading, don’t read into it too much.
P.s. I just added to my collection of TLT puts with January, April, and July 2025 expirations. Not investment advice.
There is that possibility,
as opposed to the financial success that currently makes us susceptible too the romance of life.
Inflation, supposed to have tapered off by now, remains with us. This situation is complicated by the globalized economy we live in, with many players affecting the inflation environment. Still, the core player remains the United States, and the U.S. can be said to be the “home of inflation.”
Unless there is a systemic collapse, all roads lead to higher inflation, going forward. The question is, how far forward, because the reintroduction of QE can keep the plates spinning for a (relatively short) while.
“Home of inflation”? No. This is the “Crypto Capitol of the World” according to someone running for President.
“That OER runs hotter than rent is unusual.”
Note that the last time OER > Rent CPI was right before inflation took off.
Wolf, minor typo: above your Core services CPI overall graph, surge should be surged.
Incredibly valuable analysis. Thank you.
Inflation whack a mole… Shelter cools but almost everything else pops🤷 25bp cuts the next two meetings then a long pause coming?
Time will tell
Instead of just the year-over-year inflation comparisons that we are given, I’d like to see the “five year over five year” comparisons. They don’t show us that. It would probably scare the crap out of everyone. If three percent/year is the new normal that is a tragedy. I don’t believe the Fed genuinely cares about keeping prices down.
RTGDFA
I did RTGDFA. You do very good work with all of your charts. I was referring to the TV talking heads and more importantly, the Fed governors and their cheerleading followers that seemingly want to avoid discussing the huge cost of living increases from five years ago, and focus on feeding us only the year over year numbers to convince us that everything is looking so rosy now.
There were also the biggest wage increases in decades. In 2021 and 2022, wages were increasing at a slower rate than inflation (which was spiking at the time). But in 2023 and 2024, with inflation calming down a lot, wages continued to surge and outran inflation.
You cannot just talk about price increases over the long term, you have to talk about wage increases in the same breath. They go together. One if price inflation, the other is wage inflation.
On deflation (slightly off-topic):
One would have to be hard-pressed to find an instance in modern history of “wage deflation”. Wages may not rise much, e.g. “From 1973 to 2013, hourly compensation of a typical (production/nonsupervisory) worker rose just 9 percent while productivity increased 74 percent.” (from Economic Policy Institute), but they almost never go down.
And this on deflation from Wikipedia:
“Throughout the history of the United States, inflation has approached zero and dipped below for short periods of time. This was quite common in the 19th century, and in the 20th century until the permanent abandonment of the gold standard for the Bretton Woods system in 1948. In the past 60 years, the United States has experienced deflation only two times; in 2009 with the Great Recession and in 2015, when the CPI barely broke below 0% at −0.1%”
Wolf shared the price index graphs and % increases since Jan 2020 for several of the categories in this article.
“I’d like to see the “five year over five year” comparisons.”
???
I just switched my diet to a vegetarian “South India” diet from my Mediteranian diet. Saving a lot on food. Inflation in food is no longer a problem for me. The grocery stores can go pound sand with their overpriced junk/processed food.
@SwampCreature, haven’t seen you in the comments for awhile. Did you go on vacation?
Well swamp without at least the opportunity too at least look at you. Are you trying too peddle some kind of magic elixiar.
A discovery that a vegitarian diet has no measurable effect on longevity,
dang
I have to agree with you on your observation that vegeterian diet has no effect on longevity. In India 30% of population are pure vegeterians (but milk,curd,cheese included) Due to starchy +sugary diet diabetes is high and most kick the bucket by75-78 years. My parents died at75-76 . Iam a healthy 65 (vegie for life and never had an egg even), but I dont expect to live beyond 75-77. Those living in mountains on fruit+ nuts diet do live healthy till early nineties.
South India diet….with or without the chillies?
South India has atleast 4 cuisines . Chilli (mild/modrate/severe) depends on the regional cuisines .1. kerala (Trivandrum) has a coconuty cuisine .2.Karanataka (Bangalore) has a coconuty+hint of jaggery in all sour soups &veg curries (best cuisine in south india) .3. Tamilnadu (CHENAI)is more spicier than the abpve 2 and the veg tiffin& veg curries are similar to karnataka but more spicer. 4. Spicest south India cuisine is Andhra (Hyderabad) cuisine. even other south Indians find them too spicy. As a south Indian and a born vegeterian I surivived 10-15 years in HongKong & china. But my best vegetebles shopping is at Sunland /Vannuys california mexiacan supermarkets . Mexicans supermarkets are a veggie paradise. Only tinned stuff I buy at Ralph or dollar store are greenpeas/ corn/gorbanza beans/ cannolini beans etc (all kind of legume in brine)
Good to hear your taking your health to a higher level, Mr creature.
As Wolfs would say Americans like their trucks and apparently junk food too, large coke, large fries and a luxo burger…yum.
“Food for fatso”, my new restaurants name….place will be packed.
Name’s been taken: “Fat Burger” and “Fat Daddy” here in NC, home of Smithfield’s hog farms. Just don’t be down-wind of one of them, or the Purdue and Tyson chicken ranches.
According to Wolf’s article, the highest inflation for foods was for beef/veal, eggs and fats/oil. It’s in our power, folks, to stop eating that sh*t. Prices will fall, and, later, you can start engorging yourself on cheeseburgers again.
Why is egg inflation so much higher than all other food inflation?
The chicken union?
Apparently it’s the bird flu.
Chicken inflation caused the egg inflation.
And the chicken inflation was caused by the egg inflation.
Johnny5 gets my vote for Comment of the Month
Agreed!
A year ago, chicken deflation caused egg deflation which caused chicken deflation.
Wolf,
I’m not sure if you keep these comments on a list elsewhere, but maybe at the end of the year publish a list of Top 20 Best Comments that year. I laughed so hard when I read “The chicken union?” that I spilled my coffee all over my keyboard, desk, and papers. I pictured ‘roided up chickens at a picket line blocking entry to the chicken coops.
It’s the only protein people know how to cook?
Many of us have said this, higher for longer! The second wave of inflation is just getting started.
Powell doesn’t know much about money.
Stephen Goldfeld labeled the disparity: “instability in the demand for money function”
See:
New Measures Used to Gauge Money Supply WSJ 6/28/83
“The experimental measures are designed to resolve some of the confusion by isolating money intended for spending, the money held as savings. The distinction is important because only money that is spent-so-called “true money” – influences prices and inflation.”
Monetary flows, the volume and velocity of money, the proxy for inflation, is not a long and variable statistic. And no money stock figure acting alone is adequate as a guidepost for monetary policy.
Money flows bottomed in August. They will accelerate going into January 2025.
7am and my brain certainly isn’t working yet ( if ever).
But in theory, which is the current primary driver of inflation:
– Massive government deficit spending
– The massive amount of money injected into the system by QE
– The modest level of QT that has been occurring for awhile
– “Sticky” inflation ie once it’s starts, it is hard to stop – see Services CPI as an example
– Other factors?
I thought QE primarily gave us inflation due to increasing the money supply and deficit spending “just” gives us a huge debt problem. Simplified view, of course. I ask because even with QT, the increased money supply (38% in M2 since start of covid) would imply more inflation. But M2 increased by 32% the 4 years prior to covid and inflation was running well less than 3%.
How did M2 increase so much prior to covid but inflation was “under control”? Sorry I thought I understood the basics but my brain isn’t remembering this morning.
Good points, but not M2…
M2 is a trash measure. If a $150,000 CD matures, and the cash is paid into my checking account, and I leave $75,000 in my checking account and buy another CD for $75,000, then M2 jumps by $150,000 even though nothing really changed.
There are other problems with M2.
An economy naturally creates and destroys money with the economic ebbs and flows, and that’s not the problem. The problem is money creation by central banks through QE. But the relationship is much more complex and lots of factors go into inflation, including what I call the inflationary mindset (consumers willing to pay whatever, companies hiking their prices because they know they can without losing sales, emboldened employees asking for and getting big wage increases by companies that are confident they can pass them on, etc.).
A recession has the effect of potentially beating this inflationary mindset out of consumers’ and businesses’ decision-making process.
It’s clearly transitory.
There are hundreds of men and women in both houses of Congress. Few are fiscally sane. Blame Powell all you want but Congress put us in a hole (more like the bottom of the Grand Canyon) because of lack of fiscal restraint. The more dollars you have the less they will be worth. I don’t see the end of inflation unless spending gets under control.
Ed – ‘Muricans have their own, LOCAL, representation in DC, State, County and City Houses (…and it’s NOT the Presidency, despite an apparent long-term mental trend among many of considering that office one of an elected monarch…). Giving serious attention to them and their actions, and wisely and consistently employing the precious asset of one’s vote as the periodic performance review of their efforts, is OUR massive, unpaid, unsexy, frequently-heartbreaking, success-not-ever-guaranteed PITA job, often up against our very own homegrown hard-working/well-funded national political parties, K Street or extralocal interests. This is the true, uniquely ‘American’, ALWAYS, ‘hard work’ (needed from, but too-often only observed in the breach over ALL ages of our citizenry…).
Again, in the words of the late, great Walt Kelley’s ‘Pogo’:
“…we have met the enemy, and he is US…”. The tools are still there, though always greasy, and clumsy to implement in our efforts to keep things bolted together, however loosely. Can/will we we relearn how to effectively use them?
may we all find a better day.
There are so many doomers here in the comments. Inflation is fine, and on a good track, considering the Covid economy we’re leaving behind. The last thing Americans need is to follow the 22% 4-year inflation up with a monetary-induced recession in the name of “squashing” inflation.
Real wages are rising and almost back to the pre-Covid trend. That’s what the average American should be concerned about.
Some seem to have not gotten the message the FFR isn’t the only tool the Fed has these days, either. Lowering the FFR, but still letting assets roll off the balance sheet is restrictive policy. The 10yr moving up 0.5bps is a good thing – the bond market is finally starting to get the message. This is what “higher for longer” looks like. The neutral rate was never going to be 5.4%; more like 4.5%-5%.
Sorry Dan, you minimizing people’s discomfort with 22% inflation in a few years is a problem. Don’t tell people how to feel. You do you.
Don’t you think it’s a little different when bad things just happen and when our “leaders” are actively making things worse for us so that they’re better for the top 1%?
Short of revolution, what would you suggest we do?
work hard and creatively, apply yourself, and stick to it.
Our hero here, Paul Volcker, was one of the big “leaders” back then, and he triggered the nasty double-dip recession in the early 1980s to get inflation under control. I got out of grad school in 1981, with unemployment at 8% heading to 10%, the worst unemployment crisis since the Great Depression, and interest rates were 15%-plus, businesses and banks were failing left and right, and no one was hiring, and there was no job for me in my field. So you go into survival mode, work hard and creatively to find solutions, apply yourself, and stick to it. Eventually, you’ll come out on top. But for me, it took many years. The unemployment rate stayed above 7% until 1987. It was a shitty economy to start out a career in. No one promised me or anyone else anything back then. People who complain about this economy today have no idea what a bad economy with many years of high unemployment looks like. And “leaders” are always bad because they never give you exactly what you want, LOL. And there wasn’t even any internet to vent our anguish.
Inflation is not fine, nor are we on a good track.
This is the reason that people hate politicians, because they tell us that we’re supposed to be thrilled with this economy.
The inflation pre-covid was not typical history wise. Just get used to 2-3%. Are you expecting to go back to times when china goods & oil overproduction surpassed inflation in USA? Not going to happen.
Get good skills, work hard, save a lot, invest wisely, wait for the dip in home prices. A solid plan.
What does invest wisely mean? To buy stocks at insane valuations (whole market is now >200% of GDP) and hope that there’s no crash?
Will there be a dip in home prices? You people seem intent on making sure it never happens.
Don’t want to give actual advice because no one can tell the future.
There some solid strategies.
– low cost ie MER
– cost averaging
– diversification
– proper duration for specific assets e.g. stocks safer than bonds if holding longer than 15y
– avoid memes and hot themes
– learn to accept risks and never sell in panic
As you see nothing new here, no magic.
Myself I tend to operate as described by Canadian financial advisor ED REMPEL. He has a forum.
And don’t get old.
Steve B,
There are some great mutual funds that pay out 8-14% apy dividends. Many funds pay out monthly and you can re-invest the shares to compound your income.
There’s also my namesake trade. I bought some TLT puts with Jan, April, & July 2025 expirations this week.
NB: not investment advice; for fun & entertainment only.
Also be flexible, adjust. Change career, relocate if needed.
Break out the champagne, folks–the prices that went up to insane levels over the last four years are continuing to go up from those insane levels at a slower pace!
” Inflation is fine, and on a good track”
Great time to buy bonds if you really think that.
Dan:
From our perspective, you pretty much nailed it.
1) Helene and Milton devastated FL. CA fires are still burning. Mudslides
destroyed four cities in Palos Verdes peninsula : two Palos Verdes and
two Rolling hills million houses are gone. Mother nature destroyed wealth accumulated for decades. The might not recover like ==> Jasa and S. Lebanon.
2) The average SS check is $1,800/m. Food cost about $400/person. 1BD
about $1,400/m. After food and rent nothing is left. In the major cities
the situation is worse. Landlords feast on gov transfer money. Homeowners paying $6K/$12K in RE taxes plus mortgages, insurance, repairs and maintenance – one thousand here five thousands there – for them nothing is left after SS.
3) The cost of eggs, chicks, junk meat and tomato sauce… is rising, along with the cost of interest rates. CA junk food restaurants min wage is $20/hr. They closed, laid off workers and cut hours. CA health aid min wage is $18/hr. Demand for low end health aid services is high. Boomers are infected by strokes, heart attacks, cancer, hip replacements and dementia. Somebody has to feed them, dress, undress, wash, help them with #1 and #2, after wrapping a belt around their waste. Eight hours/day are not long enough. Overtime and doubles after midnight and during holidays. A 6’5′ 300 pounds patient needs a strong man. Demand for them is high. Wives aren’t good enough. Only wealthy people can afford them.
There are four neighboring cities on the Palos Verdes Peninsula south of Los Angeles along the ocean. No cities were ‘destroyed’ at all in this area and there is very minor impact from land slippage which has been ongoing since the 1950s in the Portuguese Bend area of Rancho Palos Verdes which became a city in 1978.
Try to sell your 2M/5M house 10/20 yards from the cliff.
That’s the problem of the moronic owner who bought that house near a cliff, especially since the problem has been well-known and well-documented for at least the past 70 years.
SS is not a retirement plan. I am anticipating that I will inherit the manager position in my small department, but only once my boss is completely incapacitated.
Every job I have had, the higher-ups have complained/ warned that they have no assets and will basically work unto death (and I should find a better job).
I am not at max potential, but enjoy a max lifestyle in exchange (in a low-advancement economy for the job holder).
Business ownership is generally more lucrative and has a higher growth potential, but lacks the stability.
We can definitely blame social media for some FOMO/ envy/ jealousy. I see basically slaves making bricks in the Pakistani sun on my feed, so I think “I have a cushy life” and send my $200 to the orphanage there.
It’s a couple of adjoining neighborhoods on the Palos Verdes peninsula that have been wrecked by land movemeny, not an entire city (let alone four cities).
That land movement has been going on for almost seventy years, and is caused by these neighborhoods having been built on soil that sits atop a layer of bentonite, which is a slippery kind of clay.
The segment of Palos Verdes Drive South that skirts the area has been under constant road reconstruction since it was built, many decades ago, as different chunks of it slide toward the ocean at slightly different speeds. When I was a little kid, also many decades ago, my dad pointed out to me that it’s “never the same road twice.”
This is an honest look at the inflation breakdown. In general, the most essential items for high standard of living (healthy food & safe shelter) are increasing in price, and the rate of increasing is also increasing.
Regarding chickens/eggs, there are some nasty poultry viruses still wreaking havoc in that industry for both broilers and layers. The good news is broiler chickens are ready to slaughter after only 40 or so days from hatching…
You can thank the Cornish Cross for that level of feed efficiency!!!
It is the NVDA of the poultry world!!!
Chicken and NVDA to 150!!!!
A related excellent example of stupidity from a new Marketwatch headline:
“Groceries are more affordable now than in 2019. So why are prices still such a hot-button issue?”
In hopes of trying to turn around sentiment for the Vibesession and ignore the reality of cumulative inflation for four years, we need to adjust our thinking to accommodate for the premise that done people have seen wage gains, which help offset the price of a box of crackers that used to be about $3 a few years ago, which now sell for $4.25.
In case you didn’t understand the headline, the help shoe with another headline above a chart:
“Groceries are gettingmore affordable
When you factor in rising wages, groceries cost about as much today as they did in the pre-pandemic years”
My money mkt has chugged along slowly for the past two years, but I’m still thinking a box of crackers and virtually ever product in a grocery store is above my pay grade. I’m not feeling relieved by this spin.
The reason is because many people have not seen wage increases like that. Some have, but many have not.
It has been well documented for a long time that job-changers receive pay increases than job-stayers.
Thank you Wolf. Without you, we’d only see what the bankers want us to. Hedonic Quality Adjustment is not a singles resort in the Caribbean.
PPI services inflation is still hot yoy.
Rancho Palos Verdes became a city in Sept 1973. Trump feels CA pain
bc he owns a golf course in Rancho Palos Verdes, besides other properties
in CA.
Rancho Palos Verdes was formed from most of the land that the three cities of Palos Verdes Estates, Rolling Hills, and Rolling Hills Estates did not want and which was never incorporated on the Palos Verdes Peninsula and it is in the City of Rancho Palos Verdes where nearly all of the unstable land is on a small area of the coast that has been sliding since the 1950s. None of that matter is anything but a local matter and should not be covered to any degree by any federal funds.
The golf course is miles down the road from the area of land movement. It also sits at least partially atop bentonite, but it was built relatively recently (the 1980s), and it is purported that soil stabilization measures have been taken throughout the site (but not until after a piece of the golf course slid into the sea in the late 1990s following heavy rains).
For what it’s worth, that golf course was not built by any of Trump’s companies. It was built by a local developer and Trump’s name came to be slapped on it a little over a decade later.
I worked or went to school for 43 years, and retired at 59. I blame everything on LBJ and Nixon. Nixon took us off the gold standard and went to China. The economy has sucked for the average Joe since 1971. Inflation is a tax and it’s too high. I got screwed during the Savings and Loan crisis. Lost money on the first home that I bought. So why am I so happy now? Because I don’t work a lick!
As Wolf has shown previously, corporate profits are thru the roof, due to simple perverse inflation: companies making more profit just by raising prices. Why do you think that Lowe’s and Home Depot and other retailers are installing electronic price tags? So they can raise prices faster and easier, maybe even from one central location they’ll be able to raise prices in every single store with the click of a mouse. Wow.
So who got the best deal from Bidenomics? Obviously CEOs who are making bank. They’re even making enough profit to buy back their own stock. Pretty soon they won’t even need investors, they’ll own themselves.
Jerome Powell is no Paul Volcker. If Jerome Powell did what Paul Volcker did, the entire world would enter a huge depression.
There are people today who still make big money, but there are also many who are being priced out. But today most companies don’t care because they’re making so much profit on the remaining customers, they don’t yet miss the customers they’ve left behind. But this strategy can only last so long, because as time goes by, there are fewer and fewer remaining customers until there aren’t enough to buy all the overpriced stuff that companies need to sell to keep showing higher profits.
“Why do you think that Lowe’s and Home Depot and other retailers are installing electronic price tags? So they can raise prices faster and easier”
Have you ever had to re-price an entire department at a big box store? I have. Its T E D I O U S.
Prices often change week to week due to things going on and off rebate – nothing to do with inflation.
This is another example where investment in technology replaces human workers in doing the most tedious tasks.
It also allows the retailer to increase the price on specific items that it is running low on. And it can do standard variable pricing, like airlines, where prices move constantly.
Chas.J – inventory-data-linked/POS barcode price tags (now considered ‘old’ tech) were in widespread general use by the early 1990’s (…recall President GHW Bush’s surprise upon encountering them at a campaign stop at a grocery store…).
may we all find a better day./
FYI, this was entertaining at Mauldin Economics blog:
…. “and reduce housing costs. If that was the theory, it’s not happening yet. Long-term Treasury and mortgage rates are actually up since the Fed began cutting.
Consider this chart from the invaluable Wolf Richter.”
I knew you were invincible but now also invaluable — and incredibly more useful than ai will ever be.
Housing inflation is the main problem. Milk and eggs and Bread costs are roughly the same in the Upper West side as they are in Garden City KS.
However, rent is not the same in Cherry Creek CO as it is in Albany GA. Saint Louis MO is not experiencing housing prices the way Boise ID is. The factors driving this are way beyond what the “fed” can control. When people say inflation is a problem, they mean the broken, and unfair United States housing market which has made many people losers who didn’t deserve such. Don’t know anyone worried about butter, though it has gone up along with bread. 50% increase rental prices (along with a monopoly pricing scam) is what people notice. Of course the Govt has bigger fish to fry than us, as it tries to keep itself alive for 4 more years this time.
So… Are we not talking about how climate change is driving inflation? Home insurance rates are climbing quickly because of all the fires out west and the hurricanes out east. Until no one is willing to insure these homes these rates are going sky high. I see a lot of items that aren’t going to come down regardless of what the Fed does