Sellers coming out of the closet with their vacant homes. Active listings exploded the most in San Diego (+77%).
By Wolf Richter for WOLF STREET.
New listings jumped in September, when they normally fall in September and for the rest of the year. This was the first time in the data going back to 2016 that new listings didn’t fall in September, according to data released today by Realtor.com (red line = 2024; green line with black dots = 2019):
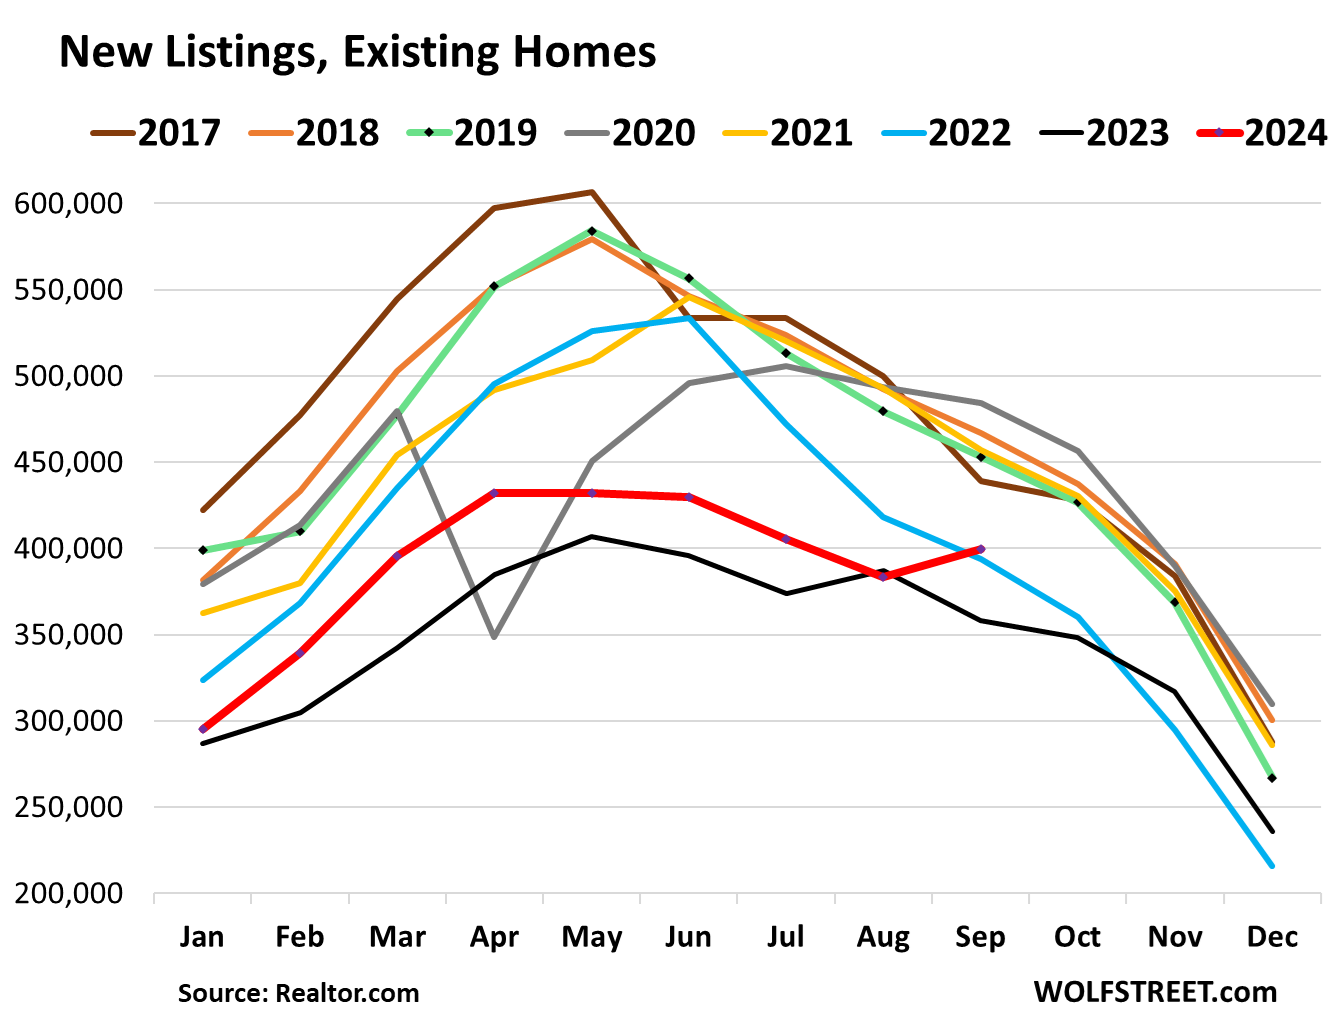
The Seattle metropolitan statistical area (MSA) had the biggest year-over-year surge in new listings (+42%), followed by the southern part of Silicon Valley (San Jose-Sunnyvale-Santa Clara). Of the biggest 50 MSAs, new listings rose by double-digit percentages in 26 of them. This is occurring even as demand for these homes has wilted:
| Metro September 2024 | New Listings % YoY |
| Seattle-Tacoma-Bellevue | 42% |
| San Jose-Sunnyvale-Santa Clara | 27% |
| Washington-Arlington-Alexandria | 26% |
| Denver-Aurora-Lakewood | 26% |
| Boston-Cambridge-Newton | 24% |
| Raleigh-Cary | 24% |
| Los Angeles-Long Beach-Anaheim | 23% |
| San Diego-Chula Vista-Carlsbad | 22% |
| Providence-Warwick | 22% |
| Richmond | 20% |
| San Francisco-Oakland-Berkeley | 20% |
| Las Vegas-Henderson-Paradise | 16% |
| Oklahoma City | 16% |
| Portland-Vancouver-Hillsboro | 15% |
| New York-Newark-Jersey City | 15% |
| Riverside-San Bernardino-Ontario | 15% |
| Baltimore-Columbia-Towson | 14% |
| Nashville-Davidson-Murfreesboro-Franklin | 14% |
| Phoenix-Mesa-Chandler | 12% |
| Detroit-Warren-Dearborn, Mich. | 12% |
| Atlanta-Sandy Springs-Alpharetta | 12% |
| Miami-Fort Lauderdale-Pompano Beach | 10% |
| Charlotte-Concord-Gastonia | 10% |
| Hartford-East Hartford-Middletown, Conn. | 10% |
| Kansas City, Mo.-Kan. | 10% |
| Minneapolis-St. Paul-Bloomington | 10% |
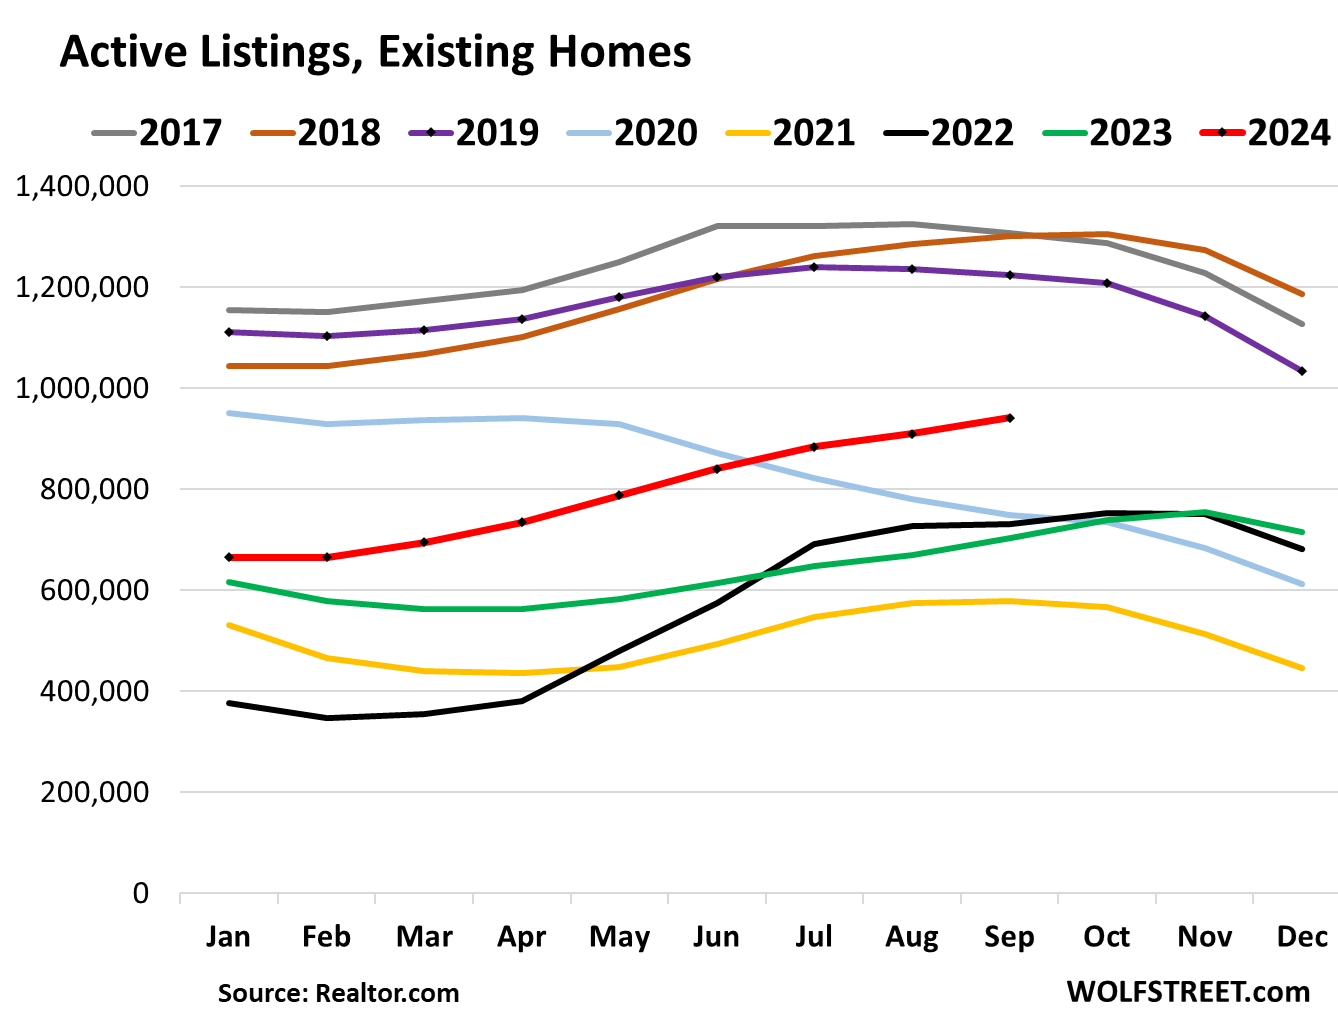
Active listings (total inventory minus listings with a pending sale) surged 34% year-over-year, to 940,980 listings, the highest since April 2020, and the highest for any September since 2019, as sales have wilted and as inventory gets stale because prices are way too high (data via Realtor.com).
Of the biggest 50 metros, active listings exploded in the San Diego MSA (+77% year-over-year), followed by Tampa (+74%), Orlando (+69%), Seattle (+68%), and Miami (+68%).
The red line = 2024, purple line with black dots = 2019. The four lines below the 2024 line are the years 2020, 2021, 2022, and 2023 (data via Realtor.com).
The combination of wilting demand and surging active listings means that sellers put vacant homes on the market after having already moved out perhaps years ago, but kept the vacant home off the market to ride up the price spike all the way. We can see that because a seller that puts their home on the market that they still live in will buy another home to move into, and so demand rises by 1 home and active listings rise by 1 home, and both rise.
Now demand is falling and active listings are rising. So these are the vacant homes coming on the market that sellers had already moved out of and have kept off the market for years – which was responsible for the inventory shortages in 2020-2022, and we discussed that a lot at the time.
The San Diego MSA is #1. These are the 30 metros of the 50 biggest metros where active listings have surged the most:
| Metro September 2024 | Active Listings % YoY |
| San Diego-Chula Vista-Carlsbad | 77% |
| Tampa-St. Petersburg-Clearwater | 74% |
| Orlando-Kissimmee-Sanford | 69% |
| Seattle-Tacoma-Bellevue | 68% |
| Miami-Fort Lauderdale-Pompano Beach | 68% |
| Jacksonville | 62% |
| Denver-Aurora-Lakewood | 62% |
| Charlotte-Concord-Gastonia | 61% |
| Atlanta-Sandy Springs-Alpharetta | 53% |
| Dallas-Fort Worth-Arlington | 49% |
| Sacramento-Roseville-Folsom | 49% |
| Phoenix-Mesa-Chandler | 49% |
| Raleigh-Cary | 48% |
| Las Vegas-Henderson-Paradise | 47% |
| Los Angeles-Long Beach-Anaheim | 47% |
| Riverside-San Bernardino-Ontario | 40% |
| San Jose-Sunnyvale-Santa Clara | 39% |
| Columbus | 39% |
| Oklahoma City | 38% |
| Memphis | 37% |
| Cincinnati | 35% |
| Providence-Warwick | 33% |
| Louisville/Jefferson County | 31% |
| Nashville-Davidson-Murfreesboro-Franklin | 31% |
| Houston-The Woodlands-Sugar Land | 30% |
| Boston-Cambridge-Newton | 30% |
| Birmingham-Hoover | 30% |
| Portland-Vancouver-Hillsboro | 28% |
| Richmond | 28% |
| San Francisco-Oakland-Berkeley | 28% |
But buyers are still on strike because prices are too high.
Demand for existing homes has wilted as buyers have gone on strike because prices are too high, and what’s on the market is taking much longer to sell.
Many buyers have switched to buying new houses because homebuilders understand this market and have offered homes at lower prices and have thrown incentives into deals, and have spent massively to buy down mortgage rates, and so new house sales have remained strong, amid surging supply of spec homes.
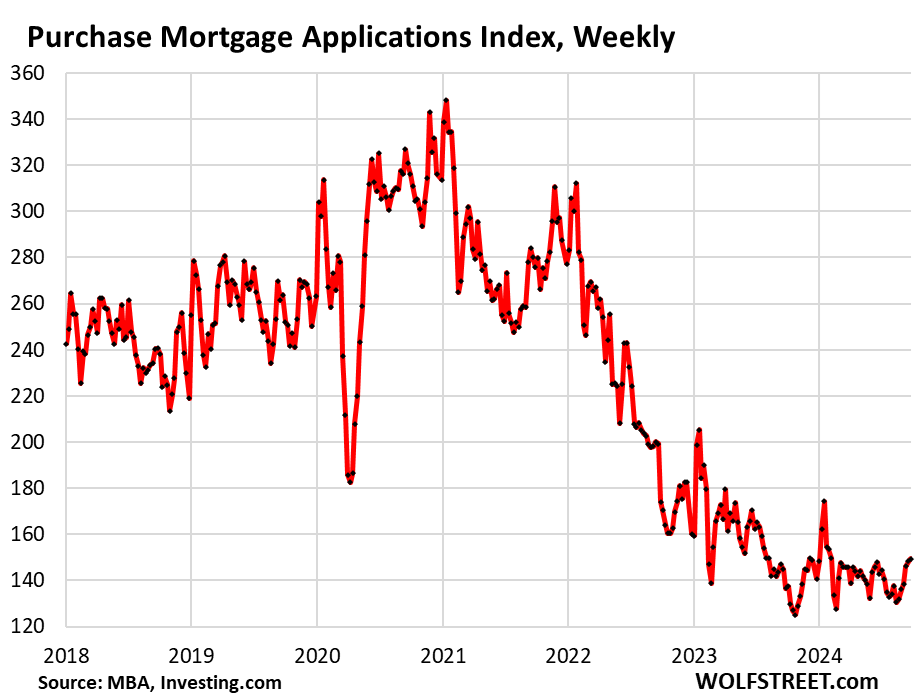
The most current measure of demand – the weekly applications for mortgages to purchase a home, released by the Mortgage Bankers Association – shows that demand for homes remains wilted. Purchase mortgage applications have been running along historic lows for a year and remained there over the weeks since the Fed’s rate cut:
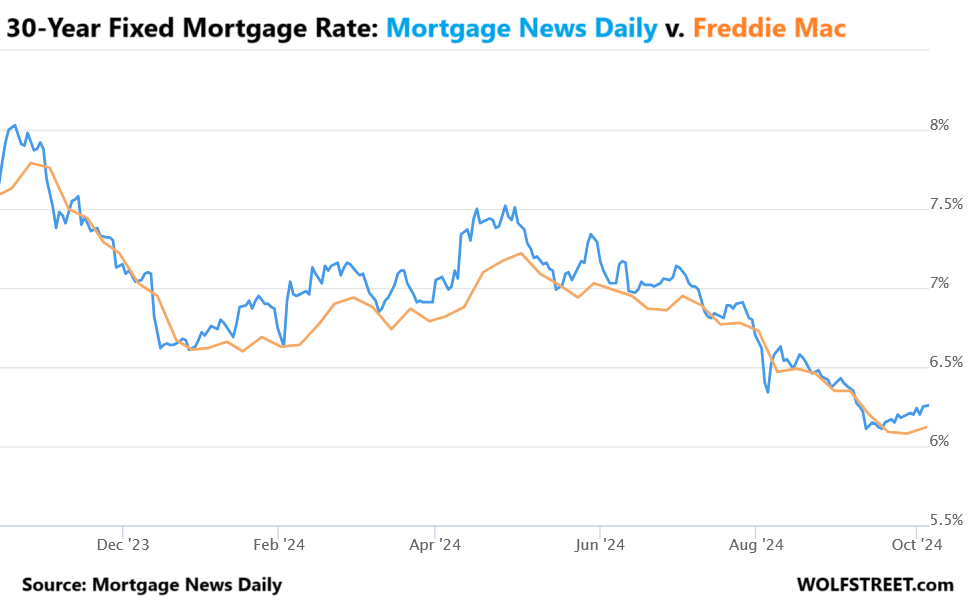
Mortgage rates have risen since the rate cut. After briefly touching 7.8% in October 2023, mortgage rates zigzagged lower to briefly touch 6.09% last month, according the weekly Freddie Mac data, as a bunch of rate cuts were being priced in.
But when the Fed finally did cut its policy rates by 50 basis points on September 18, mortgage rates – following longer-term Treasury yields – started inching higher, confounding hopes that the actual rate cuts would reduce mortgage rates even more than the bunch of priced-in rate cuts already had. So the Fed cut its policy rates, and mortgage rates rose.
The daily measure by Mortgage News Daily has already risen to 6.26% as of today, from the low of 6.11% before the rate cut:
The median listing price in September dropped for the third month in a row from the seasonal peak in June, which had been lower than the all-time peak in June 2022, and flat with June 2023. Year-over-year, the median listing price was down 1.1% (data via Realtor.com):
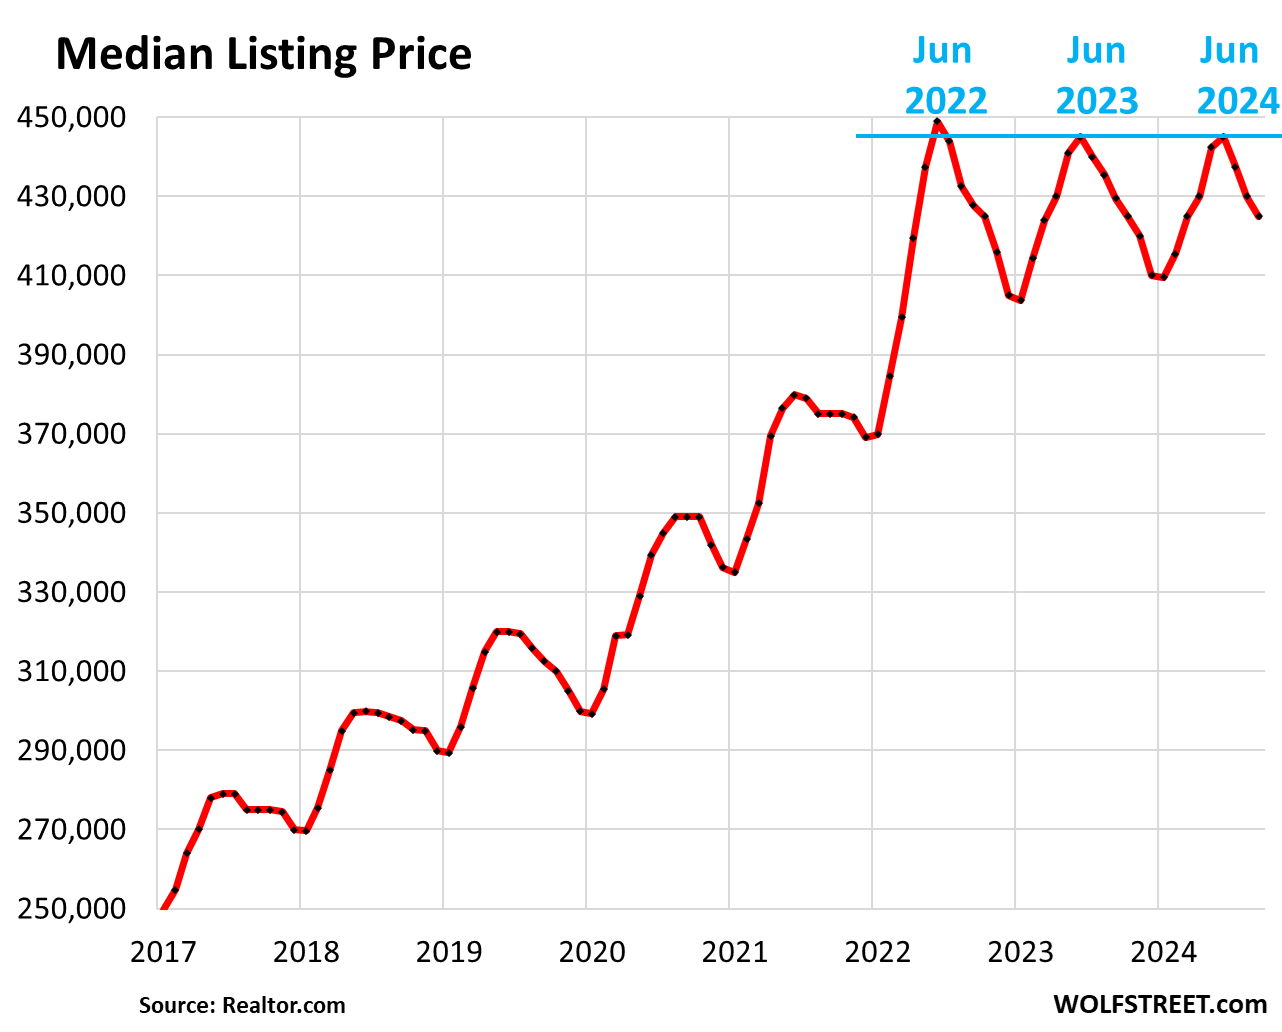
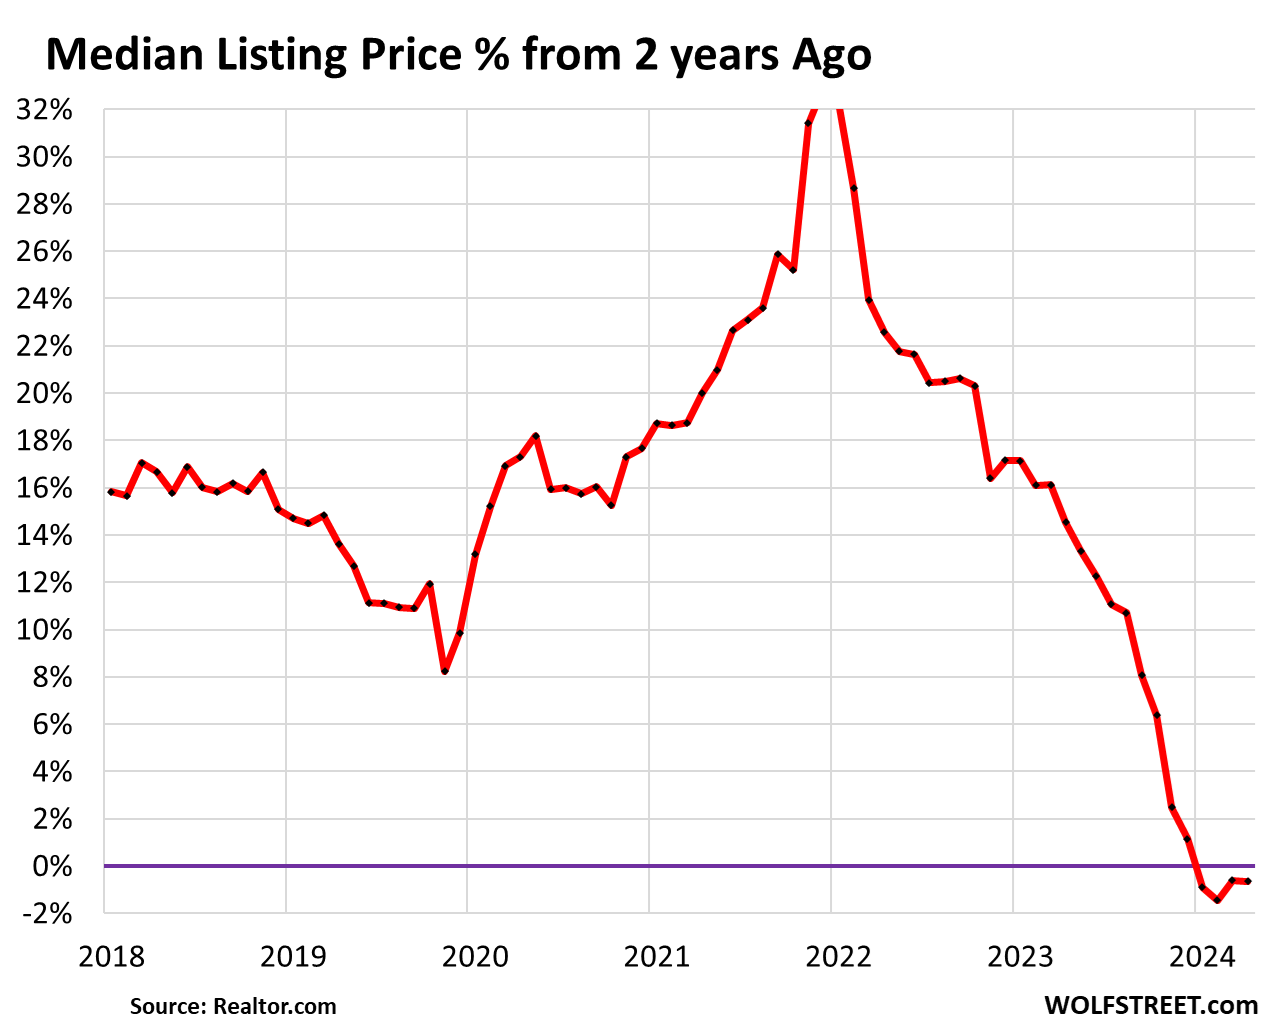
For the past four months, the median listing price has been below where it had been in the same period 2 years earlier. This percentage change from 2 years ago shows how insane sellers’ pricing expectations had gotten in 2021 and 2022.
That price spike was why many homeowners who’d bought a another home to move into didn’t sell the old home they’d moved out of because they wanted to ride up the price spike all the way, and now those vacant homes are starting to come on the market.
So supply is piling up. And sellers are becoming a little more motivated. Median listing prices show where sellers stand. To make a deal, they need buyers, and actual buyers determine the selling price, and the prices of closed sales, which we’ll get later this month, show where actual buyers stood.
Here are the 23 metros of the biggest 50 metros with the largest year-over-year drops in median listing prices, according to Realtor.com:
| Metro September 2024 | Median Listing Price | % Change YoY |
| Miami-Fort Lauderdale-Pompano Beach | $525,000 | -12% |
| Cincinnati | $337,000 | -10% |
| San Francisco-Oakland-Berkeley | $997,500 | -9% |
| Kansas City, Mo.-Kan. | $389,500 | -8% |
| Austin-Round Rock-Georgetown | $520,000 | -7% |
| Jacksonville | $399,000 | -6% |
| Denver-Aurora-Lakewood | $610,250 | -6% |
| Orlando-Kissimmee-Sanford | $429,950 | -6% |
| Tampa-St. Petersburg-Clearwater | $414,948 | -6% |
| Nashville-Davidson-Murfreesboro-Franklin | $547,865 | -5% |
| San Diego-Chula Vista-Carlsbad | $997,000 | -5% |
| Oklahoma City | $314,950 | -5% |
| Seattle-Tacoma-Bellevue | $772,425 | -3% |
| Portland-Vancouver-Hillsboro | $604,890 | -3% |
| New Orleans-Metairie | $325,000 | -3% |
| Minneapolis-St. Paul-Bloomington | $432,500 | -3% |
| San Antonio-New Braunfels | $339,948 | -3% |
| Atlanta-Sandy Springs-Alpharetta | $414,560 | -3% |
| Washington-Arlington-Alexandria | $599,948 | -2% |
| Dallas-Fort Worth-Arlington | $439,450 | -2% |
| Phoenix-Mesa-Chandler | $519,850 | -2% |
| Sacramento-Roseville-Folsom | $635,000 | -2% |
| Los Angeles-Long Beach-Anaheim | $1,154,440 | -2% |
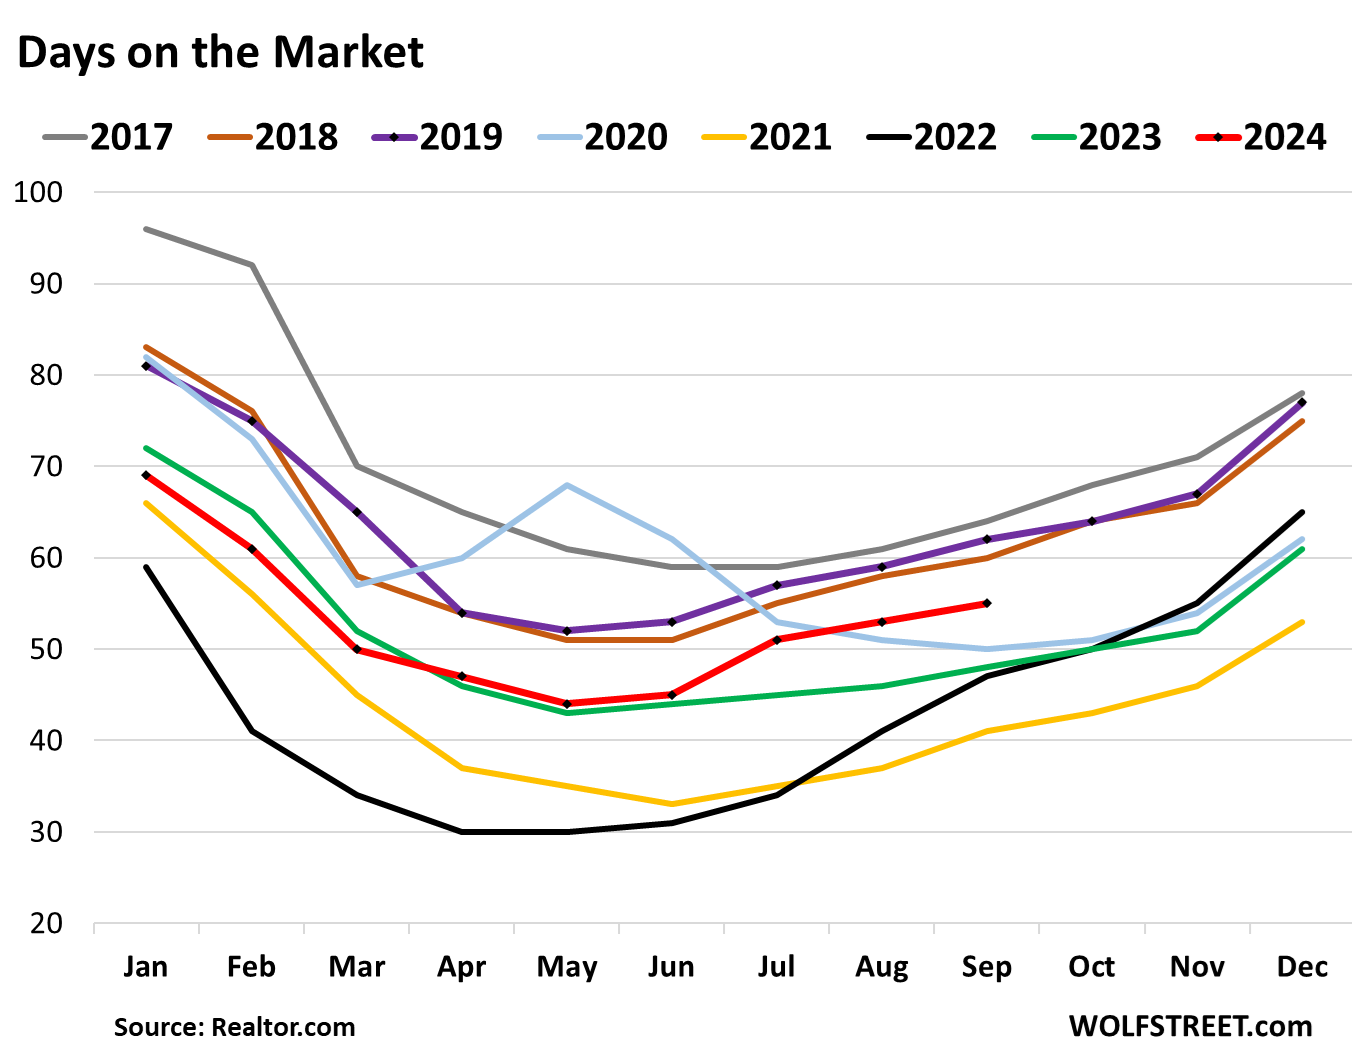
Median Days on the Market: The median number of days a property sat on the market for sale before it sold or before it was pulled off the market rose to 55 days in September, the highest for any September since 2019 (red line = 2024, purple line with black dots = 2019).
This number shows a mix of:
- How aggressively sellers pulled listings off the market if it didn’t sell;
- And how fast properties sold that did sell.
The number is kept down by sellers pulling their home off the market when it doesn’t sell, to then relist it later at a lower price, or as rental or vacation rental, or not list it at all for a while.
When sellers get more desperate to sell the property, they leave it on the market and reduce prices until it sells, and the days on the market lengthens.
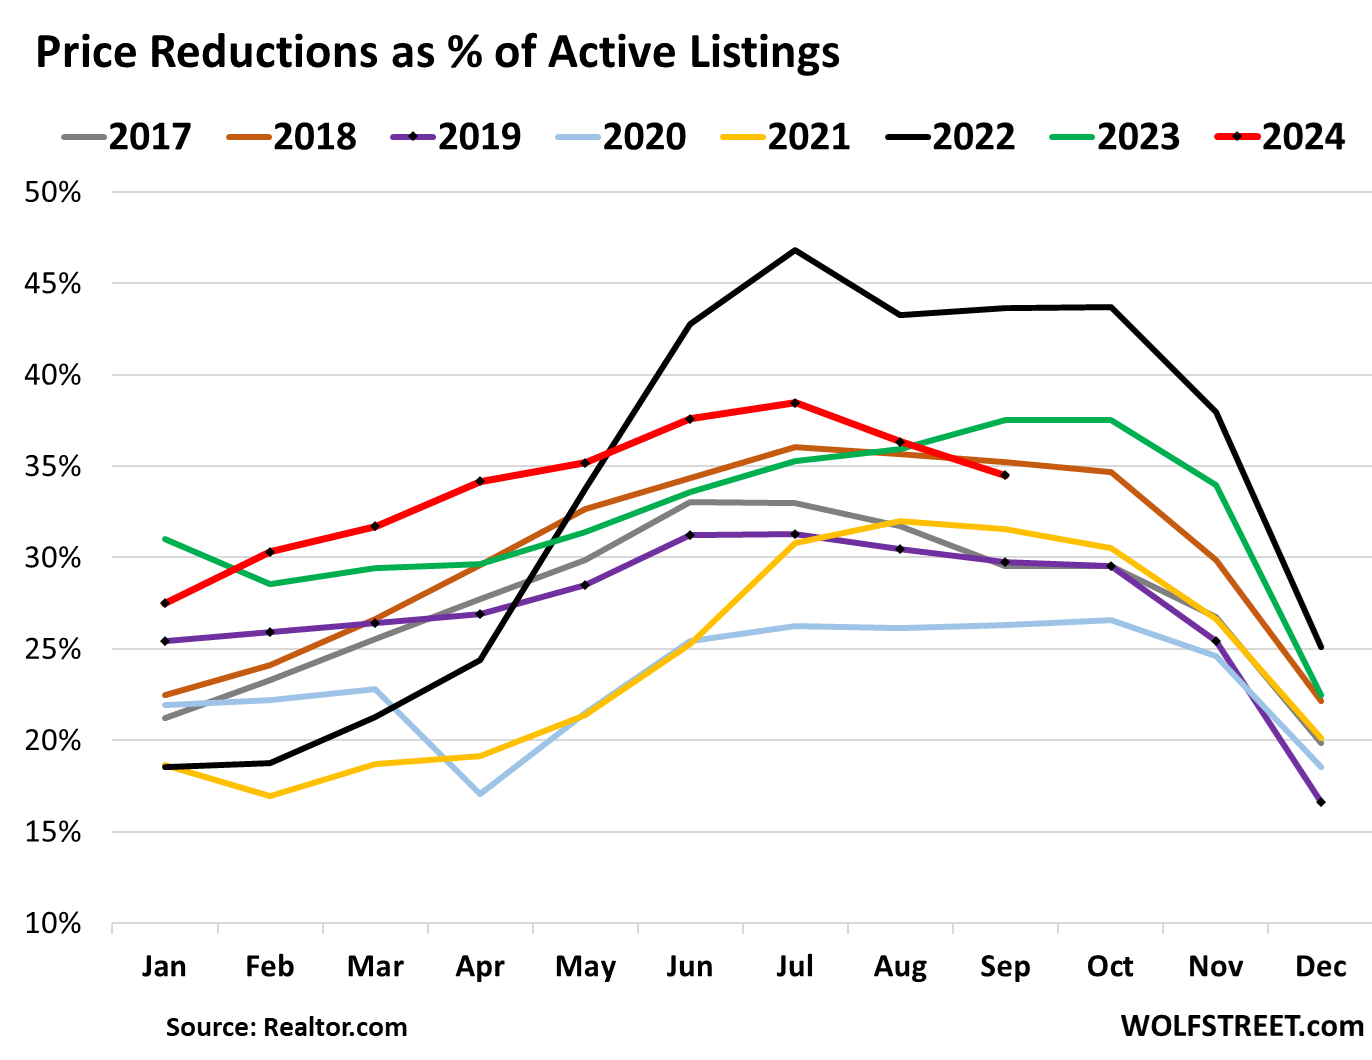
Price reductions: The share of active listings with price reductions in September, at 34.5%, was the highest share in the data going back to 2016 except for 2018, 2021, and 2022. The years with the highest asking prices after a huge spike – 2022 and 2023 – were also the years with the biggest share of price reductions (black and green lines).
All other years were lower, including 2019 (purple line with black dots). But those price reductions clearly aren’t enough to bring buyers into the market (data via Realtor.com):
Enjoy reading WOLF STREET and want to support it? You can donate. I appreciate it immensely. Click on the mug to find out how:

![]()
Only if I can post gif in this comment section, I would gladly insert a picture of Mr. Burns from The Simpson doing his “Excellent” gesture to all these supplies coming to the market….although it will still take a while for MSM narrative to stop screaming about we don’t have any supply…hopefully give it another couple of months…
That SD 77% and LA/LB 43% sure look encouraging, just have to see how long it takes before the majority of the sellers come back from lunch with their pricing. One quick look in Redfin and Zillow, you still see it’s dominated by make a wish asking price…
PI— glad to hear you feel hopeful and like Mr. Burns… haha but how much longer are you willing to wait? I’ve read your comments for a long time and related to you having a young family (we are from San Diego.) We finally got out of hotel California this summer for much greener pastures. We bought our dream home in a smaller city with excellent schools, low crime, good food, etc. for, get this—$525k (2700 sq feet brick colonial). No more slum lord. Yes, it’s hard leaving family and friends—it’s a bold move. Careers are also a factor of course. I’m sure things will change eventually because they always do—but is it worth it to keep waiting? California is crazy. And let me say, people out here are so much more pleasant because they are happier. Wishing you all the luck, fingers crossed for the correction California needs.
Hi LD,
Please tell where did you move, I won’t tell anyone :-).
I am stuck in SD for next few years :-(.
Hahaha As long as you keep it to yourself! It’s this country’s best kept secret…
Its a small city in PA that starts with a P and ends with an h. It’s spectacular. My husband and I feel so free here coming from California. It’s green, leaves are changing. Food is excellent! Spent $80 in San Diego for a family of four at a taco shop, we spend the same amount in a nice sit down restaurant here. There are orchestra and wrestling opportunities for our elementary school aged boys. Best of luck to you! Get out of that state!
Jon, I am stuck in SD for next few years :-(.
Why so down, South Dakota’s not such a bad place :)
I agree with LD.
@LD I think you made a smart decision. I’ve lived in CA my entire life but if I was younger and not making crazy money I would leave the state and not look back. With the money you save not living in CA full time, with cheaper rent or mortgage, cheaper gas, cheaper electricity, cheaper food etc. etc. you should have penty of money to fly out and visit family and friends a couple times a year (or they may start moving after flying out to visit you). P.S. I just Zillowed the modest (2,300sf 3×2) home I bought on SF Peninsula for just over $400K in 1994 and sold for just over $1.2mm in 2005 and the current Zestimate is $2.7mm (you can get a LOT more home for a LOT less in another state)…
Nuts! Maybe eventually retire to elsewhere? Never know where life takes you!
I’m in no hurry
everything is debt free – except my home(but 3.35% loan is great)
waiting for multi-family to start ticking down
still way to high
considering debt on bigger units – but want to stay with 30% ltv or less
I’m a former bay area resident, moved out in 2001 to Colorado, in my income bracket I have saved hundreds of thousands in state income taxes (counting the invested difference) and will be able to retire at least 5 years earlier. Of course CO is no longer a low cost state, but the ROI on moving away early in a high earning career is just enormous.
But you certainly won’t have that weather or the ocean. If you are a mountain person it works very well.
People pay a very high “weather tax” in CA, especially in SoCal.
@LD, for now the wait is fine, I give it another 2 or 3 years and see where it will go. If price is even nuttier without major correction in 3 years, then definitely will exit SoCal. By then who knows, job situation might change beyond my control. For now, the incentive to stay is employment opportunity.
Exactly, LD. All the chicken littles are funny. Apparently they purposely didn’t look at the median price chart going back to 2017 – not that long ago.
They’d have almost doubled their money and would be sitting on enough equity to move and pay cash for a new place if they had pulled the trigger and bought instead of waiting for the second great crash that never came.
Real estate, like most good investments, is a long term game. It’s also a game, like ALL others, which you can’t win if you just sit on the sidelines.
If you look at the SAME house sold in 2021-22 and 2024 you can see that COVID buyers lost money when adjusted for inflation and housing was the worst performing asset class of the 2020s. The NAR data used to prop up the “rising prices” fomo stuff is based on median sales price as the lower end of the market dropped out and not adjusted for inflation. Housing performed well after the bubble implosions of 1988, 2008 and may do well again from 2026-2030 but over the past four years it has not. The speculative buyers and Airbnb bros will likely start dumping their inventory soon.
If you bought over this summer in PGH, you bought at the top. Enjoy the ride down!
Doesn’t matter to us, it’s our forever HOME that we can so easily afford. Our mortgage is less than the rent we were paying for a shitty, deteriorating small house in San Diego.
Oh and the jerk store called—thanks for the well wishes!!
Thanks LD
I wish you the best.
I am an immigrant to this country and seeing dying American dream is pretty sad to me.
America is a great country but it’s sad to see this country turning like the country I came from .
I lived in few countries and thus have a perspectives on things.
Jon- I feel the same way. Things feel awfully rigged. Let’s hope the pendulum swings in a better direction…. A common sense direction. I wish you all the best too.
I have no desire to live in CA, but one thing that could be said for living in a high cost of living area during your working years is that you probably make more money than if you work out in the sticks. That means more money to save, invest, etc. Being wealthy on a global scale makes a difference in retirement versus being small town wealthy.
Not that money is everything. Just throwing this out there. I also wouldn’t want to be hating my entire life just waiting to get to retirement.
Funny… Twenty years ago, during the first rendition of this craziness, my wife and I checked out of Hotel California (the SF wing.) We discovered how much more wonderful life could be, how infinitely more family-friendly the world was, arriving in up-and-coming Denver, several years before it “peaked.”
But it did peak and the young progressives complaining how unaffordable everything is working part time at minimum wage (now $18.60/hr) have populated city government and driven it down–abandoned downtown, high homelessness addressed only through compassion and more money, high crime addressed only through compassion, worsening traffic not through increased economic activity but by reduced road capacity in the name of alternative transportation means (unused scooter/e-bike lanes) have me again looking for greener, liberal (i.e., tolerant, accepting, diverse, free speech) but not progressive (i.e., socialist, censored speech, virtue-signaling above all else) pastures.
From these listing/price trends, I may campaign hard for us to sell now, buy later elsewhere, but there’s big risk in the possible trend reversal.
CH, I couldn’t agree more on all points. From experience, I would say make sure you have a new home first. Pre-Covid we sold in San Diego to travel for a job. HOA wouldn’t allow us to rent our townhouse out. We went back a year later and ended up priced out of the market and rented for five years feeling trapped before making our final escape this summer. Best of luck to you and the wife!
Or buy gold leverage your money on an appreciating asset ,wait patiently 2 years . Buy depreciating asset (house) with profits from gold . Good Luck just my opinion no financial advice
I’m going to get an ounce of gold a month and live in the little plastic sleeve it comes in.
Better than BTC. I could hardly fit in the thumb drive I have.
“and for the resto of the year.”
North Beach is rubbing off on you.
Lemme see: New construction with incentives, rate buy downs and possible warranties etc. VS
Your now 2-4 year vacant “used” house at a higher price?
In a property management driven area I see the wear a house gets when vacant. People have an ideal that it’s just waiting for them to walk back in the door and turn up the thermostat!
The reality is time is destructive and certain systems breakdown more rapidly when idle than with regular use.
Also I see a 2% sag in some majorly inflated areas (LA) and the fallacy of the falling mortgage rate blowing up as people had already bought that rumor and are selling the news (hint: the news is higher for longer).
Higher rates, inflation and prices. “The top isn’t in… until AFTER I sell!”
Film and television industry continues to nosedive as well.
The strike seemed to hardly have an effect o ln the economy at large. Sure those tied to the industry suffered quite a bit. But that industry has been in retrenchment in LA for decades now. As if should the advantages it offered really no longer are needed with modern equipment and lighting.
Except these houses haven’t been vacant. The owners have rented them out and used them as income property’s. The local governments in a lot of these cities are cracking down on short term rentals and some are putting limits on the number of STR’s that they will allow. The enforcement of these restrictions is pushing a lot of people who kept a home or bought multiple properties to use for income, to sell their assets. No one in this real estate market is going to believe that there are this many vacant properties sitting collecting dust when they can be earning 60-100k /year . Yeah there are a few, but most of these homes are illegally run VRBO’s
I live in San Diego and the prices are just not realistic.
It’s a nice enough place to live but buyers wanting $1.5m for a house in the suburbs in the middle of SW dirt is just a fantasy. People lost their minds during covid era rates. The homes were $700-800K in 2020 and the buyers who didn’t buy didn’t forget that home prices almost doubled in two short years.
I am in SD as well and I agree with you 100% despite being a home owner. Home prices in SD needs to fall a lot.
My neighborhood, average home price is above 1.5 million and because of high home prices, young families can’t move in and thus demography is looking pretty old in my hood.
Prices have increased 100% from 2020 price.
In SD and CA in general property taxes are a huge incentive to stay in place if one is a long term homeowner, hence “thus demography is looking old in my hood.” It makes no sense to sell if one wants to stay in CA, their property taxes would increase many multiples. Long term owner who don’t make a high income cannot sell their home and stay in CA even with 100% equity – they could not afford the property taxes on a like-kind home with property taxes re-adjusted to current rates.
True too in FL Frank,
While WE, in this case the family WE absolutely ”needed” to be here to help take care of elderly parents,,,
WE do not need to be here any longer,,
BUT, and it is truly a huge but,,,
IF we were to sell and go back to the rural/country setting, in FL or apparently at this point any other state,,, we would be giving up the very clear property tax benefits of our current situation…
KEEP THE PROPERTY TAXES IN MIND folx,,,
Very true.
This is true if prices stay high.
If prices cone down then property tax becomes affordable.
The inventory in San Diego increased 77 percent without recession and or unemployment
I wonder what would happen when the recession and or unemployment hits hard.
One of the largest employer in San Diego has its 5th round of lay offs in San Diego last month.
The positions eliminated paid 200k plus per year.
@Frank, Prop 19 a few years back prevented most parent to child transfers of the low Prop 13 tax basis but now allows seniors to take the low property tax with them to a smaller home anywhere in the state (anyone that wants to learn more can Google Prop 19 CA property tax).
Proposition 60, 90, and 19 allow a lot of Californians move to a new home in California while keeping their old property taxes, as long as they are over 55 yo.
” property taxes are a huge incentive to stay in place if one is a long term homeowner”
In addition, there are capital gains taxes to consider if you decide to sell and relocate.
Just out of curiosity—Del Cerro?
I am in SR area ..
If you live in Calipatria where the cold water runs hot out the cold faucet, yeah, house prices should come down. If you live 10 miles or less inland anywhere between LA and Tijuana? Hell no! The entire world would love to live in the only mediterranean climate available in the United States.
Homeowneship is technically a scam anyway folks. You pay 2x the listed price of a home over 30 years and think that once you have this paid off home your retirement is safe. But, let’s not forget that you paid for two homes if it took you 30 years to pay off, plus all of the maintenance and headaches accumukated over 30 years.
If people want to afford the new american dream, they have to get out of their comfort zone and create tremendous service and value to peoples problems. If youre an employee talking about the dying american dream, of course the dream is dead. There never was a dream as a member of the rat race.
Scale and leverage your efforts and talemts and you wont have to worry about affordability.
Not only did I buy the cheapest house in a wealthy area five years ago, but I also pumped over 300k into projects such an accessory dwelling unit. Home values should increase over time if YOU PICKED the right market.
***Take it for what it’s worth*** and ***consider the source***, but yesterday Redfin was claiming a recent, seasonally unusual jump in demand, suggesting that buyers are beginning to respond to lower rates.
Of course, one person’s jump is another person’s squiggle. And it’s just one data point from one source.
Redfin is a brokerage, and they make their money off commissions, and they want a jump in demand (even if it’s just a weekly squiggle), and they want to get people to buy because that’s how they get paid.
I read the Redfin market update every month and it never matches up with Wolf’s data.
Where I live recent sales seem to go to places with price cuts, or where the seller has accepted lower than asking.
I would plot the 30 year mortgage rate vs purchase mortgage applications to highlight how rates aren’t the problem. I’d also plot the metro areas listings increase with their median listing price on the x axis. I’ve used plotly in the past to make really data rich charts that help with analysis
More supply means more homes to look at! The misses will shop all these homes until she finds that Dream Kitchen! Then BINGO…..write the check!
(the above is a personal experience by a *former* wife) LOL!
I think what we ultimately will see unfold, is a collision between resilient sellers and buyers. A battle of most sellers being stubborn, wanting maximum profits and sellers that are unmotivated to toss money down the drain.
The buyers can wait in nice new apartments buying time — while sellers watch inventory climb higher. A game of chicken that will break the weaker players while the really stubborn players wait for baby boom retirees that have excess cash to burn.
I’ve never totally bought the supply shortage narrative — I think this was always demand driven, with pandemic panic buying, pandemic pricing and tulip bubble chasing, highly influenced by baby boomer dynamics.
There was a narrative that the pandemic accelerated technology growth and adoption — probably true — but the pandemic greatly accelerated baby boom spending and life restructuring, which amplified a housing bubble. No surprise, but that trend may not be over, which will add a new twist to any housing correction. I think there will be plenty of these babes nibbling around the edges, while everyone else is priced out. Somewhere in that mix, new homes will be extremely competitive as an alternative….
That will be a weird equilibrium — where there’s no crash, but steady ongoing declines in median values.
@Redundant like you “I’ve never totally bought the supply shortage narrative” since most people pushing for more homes or apartments are the people actually making money building new homes or apartments. There was an actual toilet paper and Ford F150 “shortage” in 2020 since you could go to ten stores and ten dealers and not find a single roll of TP or single F150 for sale, but with rare exceptions there are quite a few homes for sale and apartments for rent in every big city in the state. We would all be better off if jobs and people moved to places that had more “affordable” housing rather than CA increasing our already high taxes even more to build $500K to $1mm subsidized apartments that are rented at “affordable” prices (usually to the politically connected).
I think like with any bubble if we start to see noticeable price declines there will be a race to the door by sellers, which will then lead to bigger price declines. Everyone knows it’s a bubble they were just hoping to hold out for a higher top….
Buyers on the other hand are limited by what they earn and get approved for. Also when you can rent for cheaper why buy? I rent a 2bd for $1400 all utilities included in a part of town where houses are all over $1M. I have beautiful views and trails right outside my house. I could move 20 min further from where I want to be and buy a house that needs updating for $550-600k and have a mortgage in the low $3k’plus plus $400 month for utilities. I could also get a luxury apt on this side of town for $2200ish. Mortgage to stay in the same area would be $6k-ish. Everything is overpriced. Prices need to come down.
I guess this is why there are so many rentals being built. I read Toll Brothers annual presentation, and they said their target customers are are households that earn $200k and up. They said that demographic is 16 million households. So they are not worried about future builds.
Unless there is something very special about the exact location. A used home should sell for a third less or more than a new home.
It will cost that and more to bring it up to speed. And you will still have an old home.
The real estate cons will tell you all kinds of crap about existing hoods and how much better they are. It is all lies as every neighborhood changes.
Not all markets have new listings to push down on existing home prices.
No, old houses are much better, especially if we are talking pre-1930s. Masonry, tall ceilings, custom antiquery, plaster walls, etc.
And in what other time period since then have stately single family homes with large yards been built close to city centers?
Once you fix up that old home tastefully, it’s better than anything made out of sticks and plywood. You can’t feel the wind inside or hear the rain. The good ones weren’t built with “builder grade” anything.
I could go on, but I (obviously) love old homes.
These numbers don’t even begin to tell the story. Pocket listings are rising fast. These don’t show up in public data. With the changes to real estate commissions more and more agents are not putting new listings into MLS. Because they cannot advertise that the seller will pay the buyers agent commission. So they keep the listing private, and market that property themselves to potential buyers and more importantly, buyers agents. I have a friend who currently has more than 20 pocket listings, which is more listings than she has on MLS.
That should be illegal. But not surprised as the majority of real estate agents are shady and only concerned about their bottom line.
In the east Bay Area, we are seeing many homes go on the market that were purchased in 2020-2022. They must know something. Or they just got in over their head paying 50% more for the property than in 2018-2019 for a crap box of gingerbread fused together with vanilla frosting.
Regardless, they are still in la la land hoping they can squeeze an extra 50-60k above their purchase price just to break even.
A lot of these sellers are clearly regretting their FOMO decision from 4 years prior. Especially with layoffs in this region that seem to be picking up steam.
U.S. 10 Year Treasury has popped above the (declining) 50-day MA today. Strong USD rebound in ForEx as well.
Will the next banking crisis occur when all those people who overpaid for thier homes need to unload them (job change, layoff, back to office in another state) find they are unsellable, and they just walk away like some of the CRE landlords? As prices continue downward, these homeowners will have more and more NEGATIVE equity. Someone is going to get the short end of the stick.
Banks no longer hold these mortgages. The government guaranteed them and packaged them into MBS and sold them to investors. There may be a taxpayer crisis, but not a banking crisis if these mortgages default.
From an old seasoned agent/investor. Watch the growing DOM–Days on Market. As it grows, the homeowners will loose their oars(their equity will evaporate) Just like 2007-2009. Low ball the high DOM listings. You will win. Not a question of if but when. Patience, patience is key
This is gonna be the mother of all meltdowns/disasters/crashes/calamities.
Any home seller who is serious about selling better lower their asking price to realistic levels, otherwise they might be left holding the bag. Destitute. Out of luck. In the poorhouse. Oh, and WE all know who created this greed bubble. We’re just not supposed to say.
“Gradually, then suddenly.”
There are at least 8 for sale/rent signs on my street and the next, 4 of those signs are directly across the street from me. Most of the homes are mega landlord owned and are offering 2% incentives to compete with the new construction in the area. During July/Aug sales dried up and the supply of homes increased.
I’m in a formally hot market and prices are definitely down in the last 3 months. The rental we left is listed for less than we were paying and has been on the market over 90 days. I don’t think it will rent anytime soon.
Also, on either side of me are homes with multiple families living in them. I saw this in Florida during the GFC and it looks the same again. Good jobs are scarce and salaries are way down.
People are still buying a shit load of service and goods. Job opening are still high means wages are not going down.
Correct.
https://wolfstreet.com/2024/10/04/ok-forget-it-false-alarm-labor-market-is-fine-bad-stuff-last-month-was-revised-away-wages-jumped-no-more-rate-cuts-needed/
I recounted on my morning walk, it’s 11 for sale/rent signs on two streets. We are spending a lot too, on a smaller income, because we have to.
This here. Wage increases will combat this mess.
What’s more likely to happen in housing: Urban decline in prices. For me, wolf combines Phoenix with Mesa and Chandler. Chandler median home prices are around 600k and mesa is at 550ish. Phoenix on the other hand has been around 415-420k. Why? Well Phoenix can build whereas chandler has no room to build and mesa is heading that way.
It seems that prices are essentially flat YoY since 2022 (and actually declined a little when adjusted for inflation). For a significant price decline, rental home vacancy rates need to increase. Unless those ones owning several homes (via mortgage) and renting them are in somewhat pressure, it is hard to expect a significant decline. If the FED does not enter into another balance sheet increase frenzy, that might possibly happen in 2025.
It’s only “flat” as a national median price, which averages out the big losses in some metros and the big gains in other metros. My “Most Splendid Housing Bubble” series shows it metro by metro:
https://wolfstreet.com/2024/09/12/the-most-splendid-housing-bubbles-in-america-price-declines-spread-to-25-metros-of-top-28-with-19-below-2022-peaks-3-set-new-highs/
Rental homes in the 25 square blocks my puppy insists we walk regularly have gone from none to at least six empty the last couple months…
OTOH, almost every sale has been demolished and a new and MUCH BIGGER house built.
Definitely a very very MIXED situation here in the ”saintly” part of the TPA metro area.
Poeple hoping for the next crisis is delusional as the housing is demand and supply issue. With all asset price jumping, and new immigration coming in, hard asset won’t go down much.
Here’s an example:
Well “delusional” is my middle name, plus I am sure there were plenty of delusional people back in 08…yeah yeah I know this time is different blah blah…
Even in my town in the exburbs of beantown I am seeing more homes being delisted.
I have tried to short the housing industry for about a year on and off. I certainly thought higher rates would hurt this market selling prices.
Now rates are dropping. I don’t know but if almost feels like the chance of house prices dropping may be gone?
Good job report. Employees are demanding better pay. Boeing union is asking for a 40% raise over 4 years. So the average Boeing salary is $75k. So in 4 years they will be earning $105k. Lets say 2 Boeing employees are married. They will see their income go from $150k to $210k. That will boost their house buying power $180k.
The lock in effect is real. I know people who have good jobs and want move to bigger home or move to a different city and they cannot. They have 2.5% mortgage rates and moving means they get smaller house for the same payment of the same sized house but for a much bigger monthly payment. But they are not struggling and are not in any danger of losing their home.
Just spewing out thoughts and really no take on what will happen with housing.
Breaking ground on new 3000sqft condo’s from 4 mil. Ave income of the area, somewhere around 140k. Clearly I should buy one and then sell for 8 million in a few years to the fireman and his teacher wife.
Maybe it’s all Markets can run longer than reality, or whatever that saying is. If something should occur, the US govt will say no one could have ever imagined this would happen, nothing is wrong, etc..
I would recommend moving away from the USA once you’ve made your $$$. Every friend now nearing retirement or has retired has moved away.
For the last price I sold our mountain home I can buy a beach villa in spain.
I can’t imagine the fools buying up these overpriced properties in Colorado & California I guess I sold all of mine to the greater fool theory folks. Hopefully they’ll be able to resell for a profit but I’m going to guess that’s going to be a hard no in the coming decade.
a lot of my tech friends without kids have done this.
If the United States goes down, nowhere else will be normal. Thats the fallacy of the bunker class.
What we are seeing is the real-time creation of housing haves and have nots. No one worked harder or made value. They just hit the lotto in some places. This 4 mil condo town is one of the Powerball winners.
@someGuy The average income in the Bay Area is probably less than $140K, but last week I was passed by a Bugatti Chiron on 280 that cost about $4 million out the door. An “average” guy was not driving the Bugatti just like an “average” guy won’t be buying a $4 million condo.
I would think income in many parts of the Bay Area would push 200k. But you’re right, that’s not who would be purchasing this. Im referring to a much smaller area of income. And I’m also pointing out the flat out random effects of many homeowners who had a gain they had no idea would ever occur. A gain which could be a loss to all other participants. We’ll see on that one. Certainly will be a sustained loss for the town to anyone under 40.
In my neighborhood, here in very desirable SW Florida, are two homes I have been watching for a while. Both would be good buys, but they have been on the market for a while and the owner(s) continue to drop prices.
There is one on my street, 8 doors up, that has been on the market for about 10 months. I looked at it over a month ago, because I wanted to know why it was not selling after the owner dropped the price from 330K at the beginning of the year to 280K. I just went on Zillow and it looks like it may have a contract on it. It needs a new roof and a lot of TLC all throughout the house. The original owner died and didn’t maintain it very well and his son inherited the house. I’ll see if it sells for how much. I would have offered 250K as is.
The other house is about a mile West of me in a very nice neighborhood. It is currently listed at 315K, but it was listed at 399K just 4 months ago. The owner(s) have continued to drop the price over the past few months. So, why is a nice house in a nice neighborhood not selling? I figured it out today. It’s less than 1000 feet from a river – it’s in a flood zone. We’ve had 3 hurricanes in 7 years: Irma, Ian and Helene. Flood insurance may be expensive and home owner’s insurance cannot be had until hurricane season ends on November 30. God knows how much that’s going to cost. My tiny 2br/2ba retirement bugalow, a mile a way in a non-flood zone area, is costing me 400/mo. This lovely house less than 1000 ft. from the water may be prohibitively expensive to insure, unless a rich person buys it and self-insures. In our area, rich people buy the megamansions on the water, 1000 ft. West of this house. It’s not just the cost of the house any more. Cheers.
One of my friend in San Diego got his renewal quote for home insurance, 2500 sq ft HOA house. The quote is $12K/year and house is just 2 year old.
His total property tax plus other HOA fees and insurance above per year is: $36K. This is all before the mortgage itself. The house is worth 1.6 million dollar.
My other friend is trying to rent his Encinitas home worth 1.4 million for $5.5K/month
I’m a buyer who’s waiting for the housing market to cool.
A report from the Oakland, CA neighborhood:
A house on the adjacent street has been neglected since I moved to the neighborhood in 2019. It has been waiting for the right time to be put up for sale. The interior has been renovated with new appliances, furnishings, and fresh paint. The house was listed for one million dollars and has been on the market for a month now. The house next door to it is the next property they will bring to market. It’s in poor condition, boarded up, and neglected. I expect they will start working on the next one after selling the current listing. Who knows what the eventual selling price will be? The home sellers in my hood begin high, then reduce the asking price to move the property.
This analysis of the current housing market trends is quite insightful! It’s fascinating to see how new listings are increasing in a month when they typically drop, especially in light of the broader economic conditions. As someone living in Mesa, Arizona, I’ve noticed similar patterns here. The inventory levels and falling listing prices are definitely raising eyebrows among potential buyers.
I’m curious, with many buyers still seemingly on strike due to high prices, what strategies do you think sellers might adopt to attract more interest in this challenging market? Do you believe we might see more incentives or adjustments in marketing approaches as inventory continues to rise?
We’re landlords.
Over the recent five year period we’ve encountered quite a few families who sold their homes, expecting prices to fall so they could buy back for less.
But guess what? Prices only went up even more, so just about everyone of them could not even buy their old home back.
Timing the housing market is a very dicey strategy.