Mortgage rates also ticked up.
By Wolf Richter for WOLF STREET.
The Treasury yield curve is un-inverting piece by piece, but not in the way future homebuyers want: before and since the rate cut, shorter-term Treasury yields have fallen, driven by the Fed’s actual and expected rate cuts; but longer-term Treasury yields and mortgage rates have inched up.
As shorter-term yields drop while longer-term yields rise – or fall more slowly than shorter-term yields – the yield curve un-inverts step by step and eventually enters its normal state where all shorter-term yields are lower than longer-term yields.
But it still has a long way to go before it’s un-inverted all the way, to where shorter-term yields are lower than longer-term yields across the yield curve.
What we have now is a yield curve with still high but falling shorter-term yields, a sag in the middle with the low point at 3 years, and rising longer-term yields.
Mortgage rates roughly parallel the 10-year yield but at a higher level, and a daily measure of mortgage rates also ticked up since the rate cut on Wednesday.
The chart shows the “yield curve,” with Treasury yields across the maturity spectrum, from 1 month to 30 years, on three different dates:
- Friday, September 20 (red line)
- Tuesday, September 17, the day before the rate cut (blue line)
- July 23 (golden line).
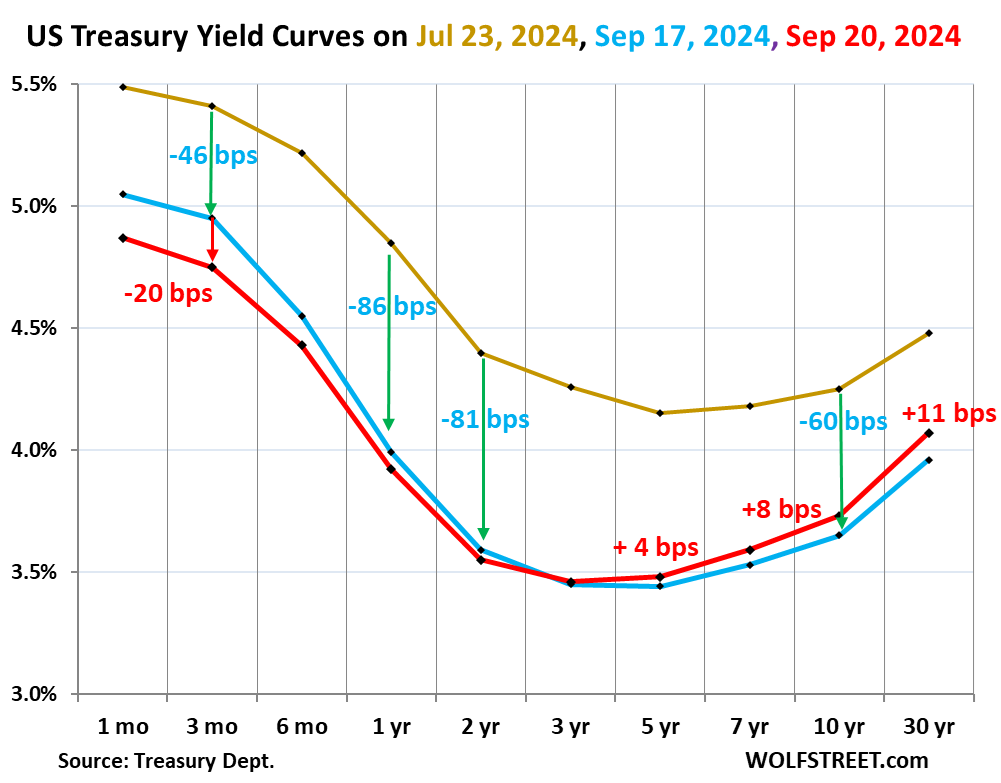
Between July 23 and September 17, yields plunged across the yield curve in anticipation of lots of rate cuts from the Fed – thereby pricing in a bunch of future rate cuts:
- 3-month: -46 basis points
- 1-year: -86 basis points
- 2-year: -81 basis points
- 3-year: -81 basis points
- 5-year: -71 basis points
- 10-year: -60 basis points
- 30-year: -52 basis points
From September 17 to September 20, from the day before the rate cut to two days after the rate cut, reflected by the red line in the chart above, shorter-term yields fell further, but longer-term yields rose.
- 3-month: -20 basis points
- 1-year: -7 basis points
- 2-year: -4 basis points
- 3-year: +1 basis point
- 5-year: +4 basis points
- 10-year: +8 basis points
- 30-year: +11 basis points
Why have longer-term yields risen since the rate cut?
Trying to explain why something is happening in the financial markets is somewhat of an iffy affair. But we’re going to outline a couple of factors that play a role.
A bunch of rate cuts have already been priced in. Current shorter-term yields reflect expectations of future Fed policy rates within the term of the security. The act of pricing expectations of future rate cuts into current yields cause these yields to plunge.
For example, the 6-month yield will be most affected by expectations of what the Fed does over the next four to five months; the 2-year yield will be affected by expectations of what the Fed does over the next two years.
But this gets iffier for longer-term securities because other factors drive them, not just expectations of future short-term rates, including inflation expectations over their term.
Inflation concerns might be creeping back into the equation, now that the Fed is loosening monetary policy with a series of rate cuts in a decent economy with decent consumer spending growth, employment at record highs (though job creation slowed dramatically and that could turn into a problem), wage increases that are still substantial (3.8% year-over-year, 4.9% annualized in September), with still lots of liquidity sloshing around, loose financial conditions in many areas of the economy (CRE excepted), and with stock indices at precariously high levels. People with assets feel wealthy, and workers are still getting substantial pay increases, and that too drives spending, all of which is fertile ground for inflation to thrive.
Inflation has come down a lot — and that gives the Fed room to cut — but inflation is not a steady trend. It’s a zigzag movement, and CPI has accelerated month-to-month over the past two months, which may have just been another squiggle, or a change in direction. And no one knows what inflation will do in 2025 and 2026 when the Fed’s policy rates are lower. Investors who buy securities that have 10 years left to run struggle with these uncertainties and try to price them in somehow, which would cause longer-term yields to tick up.
Treasury yields and the Fed’s policy rates.
Short-term yields are pricing in the expected rate cuts during their term. A security with 3-months left to run will trade on expectations of rates largely over the next two months. The closer the security gets toward its maturity date, the less policy rates matter because on maturity date, the holder will get paid face value plus interest. And that’s the value of the security on that day.
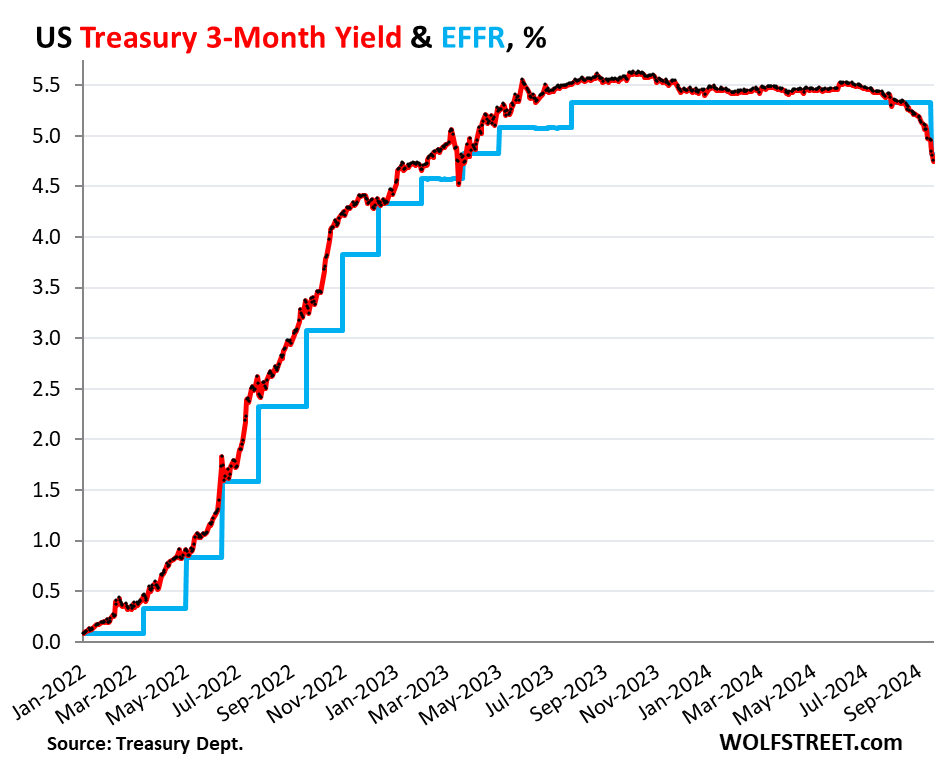
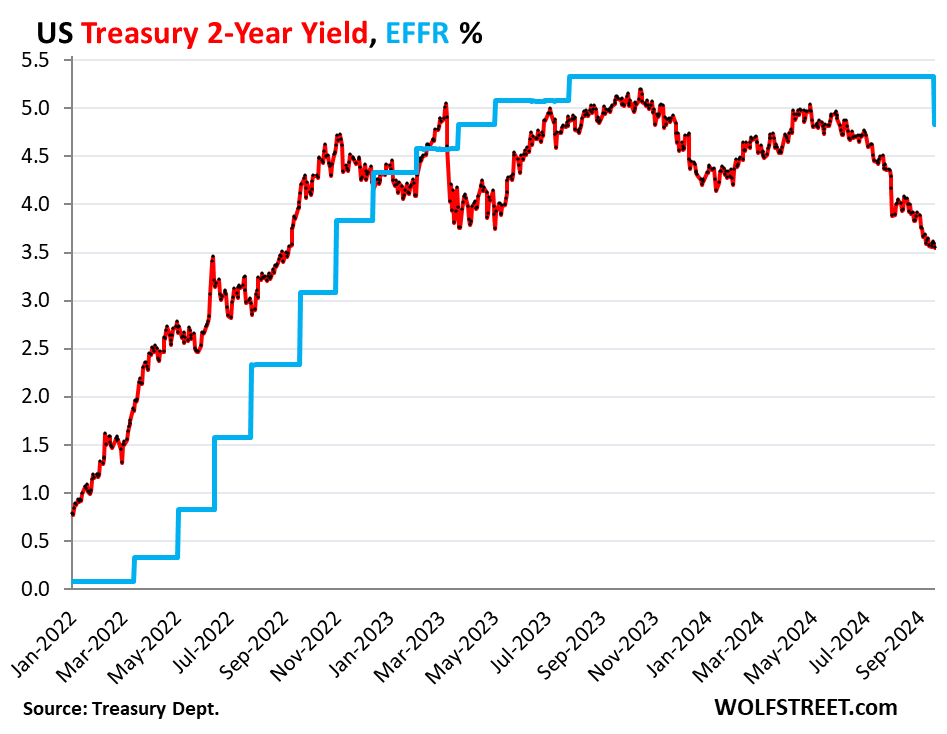
So below are charts of some key yields in relationship to the Effective Federal Funds Rate (EFFR) which the Fed targets with its headline policy rate (blue in the charts).
The EFFR dropped 50 basis points the day after the Fed announced its 50-basis-point rate cut, from 5.33% on Wednesday to 4.83% on Thursday and didn’t change on Friday.
The 3-month yield dropped to 4.75% on Friday and is beginning to price in a rate cut in November. A December rate cut is outside its window and doesn’t impact it anymore:
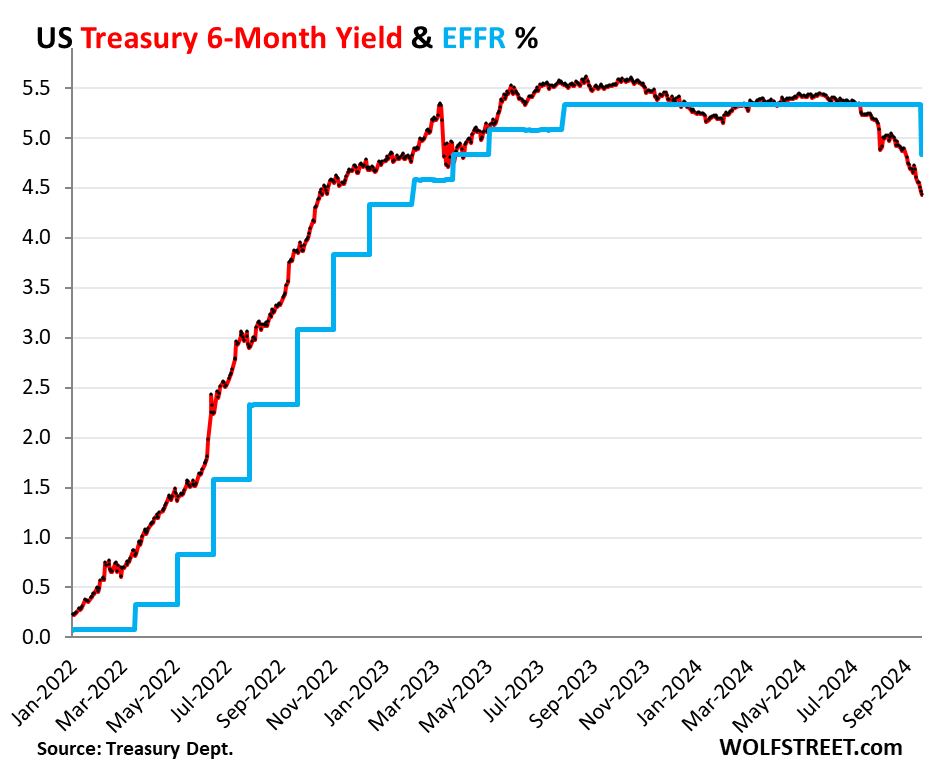
The 6-month yield dropped to 4.43% on Friday, pricing in nearly 50 basis points in cuts within its window:
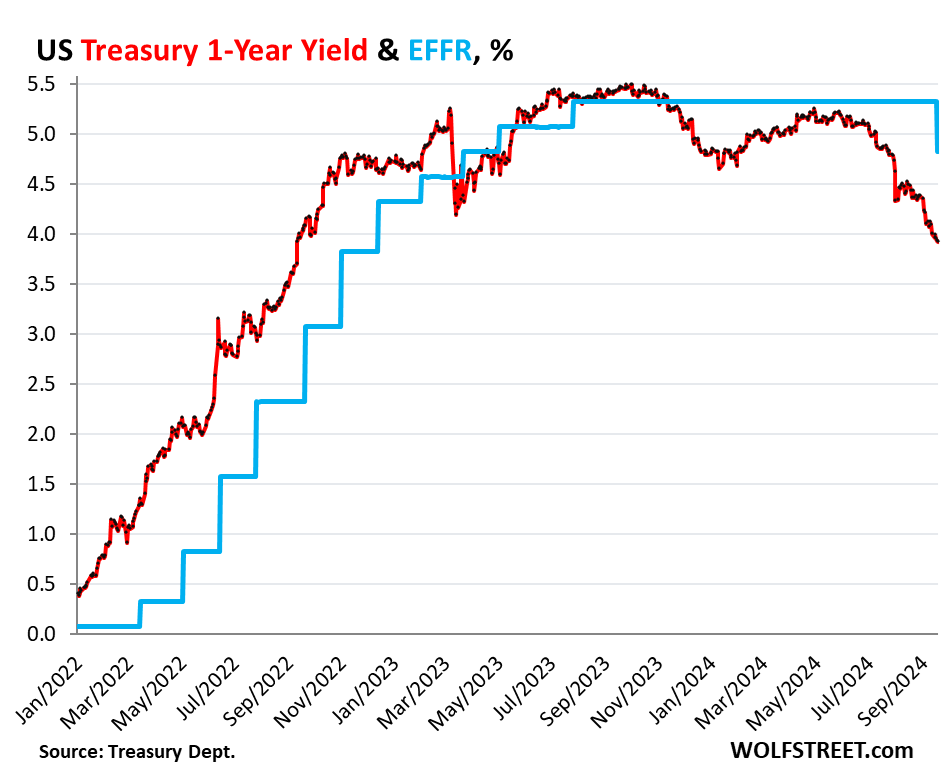
The 1-year yield dropped to 3.92% on Friday, pricing in about 100 basis points in cuts.
The 2-year yield dropped to 3.55% on Friday, pricing in another 120 basis points in cuts so far over the next year, and more cuts in the second year. Over the past 9 days, the yield has ticked down only 4 basis points, so roughly unchanged by the actual rate cut.
The arbitrage is that investors give up 120 basis points in current 3-month T-bill interest income, but as T-bill yields decline with rate cuts, the difference is going to shrink, and in about a year, that 3.55% interest income will be higher than T-bill yields will be then, and in the second year, will be substantially higher than T-bill yields will be then, so that over the 2-year term, the combined interest income will be slightly higher than the combined 3-month T-bill interest income over those two years – that’s the bet here.
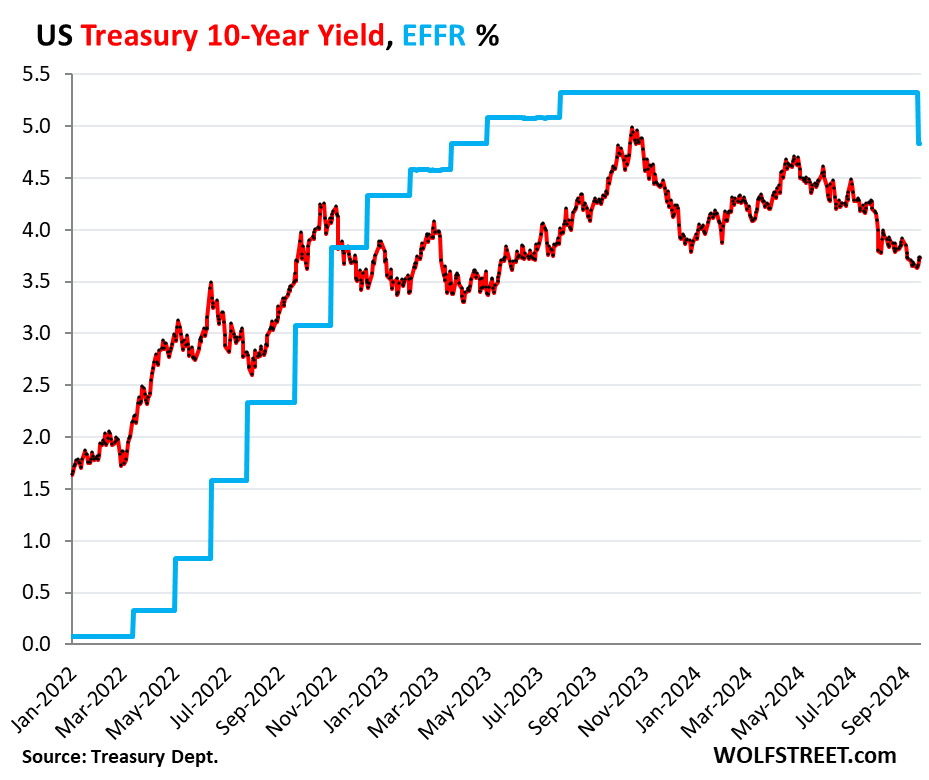
The 10-year yield has risen 8 basis points since the rate cut, to 3.73% on Friday. It’s back where it had been 12 trading days ago. This is a long-term bet essentially on inflation and Fed policy rates. Investors are currently betting that inflation will average about 2% over the 10-year term. If those inflation expectations rise, the yield would follow.
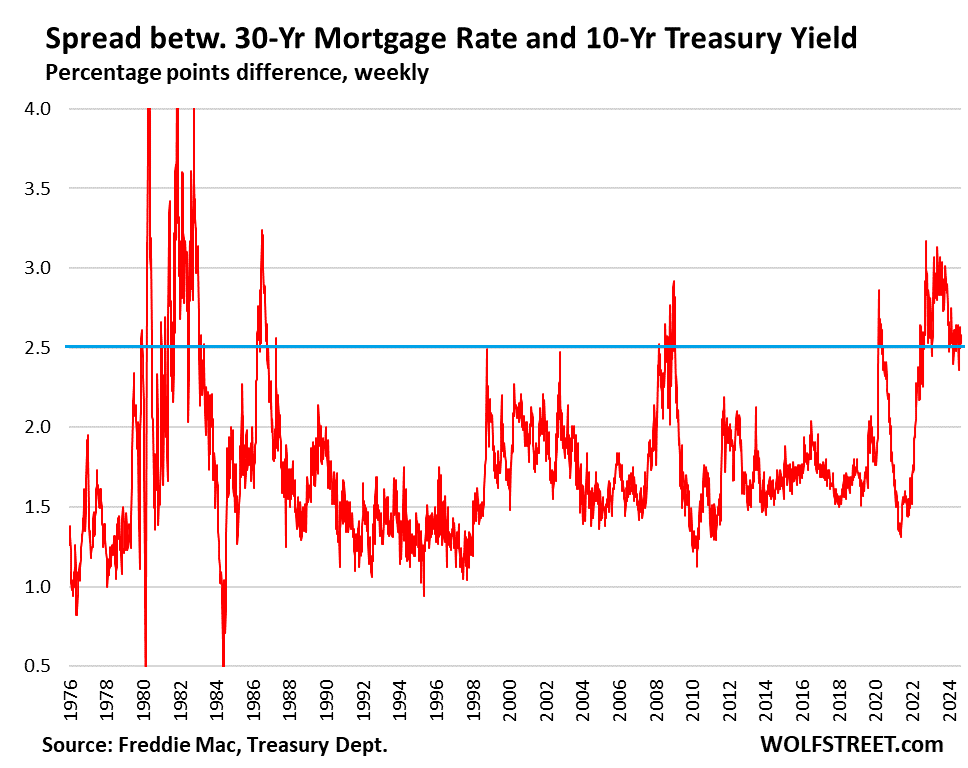
Mortgage rates roughly parallel the 10-year yield but at a higher level. The spread between the average 30-year mortgage rate and the 10-year yield is currently 2.5 percentage points.
Over the past four decades, the spread has ranged from near 0 percentage points (briefly when the 10-year yield shot up in February 1980 and in May 1984) to over 4 percentage points several times in the 1980s.
Currently, the 2.5 percentage point spread is in the middle of that wide range but wider than average over the past 20 years.
During the years of QE, when the Fed bought MBS, the spread narrowed.
During QT, since the Fed started shedding MBS in late 2022, the spread has widened. The Fed said it would let the MBS run entirely off its balance sheet, so this is likely to continue for years even after QT ends. As the Fed steps away, market participants will have to be enticed to take its place, and this could mean that the spread will average wider than during the era of QE.
Enjoy reading WOLF STREET and want to support it? You can donate. I appreciate it immensely. Click on the mug to find out how:

![]()
Inflation is most likely go up from there. Not because of rate cuts. FED balance sheet is unreasonably high and it will not go down meaningfully in the near term. Budget deficit is out of rage and neither of the candidates declared even the slightest intention to reduce it. These two factors will bake in and continue to inflate the asset prices (currency devaluation). As a result consumer inflation will start going up, just like the asset prices.
My observation about employment is similar to Wolf. People around me are finding jobs. Some of them are upgrading their jobs.
One of the great mysteries to me is how the long term (10/20/30y) inflation break-even rates are so low. With the deficit now being a standard 6% during boom-time, accepted without much political controversy, and certainly going higher when times go rougher, how is the government going to refinance? Is everyone assuming there will be big tax hikes, or alternatively a US version of Milei cutting down every spending everywhere? Maybe in 50y but the generations taking over the voting majority in the next two decades are even more pro deficit than the existing ones. Markets seem to massively under appreciate long term inflation risks.
“Is everyone assuming there will be big tax hikes, or alternatively a US version of Milei cutting down every spending everywhere? ”
Neither one. The debt will be outgrown by inflation (currency devaluation). Govt debts are not meant to be closed up. The bonds get paid by taking more debt in the future.
For countries like Argentina or Turkey, this is a big problem because their currencies are not reserve currencies. For countries like US, there is virtually no limit for govt debt. It gets eventually outgrown by inflation.
Ponzi,
Yup.
Inflation will help resolve massive US Federal – and State – debt.
Until it doesn’t.
We’re all ‘up the creek’ now.
If debts will be outgrown by high inflation, why does the 10-year only reflect a 2% inflation rate? Does the market disagree with you, or is something else going on.
Perhaps the market believes inflation will be higher than 2% over 10 years (as you predict), but long-term rates will be suppressed via monetary intervention or stagflation. Seems reasonable to me, but that means the state of the real economy, the one without monetary support, is not swimming but is treading water at best.
Bobber,
“Does the market disagree with you, or is something else going on.”
Look, the first thing you need to understand is “the market.” It exists BECAUSE there is disagreement. Without disagreement, there would be no market because no one would take the other side of the trade and there would be no trades and no price and no market.
The seller thinks that inflation and rates will head higher over the next 10 years, and so he SELLS his 10-year securities to get out from under them before it’s too late. But the buyer, by definition, disagrees and thinks the opposite, yields and inflation will head lower, and that this is an opportunity to get in at a low price, and so he buys them from the seller. Both get what they want. But one of them is going to be wrong. And that’s how the market price is established – when two investors/traders that fundamentally disagree with each other make deal.
What changes the price (yield) is varying pressures to buy or sell. But the principle is always the same: a market is composed of participants who fundamentally disagree with each other, which is what you need to even have a market.
Bobber: “If debts will be outgrown by high inflation, why does the 10-year only reflect a 2% inflation rate? Does the market disagree with you, or is something else going on. ”
I think Wolf’s answer is excellent explanation. Just as an addition, if “markets” were correct for long term expectations in 2021, the FED fund rate would never go above 2% after the pandemic (at least for several years). Otherwise SVB and others would not buy 10-year treasury bonds with near 0% interest worth hundreds of billions. As you can see, markets are not so good at predicting the future. Neither I am.
Yuan. I share your great mystery. I hope Wolf will answer. Who is buying long bonds today. Seems crazy with rampant inflation the last several years. Is the FED buying long bonds to keep their price up and yield down?
1. “Who is buying long bonds today.”
investors who believe that long-rate will drop further, which makes those bonds more valuable, and you can sell them for a profit.
investors who believe that inflation will average 2% for the next 10 years, and that the Fed will drop short rates to below 3%.
not everyone agrees, which is what makes a market.
“Is the FED buying long bonds to keep their price up and yield down?”
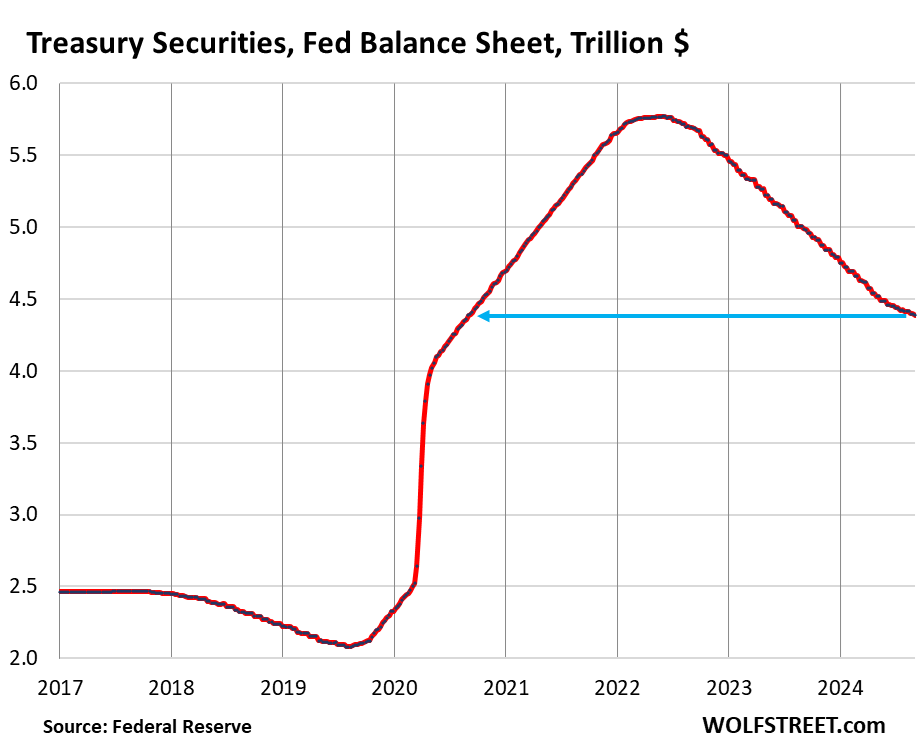
Opposite. The Fed has been and still is shedding them:
https://wolfstreet.com/2024/09/05/fed-balance-sheet-qt-66-billion-in-august-1-85-trillion-from-peak-to-7-11-trillion-back-to-june-2020-another-qt-milestone/
Aren’t the actuarial buyers (life insurance and pensions) pretty big players in the long bond market?
1. “Who is buying long bonds today.”
investors who believe that long-rate will drop further, which makes those bonds more valuable, and you can sell them for a profit.”
Agree, with the following clarification in my case. I hold a decent chunk of long bonds because I believe monetary and Treasury interventions will continue as needed to keep long rates below 5%, perhaps substantially below 5%. If I thought long rates would be subject to market-based price discovery in the future, I would never hold a long bond for even a minute. Also, holding some long bonds fulfills a diversification purpose as well.
With our continually rising debt-to-GDP ratio and political hesitance to reduce deficits, I expect we’ll be stealing pages from the Japanese central bank playbook, which is highly interventionist.
I’m simply expressing what’s driving my own actions in the market. I’m the authority on that.
@Bobber
I agree that rates will fall, and I also own long duration bonds, but the TIPS variant not the fixed rate one.
In my opinion the benefit/risk is extremely asymmetric. If inflation will be >2.1% it’s better to own the TIPS, else it’s better to own the fixed rate bonds. What’s the risk that inflation will significantly undershoot that value, what’s the risk of it significantly overshooting that value? Looking at the FEDs response to recent deflation scares vs inflationary bouts, and in addition looking at the factual necessities of the US government financing and the FEDs ultimate political dependence, the answer to me is absolutely clear.
Why is the the marginal market participant who is setting the price differential between these bond types seeing it so differently? Maybe because I’m simply wrong, but I’m more inclined to think that big ships like banks & pension funds buy the fixed rate bond whatever happens, skewing the demand picture away from the ‘efficient market theory’. If so that’s a great blessing to small investors like us who can act more ‘intelligently’.
JohnH: Aren’t the actuarial buyers (life insurance and pensions) pretty big players in the long bond market?
Yes, but they often aren’t the marginal buyers. They are typically buying regardless because they need duration exposure to plan for meeting their long-term liabilities. Marginal buyers are foreign investors, people deciding how to allocate their 401(k)s, non-mandated active bond funds, banks, and so on.
One factor that will tighten labor markets is baby boomers looking at their fat 401ks (thanks, Bernanke, Yellen, and Powell!) and retiring.
The “median” age for a boomer is now 69; next year, it goes up to 70, kind of elementary school math.
As these boomers disappear from the work force, they leave behind a much smaller Gen-X.
They also stop contributing to their 401ks and need to start drawing from them to pay real estate taxes and insurance. I know a fellow whose real estate bill on his multiple homes was $30k several years ago. Surely higher now. Big stock investor. Bullish on speculative issues like GitLab (which loses more the more it grows). Has made oodles of unrealized gains in this QE driven boom. But is his dividend income enough to fund his fixed living costs, and his frequent jaunts to DisneyWorld. (Huge DisneyWorld fan)?
Right now inflows into 401ks are buoying market, especially. S&P500 ETFs. But large numbers of former high-earning software developers are being laid off, and if we go into recession those inflows will drop even more. And boomers continue to retire, and more and more on the older are having to move into very expensive assisted living. At what point does the forced sales of stocks to cover aging boomer fixed costs overwhelm the inflows to 401ks? Because current stock market valuations are totally disconnected with flow of cash to stockholders, the result will be an implosion as boomers are forced to sell, and the more they sell the more their stocks will lose value, forcing even greater sales. Is this coming soon? Or still long in the future?
The majority of those 69+ don’t own any stocks or bonds. They are the pension + Social Security generation. And 40% only have Social Security.
Maybe they’ll be a shortage of people capable of high level management for a while, but with all the millennials and Gen Z coming into the work force, along with immigrants, I don’t see a shortage of workers.
I think the Baby Boom retirements have opened up some huge career advancement opportunities for younger generations.
Baby Boomer holdouts like Wolf are getting harder to find.
Millennials are 40 now. They came into the workforce 20 years ago.
In my experience, Boomers are not leaving those mgmt
positions due to poor finances.
They’ll be no shortage of workers because with the world economy down the drain many retirees will be returning to the workforce and work to the day they die.
The big inflation event of 2021-2022 already happened.
Now we reap the rewards of the fix.
Great piece, Wolf. And an important reminder to us all, and housing bulls especially, that Fed rate cuts in the here and now don’t necessarily entail lower mortgage rates.
Yeah I doubt that mortgage rates drop below 4 again pending a catastrophe.
A lot of potential financial energy was lost from so many refinancing at 2.5-3%.
But refinancing a 7 into a 4 would be smart.
@sufferinsucatash
I don’t even see how we would ever get down to 4%.
I bought two homes from 2011-2018 and both times the rates were 4.25. There is no way the rates could get there unless the fed intervenes again.
Even if the fed rates gets to 3.0%, the mortgage rates would be about what they are now.
the first few days after a 50 bp rate cut investors should allow time for yield curve steepening trades to be put on by trading desks and hedge funds. they are done in large size and push the 30 year Treasury yield higher. this YC trade effect should be done in a few days and then we can see where the 10 and 30 yr Tsy yields will be.
Excellent article per usual. Continued gold price increases may also support the notion that perhaps inflation is not completely “licked”. I am also a bit skeptical that the Fed’s balance sheet is on an inevitable downward trajectory. A turbulent Treasury auction or another bank run may lead to an abrupt U-turn back to QE, regardless of inflation numbers.
“turbulent Treasury auction”
We may well get some of those, but the last time the Fed did QE, it took a pandemic and the lockdown of the economy, not a turbulent auction. Before then, it took the Financial Crisis, with the global financial system on the very of collapse, for the Fed to start QE. Before then, it took WW2, when the Fed guaranteed low long-term rates by buying Treasury bonds. It stopped that after the war when inflation hit 17%. So don’t get your hopes up too high about QE.
@Wolf
I would another instance to your list: In the 1970s, the Fed massively expanded the money supply, due to the (loss of the) Vietnam War and the Oil Crisis.
A “financial crisis” or “world war” seem more likely than not, to me. Especially if one believes that the deflationary cycle ended in 2022 with the transitory end of QE experiment.
I read TheLongerView’s comment to encompass the next 30 years, rather than just the next 3 months, or even the next 3 years. Hard to believe that some form of crisis WON’T lead to another balance-sheet related remedy — the genie is out of the bottle.
30 years? OK, maybe, but in the long run, we’re all dead. We’ll worry about QE 30 years from now when we get there. It’s just nuts to try to predict monetary policy 30 years from now.
QE mongers will always be QE mongers. “Bobber,” one of the biggest QE mongers here, is just talking his book. He holds long-term bonds he said just now, and he would benefit hugely from QE. So he’s promoting QE left and right on my site for his own financial advantage, and I have to block him because I don’t allow promos.
I’m sick of this QE mongering here. Post it on X.
The genie never was happy with being in the bottle. But now that this angry, non-binary genie has emerged, I wonder who this genie serves, who rubbed the bottle, what 3 wishes will be granted.
This is not good.
Those with children care about the long run. Lord Keynes was childless…
kramarti,
That is a very shallow and stupid remark, reeking of agenda.
Rethink what you said…..please.
Wolf,
I will admit I never understood the “Talking their book” type of investors (like Bobber). To me, when I invest in something it because I think it is undervalued. As such, I want it to remain undervalued so I can buy more of it later. The bigger percentage of an asset i can buy at undervalued prices the better for me.
That said, I think of myself as an owner of assets. I want to own assets that provide great future owner’s earnings that I can benefit from. Others think of themselves as traders. They do not care about the value of an asset, they just care if they can find someone to sell it to for a higher price in the future. Greater Fool Theory.
Thise are the people who talk their book.
Right now I hold 10% long bonds, 40% stocks, 5% gold, and 45% TBills.
Bobber,
50% of your holdings are in investments that would massively benefit from QE (stocks likely more than long bonds). You said in another comment (which I blocked) that your “honest worry” is that the Fed will unleash QE again at the next squiggle.
No, not buying that. If your “honest worry” is QE, you would write to your member of Congress and to your two Senators to tell them to pass legislation that would prohibit the Fed from committing QE in the future, and then you would state in the comments that you have sent those letters, and you would send me your letters, urging me to publish them (and I might!). Then I’d believe that your “honest worry” is QE. But the way you’re positioned, it tells me that your many QE-mongering comments here are an effort to get people to jump on your bandwagon of QE-mongering for your own benefit.
I used to think those with children cared about the long term.
In my opinion, rising long-term yields suggest bond investors are slowly coming to terms with the growing possibility that the end of 2024 though the first half of 2025 won’t see the arrival of a recession.
Without a recession, headline inflation will start to rise sooner rather than later, with upwards of 3% by spring of 2025 being possible. The direction of CPI for the next 12 months will be determined by the end of 2024.
There was also the 2019 repo crisis.
They provided liquidity to the repo market via repos that mature the next day or in short terms such as two weeks. That’s short-term liquidity.
They did a similar thing during the bank crisis in March 2023; they provided liquidity for a short period, while QT (shedding bonds) continued.
The Fed is lender of last resort to the banks and others — and always has been. It has different mechanisms to lend, such as the Discount Window or repos. All loans are against collateral and relatively short term. And that’s not QE.
QE is buying bonds that get stuck on the balance sheet.
I would wager that QE doesn’t return for good unless the financial system was on its knees. Any QE intended to juice up the economy will lead to complete loss of faith in the Fed.
There is ample evidence that even the Fed believes QE to be a failed policy (of course they are unlikely to publicly admit it). It will be difficult to get support for such a policy in the future.
But then who am I to know :)
QE has been taken out of context. It now appears to be a failed attempt to stimulate the economy. But when it was launched, the economy was flatlining, the fear was deflation, in spite of ZIRP. Not much outrage back at that time. Now, of course, it appears to be a stupid idea and the Monday-morning economic experts are ranting about it.
Plenty of people opposed QE to stimulate the economy in real time. It’s why Thomas Hoenig dissented from the policy throughout 2010 when he was on the FOMC. He correctly predicted the policy would result in growing income and wealth disparities. Hoenig supported QE in the context of the financial crisis in 2008, it was only when Bernanke later implemented QE to spur asset price growth and the wealth effect that he dissented. I think it’s incorrect to suggest criticism of QE to stimulate the economy is only really being done in hindsight.
rojogrande, I wasn’t aware of Hoenig’s dissent. But the first QE did not stimulate growth, and, as you know, there were subsequent iterations. Getting the timing right is everything in economics, and in other spheres, in lovemaking, too.
The lag effect of Fed actions is a very tricky matter. The Fed tends to get it wrong, or less than ideal, in both directions – up or down. That’s why the “soft landing” is almost never realized, and the “Goldilocks” economy is as rare as a turquoise swan.
Japan just made a comment that QE has helped wages rose the most going back 33 years.
But they do not mention that prices went up too.
… and faster than wages, and that the government spent huge sums of money to subsidize fuel costs at the wholesale level so that consumers wouldn’t get whacked all the way by energy price spike, and that it blew huge amounts of money to prop up the collapsing yen.
The future of interest rates will be decided in early November…
Your policy opinions sir are are obviously not driven buy common sense as shown by the fact that you can’t hold back your glaring TDS
James –
That is true frontier gibberish…
Well done.
Extremely informative overview of the current, foggy potential of the synthetic rate market. IMHO, the only thing that is currently predictable is the interest rate structure which is under the control of the Fed.
Eventually, the long term interest rate will increase to better reflect the substantial risk that currently exists.
The Fed doesn’t control the interest rate structure. They only control the short end.
They manipulated longer term rates via QE but have backed away from it now. This means that the longer term rates will be priced more on supply and demand in the future.
I think the bond market has become lazy and perhaps biased by several years of low inflation in a growing economy. This was a period where the households were healing their balance sheets from the GFC.
We are now in a new world, where households have solid balance sheets so there can be more inflation from low interest rates. I would expect us to go back to normal interest rates…which is a good thing for spending but bad for valuation.
This comment deserves some love.
Central banks around the world have been engaged in “emergency actions” for quite some time now, so I’ll simply refine your thoughts and speak the truth…
…the bond “market” is fucking irrelevant. This isn’t your father’s “market”. Hedge accordingly.
Also, remind us how Uncle Sam is going to afford the interest payments at “normal” interest rates? Historically this would be 5-7%. Maybe you should be more specific and actually give us a number. LMFAO!!
I have heard many pundits say the FED fund rates should just follow the 2 year Treasury the markets demand. Then you could get rid of 11 people from the FED just have one who sets the rates by watching what the 2 year does. LOL
But the 2-year yield follows what it expects the Fed will do within its 2-year window, as it’s pricing in rate hikes and rate cuts, based on the Fed’s communications, including the SEP (which currently sees a longer-run federal funds rate of 2.9%). The Fed tells markets where it’s going. So if you take out the Fed, then the 2-year yield cannot expect what the nonexistent Fed would do, and therefore would follow aimlessly some televangelist?
Way I look at it, the only rate that matters is the “real” rate, defined as the interest rate minus the inflation rate.
If real rates are negative, a central bank is printing somewhere. There seems to be an obtuseness towards the “real” interest rate in the financial press. Negative real rates results in a benefit to someone, and perhaps, an asset tax to others.
I see a Fed that reports it is doing all kinds of nice things, and then, I see a fiscal deficit north of 6% of GDP, when GDP is rising 3%. I’m not understanding how that math works.
The rate situation depends on QE. If the Fed doesn’t step in and stop QT and start printing to monetize government debt, supply vs. demand in debt markets will create a floor to lower interest rates.
I see printing in our future because the mandate is open market operations to keep rates in a certain range.
“Way I look at it, the only rate that matters is the “real” rate, defined as the interest rate minus the inflation rate.”
Here is the Effective Federal Funds Rate, which reflects the Fed’s policy rate, currently at 4.83%, minus overall CPI: It’s 2.29%. every single “real” Treasury yield mentioned here is positive between 1% (2-year yield) and 2.25% (1-month yield)
DownFed your exactly right. QE when remunerating IBDDs lowers the real rate of interest by definition. Paying interest on reserves stokes asset prices period.
In 1982 or 3, I took out a mortgage for 14.5 pct. As the housing price bubble deflated, it became hard to sell the house. It took over a year and only sold because it was a good property.
Meanwhile, I had to accept a job in another town, impregnated my wife, and had to pay the rent on another house. So no one young should despair. The old, I’m beginning to see are susceptible to being wracked with doubt concerning their worthiness.
dang,
Bought a house after selling our condo (it took over a year) back in 1984.
Our lawyer explained to us that the difference between a condo and a STD was that you can get rid of a STD.
That definitely wasn’t true in 1984.
Worse than a condo is a timeshare. They are chronic and require amputation at the end.
One thing I’ve seen going through a couple dozen 10-k’s is that companies really don’t use commercial paper anymore. They use long term debt or their own shares as cash. So the impact of rate rises only appears in mortgage rates and corporate debt. At low interest rates, companies loaded up so the lag effect is pretty long.
It will be interesting to see what the effect will be on farms and retailers who use a lot of ST debt seasonally.
I see a lot of refinance activity in 2025-2029. Nearly every 10K I read I see that debt matures in that time window.
With the US government being a big borrower and absent any QE, this means that funding will be difficult in that period. We should start to see corporate debt becoming dearer.
The tech companies use their shares as funding via stock grants etc. so should be okay but with growth slowing the grants become a bigger valuation drag than has been in the past.
Next few years are going to be a good lesson on macro and interest rates.
Alight Financial Solutions is changing from using a money market fund for uninvested funds to a bank fund that i guess is a new product. The key takeaway is that the bank fund is federally insured if I read the document right. Anyone else heard of this?
Correct me if I’m wrong, but isn’t that likely chosen by your employer or whoever the person is that Alight uses in agreement with your employer? My employer uses Alight and the nearest thing I have to a “cash account” is a Russel Stable Value Fund mostly made up of Corporate Notes/Bonds.
The comment wasn’t about an investment option. It was about where Alight parked uninvested funds after a sale. Was an in-house money market fund, soon to be some kind of bank fund I haven’t heard of.
In case readers are unaware, Schwab (for example) provides less than 1% interest on your cash account whereas one of its “money market funds” pays approx. 4%+. Money in the cash category is immediately available, whereas the money parked in the money market fund takes a single day to become available (available meaning can be withdrawn or used for trading). You can trade with the mm fund money but need to settle (transfer) within a day.
And what funds are mostly available from alight? BlackRock, what mess is BlackRock in? CRE. They are spreading that shit pile as thin as possible thinking the masses won’t smell it! My new employer is using alight and it is so generic that I almost refused to set up an account. This smells so fishy – I will be changing my contributions to next to nothing for now.
“..that companies really don’t use commercial paper anymore”
There are $1.22 trillion in commercial paper outstanding right now (Sifma data). Of that $601 billion is from financial companies (banks, insurance companies, brokers, etc.), $342 billion is asset-backed commercial paper, and $271 billion is from nonfinancial companies.
In addition, many business loans are floating rate, including most leveraged loans (junk-rated loans not held by banks), pegged to SOFR. And a lot of bonds are floating rate (“floating rate notes”). A lot of the debt in CRE is floating rate (which is one of the reasons why so many properties went into payment default). All combined, there are trillions of dollars of floating rate debt in the corporate and CRE sector. And it will all get less expensive.
Yeah, Wolf, but commercial paper was about $2.2 trillion before the Financial Crisis. So corporations are using a hair over half as much commercial paper as they previously did, and maybe about a third as much on a real basis.
https://fred.stlouisfed.org/series/COMPOUT/
Commercial paper was heavily involved in the financial crisis — corporations relying on short-term funding for long-term investments turned out to be VERY risky when short-term funding dried up and then these companies blew up. It was part of the contagion. So yes, that pre-financial crisis craziness about corporate paper is gone.
“trying to explain why something is happening in the financial markets is somewhat of an iffy affair.”
But the bowel shaped curve makes sense that the FED fund rates can only affect the short term interest rate and as we further go on the time scale, it’s effect should diminish and the possibility of inflation and other uncertainties — like where this country would be — should have higher impact
and not just projecting from todays FED FR (like in weather prediction, the more you look into the future, the more error prone it is).
If we had gotten away from this normal model so far, it is because we have been the only cop since WW II but that is being questioned – Rise of China and perhaps India; SA moving away from Petrodollar etc. Yes, we have been fracking our way into energy independence but already there are signs that source is reaching it’s limit.
I would like to know who invests in what part of the curve and why. I use treasury direct to smooth out my monthly cash flow in a way that works as a life insurance policy if I pass away unexpectedly. So I use tbills. I would think financial firms would have little use for tbills and that could explain tbills current high yield.
You can buy older Treasury securities with one year or less to run, such as a 10-year T-note that was issued 9 years ago. It trades like a 1-year T-bill. There is a lot of this older debt on the market that gets traded every day. I can buy them at my broker. Sometimes you can get a better deal because liquidity is more limited than with T-bills. So if you just want to load up on 6-month maturities, you can buy all kinds of debt that matures in six months.
markets are optimist, it points to a softlanding with fed cutting agressively whatever the inflation picture. It was already in rates curves procès before the fed.
When you dismiss a part of the recession risk rates goes UP. Moreover Long term rates have a term premium with QT going and strong federal deficit.
Imo you should get the 10y back to 4% in a few weeks.
Timely. Good graphs. Thanks Wolf.
The math of the debt, is still relevant. Sure 3.5%, (assuming 2yr) is a deacceleration to the debt wall vs 5%. But 3.5% is up from the near zero % before. And new debt is accumulating. So, but oiling the engine on the titanic? I still don’t see but two alternatives. Is there a third?
And for return, sure 3.5% is better than ZIRP. But what happened to adding up inflation, taxes and a return component, to determine the risk free rate.
As it appears the government, Fed, and WallStreet are too busy with other plans, it appears it is up to the Treasury purchasers to say ‘enough already’, and lead the rates up. Or not it seems recently.
Personally, at these rates, I’m not interested.
The last time we had any budget restraint was with a Republican Congress and a Democratic President — Bill Clinton. That may be the outcome again. If Trump wins, batten down your hatches. He promises more spending, and lower tax revenue. He is even now against his sole achievement, the SALT cap. And he isn’t going to significantly cut spending. He likes to spent other people’s money. If you are fiscally conservative but socially moderate, try splitting your ticket.
Are dictatorships inflationary?
Like I said before I see Trump getting 31 percent of the popular vote.
Probably worth a mention that the Fed didn’t halt QT, even though they nudged the short-term Fed Funds Rate down.
Long-term rates are a function of supply & demand for credit, and the continuation of QT impacts that balance by reducing demand and effectively increasing supply.
To the extent that this “split policy” (Fed Funds easing with QT) was not fully appreciated by the market, it could nudge the long rates up.
Good point. But how long will the Fed shrink their balance sheet (QT)? If the economy beings to contract, they’ll reverse direction; bond holders will be punished.
Does the lowering of the short term rates really make much of a difference if QT is underway? The common conception is that the lowering of the Fed Funds rate will stimulate borrowing, but if QT is draining money for the long term, by issuing bonds and letting bonds mature, that’s not likely to be the case.
Have I got this wrong?
Correction: …if the long term “begins” to contract…
Second correction: “If the economy begins to contract…”
Yep, the big question now is whether it is “monetary and credit aggregates” that drive the economy, or short-term interest rates?
In all historical Fed cycles, those two operated together since it was generally the money supply that was used to force rates to go where the Fed wanted them. When the Fed was tightening & loosening before, was it the rates doing the work or the credit supply? Hard to tell, economists have debated for decades.
But now the Fed just pays Interest on Reserves, so rates and money supply have gotten quite decoupled. Will pushing rates around have the same effect that it did before, if credit supply isn’t moving in the same direction?
Love the statement: “But this gets iffier for longer-term securities…”
That same sentiment was captured in an Almost Daily Grant’s article last week quoting Barry Bannister (Stifel):
_________
“It takes one generation to forget the dangers of a bubble, and it is Groundhog Day versus the 1990s Tech Bubble,” Stifel Nicolas chief equity strategist Barry Bannister wrote yesterday. “Just as countries that go rogue become almost un-investable, investors caught in the grips of a speculative fever become almost unanalyzable.” —ADG, Sept. 20, 2024
________
Generational memory is a force of nature.
Again with this bubble nonsense. If you were alive at the time of the Spinning Jenny you’d be screeching “bUbBlE!” at that time too.
The dotcom boom were superfluous internet companies taking advantage of the post-Soviet unipolar emergence.
Things are different now. Wake up and smell the silicon, grandpa.
I have no sense of smell — lost it a decade ago.
If price bubbles have been eradicated, somebody forgot to route the memo to the downtown office building owners…
Maybe the carbon paper got jammed up in the typewriter.
So nice to get extra money.
I’m watching my treasury returns, doing the limbo…lower and lower.
Don’t think the 4-8 week treasury bill will go back to Zero like it was 3 years ago but what’s stopping it?
I think I put my comment in the wrong place, I’ll double check.
Yup…wrong place.
I was also concerned for the beachdude, that shark attack was awful.
…sidebar to John H. – early loss of olfactory sense has been found to be a possible indicator of Parkinson’s. Something to keep in mind (lost mine in my thirties, PD manifesting in my late sixties…). Luck to you.
may we all find a better day.
Much abliged, 91B20 1stCav (AUS).
Very kind of you. Will explore.
When the stock market and real estate shit the bed next year, we will have a recession. The wealth effect, that Bernanke pointed out, is real. The tail is wagging the dog.
1) CL is down since June 2022. In June 2022 US3M=1.3%,
DET 3M = 0.5%. US2Y = 3%, DET2Y = 1%. US10Y = 3,2% and the DET10 = 1.5%. DET is the German rate. CL is oil futures. In Q1 2022 Russia invaded Ukraine.
2) In Sept 2023 US3M = 5.4%, DET3M = 3.7%. US2Y=4.9%
DET2Y = 3%. US10Y = 4.4% and the DET10Y = 2.6%. Gravity pulled them together.
3) In Sept 20 2024 US3M = 4.67%, DET3M = 3.08%. US2Y = 3.6%, DET2Y = 2.25%. US10Y = 3.74%, DET10 = 2.22%.
4) If the FED will cut rates CL will rise, unless we the
stock markets correct sharply, or we enter a recession.
Thereafter CL will bolt. Negative rates will ease gov debt payments. The Dow will popup. Gen alpha and the Zoomers will thrive….
I wouldn’t mind seeing the ten year back over 5%. Obviously the 2% inflation target is just soothing talk and it’s going to be closer to 3-4% over the next decade due to debt and demand. Maybe the mortgage premium will narrow to 2% for a while even without Fed MBS QE. Housing is going to take a while to heal.
What did things look like in the late 90s? 5% bills, 6% ten years, 8% mortgages? That wasn’t so long ago.
The Fed is no different than a group of belligerent doctors who cannot let the body work on its own to recover.
America is paying the price and losing its economic dominance
So let unemployment go to say 20%?
House prices would be fixed for sure!
And we’d be begging for food.
I call the alpha spot at the oil barrel fire! 🔥
A bird was talking to me the other day, I don’t know what it was saying but it had a lot to say.
I think the bird was looking for a mate or it was warning me to stay away from its eggs. Could be it was just singing and chirping for the sake of it.
Weird comment considering America has the best economy in the world right now.
Different subject but you are correct,
I think anything resembling decent returns on safe investments are in the past. I know that of course risk is a huge piece of it all but being able to invest and feel like you can safely beat inflation and get something back. Perhaps expecting money to grow in this way is just an unrealistic expectation too. Probably not a huge deal for younger investors who can ride out some ups and downs of the market but tricky for those that can’t. Just way too much money out there, in too few hands, and with the US, despite its deficit issues, still the game in town. There will be pull backs where people take gains but that money will have to flow somewhere and most likely right back into new highs in the market.
real rates are higher now than they were in mid-2023 when the Fed hiked to 5.5%. It took a lot of rate hikes and a big drop in inflation to get real rates to be positive.
Have you seen the 80’s stock market?
I mean we could be repeating the 80’s. Could be!
Guys from the Rabo bank, said it best: If you cut 50 bp in a “good” economy, then when the FED cuts 75 bp, the economy must be booming.
I said it – they would find any scenario for a cut. If a frog broke its leg, they would cut and so they did. People just can’t allow a housing crash, so here we are.
Volcker at least had the balls, the US is now ruled by medusa folk, without a backbone.
1. Inflation has dropped a lot and is now far BELOW the Fed’s policy rates. See my chart of the real EFFR in my comment above.
2. Job creation has gone from hot to cold in a very short time, and that’s a real issue.
3. You can close your eyes to the facts and dream of Volcker.
“1. Inflation has dropped a lot and is now far BELOW the Fed’s policy rates. ”
Well goody goody. Even if this is true, which I doubt, the average saver is still getting squat. So the Fed doesn’t care about the saver. They care about Wall Street and the big money investors. They want to make sure they are made whole.
My credit union just dropped their 1 yr CD rates from 4.75% to 4.5%. After state & local taxes that’s a 3% rate of return. Take out inflation and you’re making zero. Bring back Volcker. We are now ruled by corporate criminals, Wall Street shills, and a corrupt Fed. You may want to add in a completely bought & paid for corrupt Congress and Executive branch for good measure. ENJOY.
The long run average (since 1945) real Fed funds rate is a bit under 2%, and it typically ranges between -1 and +3. Your CD rate is a touch under the Fed funds rate. If you had invested in nothing but CDs your whole life, you would have barely beat inflation, doubling your money only after about 40 years.
You were never meant to make a ton of money by parking money in CDs; just enough to make it worth your while to not hide it in your mattress.
Swamp Creature
1. “the average saver is still getting squat.”
Those who are getting squat, well, that’s their fault. There are lots of easy options out there: money market funds, CDs, high-yield savings accounts, T-bills, etc. And if people still keep their savings at a bank that pays them 0.5%, they cannot be helped. That’s not the Fed’s fault.
2. If you get 4.5% now, with overall inflation at 2.6%, and core inflation at 3.3%, you’re far better off than getting 5% with inflation at 5%-plus, how it was.
3. If you want a higher yield, you have to go beyond instruments with zero or near-zero credit risk. So try corporate bonds, for example, you’ll get a higher yield, and you take some credit risk. There are junk bonds out there that yield 20%+ (careful!!!).
4. Taxes apply to ALL income, including capital gains and wages. That’s how it is, death and taxes, the only certainties. CDs are no exception. And I don’t know why people keep bringing up taxes only in the context of CDs. If you have no income, you pay no income taxes.
Not first time we agree
I see, so banks like Wells Fargo can get 29% interest on credit cards, while us savers can get max 1% interest after inflation and taxes. And we are supposed to do cartwheels to celebrate the great return on our savings. BS.
Swamp Creature
Let’s put this in perspective: I have a Wells Fargo CD that pays over 5% (noncallable), and I have a Wells Fargo credit card that pays me 1.5% of each dollar spent with it, and I pay it off every month, so I don’t care what the theoretical interest rate would be if I didn’t pay it off. Wells Fargo is making money on my card off the swipe fees that merchants pay.
But clearly the 5%+ CDs are gone now, if you want to buy a new one. I checked the WF website. So go to the savings and CD rates page and scroll down all the way, past the 0% savings accounts… For my zip code, it offers a 4-month CD with 4.25% APY (or 4.51% “relationship APY”) and a 7-month CD with 4.0% APY (or 4.26% “relationship APY”).
Wolf,
I just renewed my $100K CD at 4.50% for 1 year at my local Credit Union.
Glad to hear that they still offer than kind of rate on a 1-year CD!
I also still have a Wells Fargo Visa card which I pay off every months so I never have to pay the 29% interest. I was just looking out for the poor people who don’t have the luxury of paying it off every month and have to pay the 29%.
Why any sensible person would dream of Volcker is beyond me. His regime was terrible for working people. I guess he appeals to rentiers and wannabe rentiers.
Here in Canada home speculators are anticipating that Canadian homes will return to double-digit yearly increases…yet they expect that the factories, stores and warehouses which have to pay more in property prices and rent will somewhat not increase their prices because of increased shelter costs.
On my radar:
A few weeks ago, 2 year auction:
1: “ The notes were awarded at 3.874%, below the pre-sale, or when-issue, rate of 3.880%, the 4.434% high seen in the prior auction.
The bid to cover ratio, a measure of demand for the auction fell to 2.68 from 2.81 seen in the prior auction.”
“If the bid-to-cover ratio is lower than usual, that suggests that that many investors expect the final auction yield to be lower than they’re willing to accept”
A ratio above 2.0 indicates a successful auction with aggressive bids.
2: “ What’s more, the median Fed official’s estimate has the policy rate down at 2.9% in just over two years, by the end of 2026. Recent Staff Economic Projections indicated the longer run fed funds rate, or neutral rate, would not be reached for at least three years.”
“Taking into account the new fed funds midpoint rate of 4.875% and policymakers’ new long-term forecast of 2.9%, it can reasonably be inferred that Fed policy is now restrictive by around 200 basis points.
Put another way, the fed funds rate won’t be considered neutral until it is reduced by another 200 basis points or so, which the Fed signaled it intends to do by the end of 2026.”
3. Relationship with Yen and Japanese dynamics:
“ Takaichi has also indicated that she will be rolling out policies that include aggressive fiscal spending financed by the sale of government bonds”
Apparently, this indicates Yen will remain stuck near current ranges.
5. It won’t be a shock if rates in general, from MBS to short term 3 month, remain in the Schrödinger’s cat state of ambiguity, with volatility — yet stable, as the world weighs risk and reward going into election uncertainty for next 4+ months. Hesitation will almost reinforce a stagflation environment, as people place labor mkts under microscopes and overly amplify sensitivity related to the Everything Bubble — pondering, valuations and future recalibration impacts from future revisions.
In theory, a recession crash seems unlikely, but a V-recovery or acceleration of earnings growth seems unlikely, and yields seem to be pricing in slower global growth.
The impacts from cumulative inflation probably don’t simply disappear, but as growth declines, there might be a weird balance — to wit, whatever flavor of recession that may be getting stirred up, is probably something we’ve never experienced — and perhaps an extension of post pandemic oddities. This era is definitely associated with seemingly broken models and bifurcated anomalies — and that messy imbalance probably spills into a recession that may not technically fall into normal dynamics.
That said, planning ahead, makes the casino bets a bit dicey!
While knocking down a 24 ouncer 9 am while wondering where went wrong, ventured over to the M2 chart for financial guidance. Even humble nsa can discern a cataclysmic change starting year 2020, unlike anything in the M2 record going back to 1959. Take a look for yourself.
M2 is a useless metric. If you cash in a $500K CD and buy three $100K CDs and leave $200k in your checking account, M2 jumps by $500k. M2 has other issues. No one who is serious uses M2. It’s an old metric that hasn’t been adapted to modern times.
If you want to know what actually is going on, you look at the Fed’s balance sheet, which is why we discuss it here so much.
https://wolfstreet.com/2024/09/05/fed-balance-sheet-qt-66-billion-in-august-1-85-trillion-from-peak-to-7-11-trillion-back-to-june-2020-another-qt-milestone/
There are two verticals on the chart. Raid #1 in Oct 2008 and raid #2
in Mar 2020. Fed assets might drop to $4T/$6T before moving up in
order to tame the long duration.
I would argue the Fed never raised rates high enough. Evidenced by the continued credit card spending and government spending. The Fed blinked once the irresponsible banks began to fail. The bond market will now show who’s boss. Cutting rates will have the opposite affect this time. Never has the Fed begun an easing cycle when gold is hitting record highs.
You can argue lots of things, that doesn’t make them true. The FED makes interest rate changes basses off of inflation and employment. Full stop. Things like credit card balances and government spending may be influenced by the FED, or they may indirectly influence the things the FED looks at, but they are not what drives FED rate decisions.
You remain disingenuous. The Fed has facilitated bad behavior (moral hazard) on a scale never before seen in the history of the planet. Dave is correct. The Fed member banks (Wall Street) have bought our representation (via K-street), it’s time to speak the truth.
Full FAITH and credit.
The Fed tracks 820,000 data sets. Mind boggling.
Spot on Dave, see my comment below; Gold is screaming;”the cost of money has never been more political! Risk be damned!”
Certain items are important to our national security. They will be produced in the US, protected by tariffs. Demand for highly skilled and semi skilled workers will rise. Only out of productivity we can grow prosperous. Gravity with the US will lift wages in China, India, Argentina, Mexico, Poland….Retired chinese will starve. When senior gen X (60Y/45Y) retire social security will issue less monthly checks, bc they are ten millions smaller than the boomers in size.
Do you really think 100% tariffs on Chinese goods are going to bring production of things like cheap plastic fans, and cheap toys, and cheap garments back to the U.S.? Or do you think it will just drive production to other countries like Vietnam where tariffs are only 20%?
Here is a clue, even at 20%, it is cheaper to produce many goods elsewhere due to the fact that workers in those countries will work 16 hour days for far less in wages than American workers will.
Tariffs only increase the price to American consumers.
Workers are exploited in most countries in that part of the world with low wages ($200 a month or so) by mostly foreign companies, however most in manufacturing work 48 hour weeks (6 8 hour days), with a small percentage working longer. In that part of the world that is pretty much the standard. When you pay $200 a month you don’t have to work 16 hours days and unions are more common now in the countries I lived in over there. They only have so much power as a company can quite easily pick up garment manufacturing and seek out others to exploit for less money.
Agreed, disturbing example is new, simple and apparently high quality 12k Chinese electric cars. Current and either new administration will tariff 100%. Why? Protect the Big 3, who were bullied into making these vehicles by the current administration. Stop the EPA insanity that also causes these manufacturers to use turbo engines and CVT transmissions where the beneficial efficiency is offset by the massive cost of more frequent repairs to hard-working Americans.
The EPA is estimated to have increase U S lifespan by 15% from just the Clean Air Act. Of course that would be disputed by the oligarchs.
It’s interesting to see how much smaller most cars are in Europe. If Americans could find some other ways to satisfy their egos, and drive smaller, lighter-weighted cars, the EPA wouldn’t be blamed for the contortion that auto makers go through to reduce emissions while building ginormous vehicles.
HowNow,
The problem with small cars is you can easily run over people. Get a big truck, add a lift kit and you can literally drive over the tops of small children. Safety must come first.
HowNow – different market needs. The US is over 2x the size of Europe with area of much less population density. Many Europeans would also choose bigger cars if they had the space for them.
That is fine if the production moves to other countries. The Chinese government subsidizes many key industries they want to grow and take market share and put competitors out of business. This is not capitalism. You have to place tariffs on governments that do this to compete. Sure, maybe some of that manufacturing goes to other counties but it goes to the ones playing by fare trade rules.
I would disagree with the fools statement simply because the there are many people that only if this or that person was in charge things would be different rather then the material conditions that brought about where we are today.
That said, people and entities hopefully dont pile into long term bills as rates go down given any raise up in inflation and rate increases hurts them badly. Short term does have the benefit of major shocks on the market to have money to get back in. I know when COVID hit I invested in SPY recognizing that it would pass, albeit slower than anyone expected.
“Trying to explain why something is happening in the financial markets is somewhat of an iffy affair. But we’re going to outline a couple of factors that play a role.”
This is a great description/caveat.
I see far to many experts try and describe why markets do what they do and more often than not it just stuffs the market action into their already preconceived notions. They have a view and cherry pick market actions to fit that view.
You recognize that there are many views/factors that make up a market. That is rare among pundits and should be commended.
There were a preponderance of factors in the Fed decision to ignore its 2% inflation target, and cut anyway. I’m thinking interest payments as a percentage of tax revenue was one of the larger of those factors.
No way inflation is 2.5% … zero chance… my auto insurance just went up 25% without any accidents…
The CPI for auto insurance went up 50% since 2022. It’s included in CPI. DUH!!! But durable goods prices have plunged, gasoline prices have plunged, etc. Inflation is in services (such as insurance), while goods are in deflation, and so you get 2.6% overall price increases.
READ THIS to reduce your ignorance:
https://wolfstreet.com/2024/09/11/beneath-the-skin-of-cpi-inflation-core-cpi-again-accelerates-month-to-month-fueled-by-hot-core-services-cpi-durable-goods-prices-drop-further/
“Inflation can’t be 2.5% because this one expense that is probably 1% of my overall household budget during a year went up by more than 2.5%.”
Ok peter thomas.
“workers are still getting substantial pay increases”
Anecdotal evidence shows this to be the exception rather than the rule.
Perhaps a lucky few will be ale to carry the economy.
I rather think inflation on basic essentials is going to be one of the top determinants of the November election.
Let them eat cake.
“Anecdotal evidence” by definition is the exception. The data here is countrywide, not based on the two people you know who actually shared their actual pay increases with you, and did so with the correct math (most Americans cannot figure percentages).
There are three basic elements comprising long-term interest rates: (1) a “pure” rate; (2) a risk rate; (3) an inflation premium.
The pure rate presumably reflects the price required to induce lenders into parting with their money in a non-inflationary and risk-free situation.
The risk rate is measured by the yield curve in conjunction with the bond’s duration (counter-party credit quality, & repricing/liquidity, investment alternative, etc.).
The inflation premium is the expected interest rate differential added to compensate for the future rate-of-change in inflation.
The truth is that the inflation premium injected into long-term yields is not a constant function of the rate of inflation. The slope of real yields varies as a function of the supply and demand for loanable funds.
QE increases supply and reduces demand.
QT does the opposite.
And the gov’t is crowding out the private sector (reducing income and raising taxes).
There is nothing more political than the price of money, risk be damned. Gold is screaming this, for those who actually care to listen.
The bond market has been manipulated for quite some time now, so let’s all stop pretending that it is going to be an indicator of anything, because it isn’t.
Interesting times.
Hedge accordingly.
Alternate take on gold: it’s just overpriced like other assets.
I have a few gold bars sitting in my safe (silver too), but beyond that I’m not investing in anything that doesn’t pay out regular dividend or interest income.
In addition to the ideas above about a steepening of the curve…
My big fear is the long term rates gradually rise even more as more foreigners leave the Treasury market for gold, or other seemingly more attractive currencies. The targeted by country sanctions and asset seizures by Beltway and Brussels across the globe may undermine the dollar and Treasury value further… driving up Treasury rates.
i am growing exposure to the federal G fund which is pegged to the interest rate of the 5 year and longer Treasury rates with guarnteed principle. Otherwise, i loaded up on short term treasuries over the past two years and lately reinvested out to four years as they liquidate.
Anything to sleep at night.
Another great article Wolf. Seems the Fed is unsure as we all are, as in anything can happen. QT cuts and now a 50 pointer seems the treasury is involved for sure on the interest on the debt. I wonder how long this goes on and if eventually the Fed does a Paul Volker clean up and start all over again to protect the dollar. I heard it from you yourself inflation zigzags.
Just now sold DJT with a nice profit. Then will get the Trump crypto. He is such a winner I want to be part of this action.
I assume you’re joking here. Today you got a little over $12, a 52-week low and essentially all-time low since the SPAC merger was announced. You could have gotten $66 in March 2024 or $97 in March 2022
🤣
Yes, I put bracket sarc bracket on the bottom but it was eaten out.
What this guy is doing is a total scam (as usual), a loser, and not many hold him accountable. Today I read that >50% of white males support him.
And these guys are non-stop bitching that FEDs or ________ but totally are fine with their hero.
Wolf’s reply was business focused.
This site does an excellent job focusing on business, finance and money. Let’s keep it that way
@Gaston Yes, got it.
And we can argue about fine points of current economic data. But IMO these are secondary to the impact on the economy and geo politics (economy) compared to the elections goings. The reality will bite, no matter the correctness.
LOL! Most Trump supporters I have spoken to have no clue about The Fed or how banking and finance actually works.
There is a reason why BOTH “candidates” refuse to discuss actual issues like balancing the fucking budget. Our “representation” (at least at the federal level is fully owned by the international corporate machine. Local elections have never been more important.
@WB :) True, and well said. But enough for them to know “the government is evil”.
Good observation re the valley in the yield curve moving to shorter and shorter durations. Looks like it was at the 5y mark back in july, and iirc it was around the 7y mark at the start of the year.
I’ve been thinking the valley will move closer and closer until eventually short yields are properly the lowest. Lomg yields will rise, caused by the bond market pricing in re-emerging inflation.
The Fed under Powell has been more wrong than right in its decision making. The smart bet would be to assume Powell is wrong on this rate cut.
The Fed is trying to make decisions about the future based on current and past data (which is of questionable value anyway). The Fed is setting short-term rates pretending like it knows more than the market (this is pretty much the definition of what the Fed does).
Well, I make a lot of money from these kinds of inefficiencies, and rely on the Fed to keep making stupid decisions. So, Jerry Powell, keep up the bad work, stoke inflation, and be forced to raise rates again next year. Seems like this is what the bond market is seeing.
We really cannot expect anything intelligent coming from Komissar Powell and his Politburo-wannabes at the FOMC. After all, Powell is a political appointee, which is why he is so adamant about saying the Fed’s decisions are not influenced by politics (because in fact they are). He doth protest too much, the most amusing part of his Q&A sessions. He is not a bad liar, just not a very good one.