It nailed the top last November and it nailed the tops and bottoms going back at least to the 1990s.
By Wolf Richter for WOLF STREET.
Increases and decreases in leverage, when large enough, drive markets up or down. The only summary data on stock-market leverage that we can get is margin debt, reported monthly by FINRA, which obtains the data from its member brokers. There is a lot more leverage in the market, but we don’t get a summary figure of it. Margin debt is our stand-in for overall stock market leverage.
Margin debt data that was released last November, for the month of October, nailed the top in the stock market, as margin debt had nailed prior tops. More on that in a moment, including my annotated long-term chart. Now we’re looking for signs of a bottom. But as of the latest release of margin debt, we’re far from any bottom.
Margin debt fell by $24 billion in September from August, to $664 billion. But it is still very high, 39% above the March 2020 low. The drops in margin debt in January and February 2020 showed that there was already concern that Covid might be tearing up the markets, and some investors prepared by reducing their leverage. At the current level, margin debt has a lot more room to fall – and the process can take years as we’ll see in a moment – before it signals a bottom in the stock market.
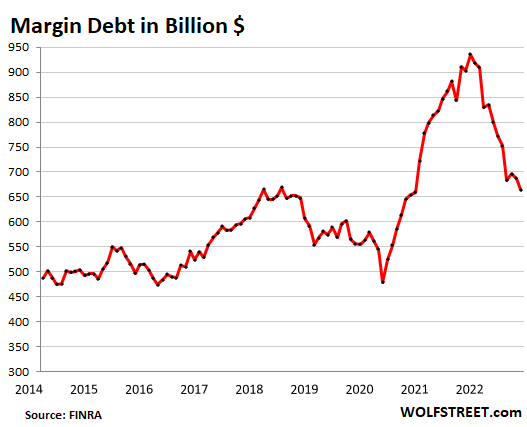
In the chart above, you can see that the summer rally was doomed to be just another bear-market rally because margin debt didn’t jump with it; it barely ticked up a little and then fizzled.
Leverage is a huge factor in the direction of any market. Leverage is the great accelerator on the way up, and on the way down. Big spikes in margin debt led invariably to stock market “events,” and a bottoming out of margin debt either preceded or closely followed the bottom of the sell-off.
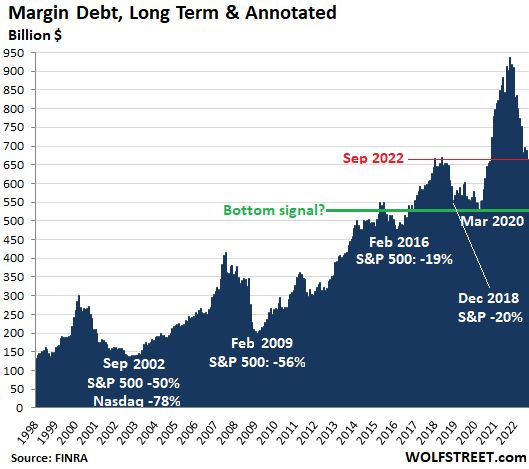
The bottom signal occurs when margin debt drops to the lows from a few years earlier and then starts rising again.
In the long-term view of margin debt, it’s not the absolute dollar amounts that matter, but the steep spikes in margin debt before the selloffs and the declines that start with the sell-off, and bottom out at the end of the sell-off.
The long-term chart below of margin debt also shows stock market events. Margin debt will need to fall somewhere near a prior low established several years before the spike in order to give a bottom signal.
The Dotcom Bust started in the middle of March 2000 (Nasdaq Composite hit 5,048), which was also the month when the spike in margin debt peaked. Margin debt bottomed in October 2002, having fallen to a level of 1998, after the Nasdaq Composite had plunged 78%. Then both began to rise again.
The Financial Crisis crash was preceded by a huge spike in margin debt to a peak in July 2007. Then margin debt fell. The Nasdaq started falling on November 1, 2007, from 2,859, plunging 55% to 1,268 by March 2009. Margin debt bottomed in February 2009, reported in March 2009. The stock market bottomed in March 2009.
As you can see, this process takes years – not months! Margin debt is not an indicator for day traders or short-term speculators that bet on daily ups and downs, but an indicator of longer-term trends.
Stock market leverage predicts stock-market moves in a somewhat indirect way: When the market starts a mundane regular little sell-off, high leverage triggers bouts of selling — usually of the most speculative stocks that shot up the most, and that then are the first to plunge — to pay down leverage to avoid margin calls, and it triggers bouts of forced selling as margin calls are going out. Leveraged investors have to sell stocks to pay down their margin debt, and this selling pushes down prices further, which triggers more forced selling, and more fears of forced selling, etc.
On the way up, increasing margin debt increases the buying pressure in the market, funded with borrowed money. And stock market bubbles need lots of leverage to get there.
Margin debt is the great accelerator on the way up, as buying stocks with borrowed money creates new buying pressure that drives up prices.
And in the reverse manner, margin debt is the great accelerator on the way down, as this borrowed money gets drawn out of the market by selling stocks, just when new money is reluctant to come into the market to buy those stocks at those prices, but is willing to buy those stocks at lower prices. And the money that margined investors drew out then vanishes into paying off the margin debt — instead of sitting on the “sidelines” somewhere.
Enjoy reading WOLF STREET and want to support it? You can donate. I appreciate it immensely. Click on the mug to find out how:

![]()
Didn’t know that. Makes sense. But it is an effect, not a cause.
Markets generally turn when money flows turn, the volume and velocity of money. And that is predictable.
Now I am curious to know when, given the current trend and velocity of margin debt reductions, that March 2020 line of potential support may be reached.
One more rally starting with renewed false expectation of Fed Pivot. It will sure pump speculation and hence inflation.
Ravaging inflation makes me wonder if Powell joined hands with Wallstreet to screw Incumbants in mid-terms.
Not just Wallstreet.
But I guess I am privileged to be around for the end of the Renaissance, the Age of Enlightenment, and the Age of Reason…..and of course a byproduct of them all, democracy.
When what Murdoch, Rush, Jones, Trump, et al, SELLS EASILY to the masses….it’s almost all over….I guess that makes me “woke”, along with all those people who led or participated in the above historical eras.
And don’t get me completely wrong. I chose to long ago be an overeducated Red Neck, which has made me anything but “Politically Correct”….and often wrong or ignorant. But I don’t have anything anymore to prove to anyone.
Look at previous bubbles and look at sp500 chart. Charts are more or less symmetrical up and down. So we have another 12-18 months left in the first phase down. Then (if Fed does not start printing by then) another 2-3 years of slow decline.
In high gain feedback loops cause and effect are hard to distinguish. Which sound exactly was causing the mike to instruct the amp to go to the max and the speaker to the limit?
Live mic feedback is typically a stage monitor positioning error, just sayin’….
It’s a spiral process, both a cause and an effect. Unforturnately not public data will tell you precisely when the market will top and bottom months or years before.
I doubt that anyone can predict anything at all “precisely”. The only piece of luck we on the bottom have is that the ultra rich still fight with each other, just like during the Gilded Age. It’s the only part of their sickness I like.
What is predictable? Example please.
“As you can see, this process takes years – not months!”
—————
The Fed has changed the speed of everything financial over the last few years, thus hard to look at the history of finance with any high confidence due to the Jeremy beast that lurks within the monetary shadows…
Basically a twist in Mike Tyson’s famous quote… “Everyone has a plan until they get JPOWed in the face”…been there, done that, learned to be emotionally and logically flexible when it comes to our financialization of everything era.
I got “BenPowed” during the last housing crash waiting for the P/E ratios to hit the historic average of 8-ish before the bounce….but it bounced 20% higher than “historic” so now I cost average in constantly to hedge my bets near historic and chart confluence zones. I’m not sure there is such a thing as educated guesses with monetary and fiscal elites playing God over the global economy…
It’s like playing real life Monopoly, but being aware that the Fed and even Congress can flip the table at any moment…
No, it hasn’t changed. (Fed/market speed.) the 1929-1931 charts moved as fast or faster as today’s, for instance. Or try 1987…
But yes, they can flip over the table, change the rules of the game, invalidate your best trade b/c the loser in the other side is a “systemic” risk, and basically do “whatever it takes” when you least expect it.
…why going short is harder than it looks…the brand-new flux of partygoers may soon learn.
Yort,
I checked a lot of formerly investment house hyped high flyers, and can’t find the “Earnings” part of the P/E ratio. All they report is “N/A” whatever that is.
Seems that a lot of them are finding a home on Wolf’s “Imploded stocks” list or are in line to join shortly.
Just an observer of the passing parade.
Program/algorithmic trading has changed the velocity and character of the market. This isn’t your Ma and Pa Kettle market anymore. Hasn’t been for many years.
You know as well as I do this is the promised soft landing, for wallstreet. They are serious about fighting inflation, .075% every two months. Now that is some historical rate hikes.
“Even the most circumspect friend of the market would concede that the volume of brokers’ loans—of loans collateraled by the securities purchased on margin—is a good index of the volume of speculation.” -John Kenneth Galbraith, The Great Crash 1929
I freely admit that I am not a speculator. Is speculation necessary? I ask this as a grandchild of a suicide after the 1929 crash. He was not a speculator, just an owner of a couple of grocery stores who lost everything as a result of no one having any money to buy food. An immigrant, he had already uprooted himself and his family for ‘American opportunity’ and could not take any more. I realize this comment is like farting in church, but, here we are again.
Fed’s Powell in 2012: “…I think we are actually at a point of encouraging risk-taking, and that should give us pause. Investors really do understand now that we will be there to prevent serious losses. It is not that it is easy for them to make money but that they have every incentive to take more risk, and they are doing so. Meanwhile, we look like we are blowing a fixed-income duration bubble right across the credit spectrum that will result in big losses when rates come up down the road. You can almost say that that is our strategy.”
This comment is really for you, Wolf, since I doubt it will see the light of day in your blog. I know you have a job to do, but, really, where does it stop?
> he had already uprooted himself and his family for ‘American opportunity’ and could not take any more.
This invited me to rethink the vaunted US opportunity so many have sought. Immigration was, and is (my financialized brain now interprets) in effect, entering a space of greater volatility, skewed more to the upside, and purchasing an option, a more “leveraged” set of outcomes than “the old country” presented. The option and risk are skewed toward the upside, but definitely have a potential downside. A trader generally heads toward the risks and volatility because they have opportunity, while this bears risk of crashing.
It sort of unifies my thinking about participating in an entrepreneurial and trading culture. Most start-ups fail. And back in those days, the landing was not so soft at all. Now we find ourselves with an opposite set of problems: government as insurance against everything, every mischance, via (ill-financed) printing. This is stagflationary to the core.
Yikes. Yes, potential downside, maybe a little competition. Startups? A grocery store? I give up. You are delusional.
Although, I must clarify this. There were no PE funded grocery stores in the early 1900s that I know of. His was entirely self-funded. He was doing FINE with his little neighborhood stores. That is, until…no one had any freakin money.
And WHY did people have NO freakin money? Answer me that.
Not only NO freakin money–no money to buy FOOD
Portia,
The answer to why no one had any freakin’ money back in the 1930s and why the Great Depression lasted so long is….The Fed.
Members of the Fed back then (brilliant people that they have always been) actually believed that when a stock closed trading one day at $100 per share and opened trading the next day at $50 per share; the investors had taken $50 per share out of the market and that “excess cash” was now slushing around in the economy. As the markets fell, the Fed kept tightening up on the money supply and exacerbated the situation keeping the depression from being over within 18 months like the 1920/21 depression was.
In the 1930s we were on a gold-based system. We could not just “print money” like we can now.
We could borrow, but in the midst of a depression, who would lend? Ideally the Fed could, but back then it chose not to. The USG sat on its hands waiting for the economy to restart itself.
So the gold and silver-based money retreated into fewer and fewer hands as the economy slowly starved to death.
The end of the depression began with extraordinary measures introduced in 1933 and it was definitively ended by the start of WW II.
That’s basically the gist of it.
No money because thousands of banks went bankrupt. And with no FDIC insurance people lost all their money. Very few people actually invested in stock market back then, contrary to popular belief.
Replying to Motorcycle Guy above (no more “Reply” indents left):
One hears that same fallacy a lot today — that every sale puts cash on the sidelines, ready to come back in. But, in particular as we are commenting on margin loans, I note that when a sale zeros out a margin loan, the money created by the margin loan winks out of existence, and can be re-created only if another margin loan of equal value is initiated. Since margin loans cannot be initiated for more than 50% of the stock purchase price, in a declining market the amount of money theoretically available on the sidelines for stock purchase steadily declines.
Motorcycle guy ,this looks like current situation.not pretty
Thanks, Flea. That’s what I was trying to spit out.
I can see where you are coming from, but go start a restaurant. Let me know how that goes after a year.
Or go start any business.
The key is choosing the right investment/speculation where there is downside protection. In Canada the past 10 years, the government has looked the other way, no checking of reported income on mortgage applications, and many new immigrants have made a lot of money on real estate. Starting a traditional business is a much riskier move than rolling the dice with real estate, and even if you are insolvent, many will walk away and never pay for the underwater real estate assets.
The Fed put has been a significant moral hazard, and many perceive that it will continue.
My sympathies to you for your grandfather. He was courageous to come to a foreign land seeking freedom and/or opportunity.
He was also very gutsy & tough to not only work hard but to start a business. No doubt that he spend long hours of hard work to make it work.
It is unimaginable how hard it was for him to apparently lose it all. But he did impacted your life and that of your family.
May God hold him in peace and may He bless you and yours.
Thank you, Sandy toes. I learned from his experience not to trust the financial system and to keep my eye on things beyond my control so I don’t get caught in the collateral damage. It is getting so now though that the sentiment of the Fed is openly that collateral damage is necessary to ‘stabilize.’ I wonder how inflicting pain on people not involved in the casino became part of their equation.
But in fact his grandfather must have been leveraged in some manner — people still bought food, just less, or less expensive. Perhaps he had a mortgage on the store, couldn’t get enough margin on sales to make the payment, and of course couldn’t sell the store except at a loss, and it went to the bank. Or he had a lease he could no longer afford and couldn’t get out of.
If he’d owned the store fee and clear he’ probably have made it through.
But few businesses can be founded with so much capital as to own their real estate free and clear. or earn enough to become completely debt-free, and in a deflationary environment normal debt levels can be fatal.
jim,
Like most retailers, he probably leased the stores. That would be my guess. Then there are payroll, taxes, suppliers, and other obligations you gotta pay. Also, retailers have a lot of working capital requirements to fund the inventory, etc. When you run out of working capital, you cannot buy the inventory, and you’re done. From Portia’s description, that’s what might have happened. Maybe he had a line of credit for this working capital, secured by inventory where $100 in inventory secures $50 in credit line (typical). Now he’s even more exposed. Maybe the bank pulled or refused to renew the line of credit when things were going wrong. You end up owing everyone, including your own employees who worked but suddenly didn’t get paid and have nothing to eat because you ran out of money. It’s a terrible situation. Brick-and-mortar retail is a treacherous business.
>It is not that it is easy for them to make money but that they have every incentive to take more risk, and they are doing so.
One thing that always interests me is the way we managed forest fires.
Previous attempts at “let nothing burn” resulted in a MASSIVE pile up of dead trees and other fuel in the mountains.
Removal of consequences does not remove risk. Instead, risk grows in the absence of consequences.
Is the option’s expiration what’s driving up stocks today?
I am wondering that too.
If you looked at the “max pain” calculation for the op ex today, it was actually higher than where we ended for many of the major indicies — i.e. the (most cynically calculated) upward op ex pressure was both large and very high above where the market started today, and it still couldn’t bring the indicies to the “target” max pain point despite the impressive job of levitation it did manage today.
Beginner here. Where can I learn more about this “max pain” thing?
Here you go: https://www.investopedia.com/terms/m/maxpain.asp
The TLDR; not cynical theory is that the act of options dealers hedging firces the market toward the max pain point.
The TLDR; cynical theory is that options dealers and their lackies take out as much leverage as they need to by or sell (including short) to push the market as far to the max pain point as possible, because that is where they have the least payout and screw the options traders on the other end of their deal the most.
Reality may be some mix of both.
IMO, yes. Supposedly 90% of options expire worthless and there has been a lot of put buying lately. Kind of shocking how many young people invest via options when its hard enough to get direction right, much less timing!
They are not using implied volatility and following the money then
That’s the fantastic thing about this market: nobody fucking knows?! It could just be some algos trading on a single specific technical spec they’ve been trained to focus on.
You have an excellent article about the handwringing on Wall Street / financial media about “liquidity” in the Treasury market.
Do you think a downgrade in bonds / collateral could lead to further margin calls?
Selling pressure could intensify if so.
Sorry, there was a whisper of a Fed mini pivot today…
It’s the bottom for sure…this time!
Per MarketWatch – Fed’s Daly wants to start talking about ‘step down’ in super-sized pace of interest-rate hikes
——————————–
Exactly 2banana!
Fed mouthpieces fart and the markets sniff pivot potpourri….HA
Thus beware of our monetary Monopoly board flippers, as sure they stink, yet are unfortunately financial Gods for the moment.
My fear is once “they” lose their financial omnipotence, as that’s when I cash out my monopoly money and make sure I own more “real things” versus “paper things”…
This is starting to sound reminiscent of the “trade talks are going well” nonsense from Trump’s time in office…
Somebody, anybody, whispers “pivot” and it starts traveling through social media and the financial news, and all of a sudden the DOW goes parabolic almost 1,000 points and 2.5%. Yeah, that’s normal.
This just shows the grotesque amount of money still sloshing around out there, and the need for larger rate hikes than 75 basis points. The market has clearly not gotten the FED’s message. Today confirms that.
Hi Wolf, thanks for this article. Two questions from a financial ignoramus:
1) Is this data in constant dollars? I don’t see it mentioned on the FINRA site.
2) Presumably interest rates impact the carrying costs of margin trades. So, would that have added fuel to the fire during the near-ZIRP years?
donkey,
“1) Is this data in constant dollars? I don’t see it mentioned on the FINRA site.”
In the article, it says IMPORTANTLY:
“In the long-term view of margin debt, it’s not the absolute dollar amounts that matter, but the steep spikes in margin debt before the selloffs and the declines that start with the sell-off, and bottom out at the end of the sell-off.”
Back in November, when margin debt warned about the impending sell-off that we then promptly got, people were posting the same nonsense into the comments: put the charts on a log scale; adjust it for inflation; adjust it for S&P 500 gains, etc., etc., and just like you, they wanted me to ADJUST AWAY the warning so that there would be no warning, and so that the game could go on, but the warning was correct, and since then the Nasdaq plunged by 33%.
Wolf, I saw that and understand your point. My questions were not intended to mitigate your analysis, quite the opposite. I was thinking that the future bottom may be quite a bit lower than a naïve glance at the chart would suggest.
I only found your site a few months ago. I’ve gone back and read many articles and comments but had not seen the November article that you referenced, hence today’s post is a revelation to me. Thanks for the reply and keep up the good work.
BTW, I’m not finding much data on historical margin interest rates. But I found an announcement from Robinhood lowering their rate from 5% to 2.5% in late December 2020. It’s at 9.75% now. Canary cat coalmine something something?
The way I think of this is how are you planning to spend the US dollars. For example, if you saved $25k to buy a truck in 2019 but didn’t, your “truck money” is now worth less because a truck say costs $50k now. But say you saved $100k cash/debt at the beginning of the year to invest but chose not to. Your money may lose 8% due to inflation but it’s better than 33% lost or more (if you planned on meme stocks).
Great insight Wolf.
May be I misunderstand but is there a way to further link a likely future percentage decrease in the main Markets from that information ? (Rather than a rough time window for a bottom?)
Thank you
The original Marco,
Study technical analysis and pay particular attention to Fiboacci numbers or sequence.
It would be interesting to know how margin debt unwound during other stock sell-offs (’87, ’73-’74, others). Too bad the data doesn’t go back that far. The 2020 crash is a potentially misleading event because the Fed stepped in immediately and rained mountains of money upon the chosen. So the graph really only shows 2 well-defined events (dot com & GFC). Even the GFC could be thought of as tainted by government involvement. For events that occur maybe a decade or so apart, this is a low resolution dataset. One could say that that margin debt is normally cut about in half, in which case we have a long way to go. Or one could say that margin debt returns to rest a little bit above the previous crash’s bottom, in which case we don’t have much longer to go. One event was about 3 years peak to trough, the other was about 2, and we’re getting close to a year into this current fiasco. Then there’s always the question of, “How is the government going to step in, and by what magnitude this time?”
The long term graph is an excellent indicator to confirm that we’ve entered a period of unwinding margin debt, but I’m not convinced that it’s a very good gauge to to predict whether this is going to continue for years, or will bottom out in 6 months, or 3 months, or within any specific timeframe.
Margin debt doesn’t predict how many months/years the sell-off will continue. The margin-debt decline is slowing down, after the plunge, and can continue for a couple of years at a slower decline speed. It should indicate (not predict) when the long downtrend reverses into an uptrend. When we get there to this month X, it should say something like this: “around here somewhere must be the bottom.”
This will be a recurring theme here, every now and then, so there will be plenty of discussion on it.
Hey Wolf,
Do you think it is safe to say that rates will have to start coming down for a handful of months (6+?) before margin debt starts to rise again? Thanks.
I don’t think that’s “safe to say.” But it’s possible. We’re going to have fairly high interest rates maybe for years. So this will be very interesting how this turns out. I’m going to use margin debt as one of the many data points to see if the bottom can be pinned down without the Fed throwing a lot of QE at the market.
If the Fed suddenly throws lots of QE at the market, that’s kind of the bottom, maybe not right away, but within 1-3 months, no matter where anything else is. They could do that if we get another big financial crisis. But that seems unlikely. More likely is a long battle with inflation and higher rates for longer.
Wolf how would margin work ,if we back on a gold standard
Flea,
Same. Margin debt has existed for about as long as stocks have existed which is a very long time. It’s in essence just a collateralized loan where stocks are the collateral instead of a building or a piece of equipment or inventory or accounts receivable.
The FRB intervening doesn’t have the result you imply. It’s a function of what people believe. That’s what makes it work.
The FRB cut rates in 2008 as the market crashed and only Lehman failed did their intervention work. The next time if market psychology moves against them, they will fail.
Look at Japan since 1989 and look at the UK with its recent bond rout. Two different situations but the same principle applies.
It’s not a mechanical process where central banks can magically stop the selling and keep the financial system solvent.
If the selling is big enough, there is nothing any central bank can do to prevent a systemic crash. They can close the markets and/or clean the mess up afterwards.
It looks like we have the potential for a bear market rally if we follow through on Monday.
Maybe. There was a big op ex today with a high “max pain” point to agressively drag up the market. While smaller op exs, the current “max pain” point in the options book is a tiny bit lower then where we are for the rest of the month.
Who knows though, the only thing we can count on currently are suprises and volatility.
It sounds like a potential reason for an emergency 200 basis point FED rate hike.
So margin debt is down about $300B or about 33%, but the S&P 500 is only down about 20%. I wouldn’t say this has created an “acceleration” situation just yet. Granted, I agree with the point Wolf is making, but I certainly think the worst is yet to come like most of us do.
I just hope the Fed’s QT creates a massive liquidity crisis early next year that causes the bottom to fall out.
One can hope.
“I just hope the Fed’s QT creates a massive liquidity crisis early next year that causes the bottom to fall out.”
I want the markets to crash but to a point only. I want it to be somewhat drawn out but expect a series of market panics over the life of this multi-decade bear market.
A true liquidity crisis (a “fat tail” catastrophic systemic failure) where central banks cannot restore confidence will have numerous consequences which most people don’t expect and aren’t prepared for either.
The first one being the potential freeze up of the payments system where no one has access to their financial accounts and can’t pay for anything except with cash or barter.
I’m not talking about Armageddon, AF, but 2-3 15% drops by mid next year would be a nice start. I would prefer that it happen somewhat quickly over the next 9 months.
NFCI/ANFCI are still showing Leverage at -0.09. At the height of the sloshing, around June 2021, it was -0.12.
When the other NFCI/ANFCI indicators go Positive (actual tightening), Leverage is usually -0.02 to -0.03, so yeah, I’d say the Fed still has a ways to go to deleverage the markets.
While the question mark provides a caveat, the annotated “Bottom signal?” doesn’t seem that far away.
This is what I was talking about above. Some will look at this chart, trace a curve through the lows, and think, “hey, we’re almost at the bottom.” In constant dollars, the left half of the graph would be higher (the curve gets flatter). Then, factor in today’s interest rate environment versus previous crises, and perhaps the bottom signal is a long way off. At most of the previous bottoms, the Federal Funds Rate was 1% or less, right?
donkey
While I wouldn’t question your motives, I personally feel that you might be at risk of being overly technical and I’m not clear what you hope to achieve from dissecting the chart.
Not on the basis of anything identified on this site, but I reject margin debt as a valuable indicator. It’s highly relevant but of limited practical use.
On the face if it, the trajectory to the “bottom?” seemed not that far off, so I flagged it for a possible clarification.
Have a good weekend.
The important second part is that margin debt MUST COME UP from the bottom to show there’s a bottom. If it just keeps going down, there’s not bottom. So you must have a big decline in margin debt that drags on for a long time, and then you MUST have a substantial enough of an increase. The low level and the increase combined should be the bottom signal.
Can capitalism succeed without “obscene” leverage?
Always the story: lever up, off we go, too far, now we…what, this time?
Bernie is always waiting. He’s old now, but there’s AOC.
You are assuming linear relation between margin and prices. They say prices are set at the margin. But that clearly implies non-linear movement of prices. Think of commodities prices turning negative at times as an example.
1) SPY closed under Oct 18 black crow high and Oct 18 black crow high failed to rise above June 30 close. Next week SPY might breach June 30 close.
2) SPY weekly is a failed DM #9. But SPY monthly DM #9 have a week to
go. It might close below June 30 close, testing/ closing Oct 13/14 open gap, beaching Oct 13 low, or fail.
3) Dia weekly is a failed DM #9. DIA daily breached Oct 18 black crow high,
closing above, but was stopped by dma50.
There is no close below Oct 18 low, but today DIA closed above Oct 18 high and above June 30 close.
4) We don’t know what might happen next week in the blue zone casino. Those 100Y Olde SOB might fool us again for fun and entertainment…
ME, can you place #4 as permanent #1. That would be helpful. Thanks.
Ever since you got your mapping software I’ve tended to focus more closely upon the overall trajectory of your charts rather than the short term ups and downs. And doing so here does point to a bottoming near your March 2020 date which also seems to indicate Bernanke’s inequitable – Nobel notwithstanding – ‘wealth effect’ theory did exactly what it was supposed to do. This is so even though most of your commentators – myself included – view the dropping market through a somewhat vengeful, ‘burn it all down’ lense of desire, thinking they somehow will not be singed by the flames as the economy enters a dark void of a much larger correction with no sense of bottom whatsoever, requiring a much greater drop than your trajectory suggests. Perhaps. But there is a lot more margin debt in dark money unknown to us which, along with a souring mood of the general consuming public, points to if not a greater pitch of descent then a much stronger accelerant than your chart presents. What I’m getting at: I don’t think a bottom of March 2020 will be enough to make housing affordable again in a manner some of us remember from the ’80s when Volcker forced a correction which ultimately produced a higher standard of living for my Boomer generation. I think we now want to see this happen, so as not to have to face the guilt in what remains of our Boomer indulgence in our waning days, thinking we have corrected much of the mess we are leaving to our kids with only a slight singeing we will secretly view as a sort of an age related down sizing. Yeah March of 2020 is not going to be enough. There is still too much money sloshing around without a clear spending path ahead, although our ‘climate repair’ schemes will certainly burn through a good bit. Soon the margin debt will agree.
Good post.
Yeah, thanks “Crazy” one. I’m a boomer with not a whole lot of guilt, except by association.
This is a very well-written and interesting blog. Good job. My question is where can we access this information on the internet? Wolf says it is “reported monthly by FINRA, which obtains the data from its member brokers….” Is there a link to the FINRA website and a particular date each month were they report the margin debt?
Google it?
LOL I have had to email that to some colleagues who spend more time online than I and yet cannot answer the simplest questions.
Google response is always depends upon the how ‘question is framed’. I had to query more than once with a different tilt/angle of the same question. Always watch out for confirmation bias.
Same applies to ‘polls on voting. and predictions changing by the day, if not hours in this information age. I always look at the question to asses the confirmation bias by the source of question
It’s no accident that Radiologists come from the very top of each graduating MD class.
I think Wolf’s bottom signal between $500B and $550B in margin debt is reasonable. You could probably slap an exponential curve on the margin debt troughs from 2003 onward and it would land somewhere near 550B and 600B for the upcoming trough, which is only slightly higher than Wolf’s green line of destiny. Q3 earnings from American Express and Bank of America reveal consumer spending remains stubbornly strong, which should motivate an aggressive fed. This should allow for at least one more down-leg in stocks (maybe 10% additional downside risk in equities from here?) before a face-ripping, sonic-boom inducing rally ensues.
Interest rate hikes really haven’t even affected the economy yet ,wait a year . SURPRISE
Why? You can get 5-year no-risk CD yielding 4.8%, but you will invest in 1% yielding stocks?
“consumer spending remains stubbornly strong, which should motivate an aggressive fed”
They conveniently ignore the awfully low savings rate and increase in revolving (CC) debt in the last qtr. Households having strong balance sheet is mythical as the Fed’s balance sheet.
I have a second comment. Wolf’s excellent chart of the ebb and flow of margin debt suggests since the year 2000 there have been ever higher margin debt bottoms. There is no reason to extrapolate from that chart that the low in margin debt must be at the same level as the last low, contrary to what Wolf suggests with his line he imposed on the chart. Indeed that record would suggest a higher likely margin debt at the bottom. That would suggest thinking about dollar averaging in now or sometime soon. You can’t time the bottom and the low only appears clear after the fact.
One other factor that might play into margin debt is the interest rate. I don’t invest on the margin so I don’t know the history of margin debt interest rates. But I would expect, like all interest rates except perhaps credit cards, they have been declining during the period of 2000 to 2021. This incentivizes investors to take on more margin debt. And with the 2022 interest rate rise, the reverse is perhaps true. The higher rate exacts an extra investment cost and reduces the incentive to borrow money and invest with leverage. That would accelerate the pay-off of margin debt. Perhaps that is part of what we are seeing in the recent data.
Margin debt reduction and increased carry costs (by rising interest/loan rates) is like a one-two punch. All those wannabe pikers who think they’re ballers are gonna find out real fast who is in charge… the banks!!
Adjusted for inflation, US margin debt in Oct 2022 looks pretty close to that March-2020 low.
Who cares about margin debt when your stocks increase dive by 50%
Every sector is different, there are great buys today if not living in fear
Scared money makes no money
No what your buying
Give us few examples of great buys today.
I bought couple of Intel calls. It will probably crash next week while market bounces.
SJT, PVL, AMLP, PHX, AVXL, XAIR, NEOG
I can keep going but do your own work
Another one who wants to “adjust away the problem.” Read my comment above in reply to Donkey.
Those Cd typos are not accidental.
I’m not smart but smart enough to grab yield that will pay above inflation for next couple years than u sell when the yield erodes or payout peaks.
There are many markets, it’s not just one. There was a stock market in 80s and 90s that made billionaires,
When rates were just as high and money was not warp circulating.
Cycles are just part of knowing where to hide or where to pounce
I was probably buying wolf’s abs paper while a dealer
Markets are not good to overthinkers. It all comes down to price
Wolf says the direction of the curve not adjusted is necessary so many variables for these. One question I have is margin debt a form of additional funds and a function of Fed Funds Rates? Or just the rise and fall of stocks ?
I would think rising stock prices help add dollars into the economy as folks use margin to help pay expenses as their stocks rise. The decline is year old slowing but no sign of flattening and this curve moves slowly
Rising asset prices do not add anything to the economy. It incentivizes people to spend and borrow. That’s the source of the “wealth effect” which doesn’t make the economy any wealthier at all because nothing was produced.
Whatever liquidity someone receives by selling an asset is entirely offset by the reduction to the person who bought it. It’s debit and credit accounting.
This is the same reason “cash on the sidelines” is a myth.
Margin debt is just more debt, lent to the customer by the broker dealer who lends out of cash reserves or borrows to fund it in the capital markets.
I think “cash on the sidelines” is actually truism in the sense that cash is always on the sidelines (bank, mattress, or the wallet). With exception of “check is in the mail” cash, which my broker stubbornly refuses to accept for margin call.
Off topic but related to the ups and downs? – It seems that stock buybacks amounted to $1 trillion in 2021 and 2022 may be higher. I haven’t found any charts from 2000 that go past 2018, but that one did show a peak in 2007 and the bottom in 2009. Maybe another useful measure alongside margin debt?
Those charts likely only confirmed peaks and troughs after the event.
The best advance look-up indicators to use in these times are the direction and velocity of market rates, the Fed’s Balance Sheet and Overnight Reverse Repurchase Agreements. QE is the source of all the asset froth and Reverse Repo balances are an official manifestation of monetary overflow (Bitcoin is a bit like a bootleggers version of the same) – see ORR between 2014-2017. The stock market started to wobble in Jan 2018, as did Bitcoin.
In terms of valuations, we are nowhere near the trough in stocks. Case study Tesla and the ongoing survival of loss-making companies that can’t match the terms of Treasuries, offered by a loss-making government.
In terms of time, I’m not sure but think that a major test is approaching as QT begins to assert its omnipotence. But everyone is looking at rates.
I agree that FINRA margin debt is a fantastic signal. Series has been around since 1959, although the name changed a few years back. Correlation with SPX ranges from 0.4 to 0.8. Its even tighter post 1998. If you chart SPX vs margin debt – especially since 2010 – by eyeball, they appear to be very closely aligned. My guess: there will be no low without a strong bounce in margin debt – which we definitely saw in 2020. Just “bad luck” the monthly series is released so infrequently and so late. I’m just betting Wall Street gets this signal in real time.
Does one cause the other? Correlation isn’t causation, as they like to say these days, but – the correlation is strong. Its a signal. Margin debt plunges, and the market falls. Margin debt rises, and the market rises. It is completely up to you if you want to pay attention to the signal. Or not. Free Will and all that.
Leverage + Options trading (aka “gambling on a hunch”) = the sure path to financial desaster.
Got gold ?
I do. Just bought couple of calls in gold ETF in my margin amount. Think it’s going to $5000. It’s like picking up money.
Gold does poorly when the US $ remains strong and in an increasing rate environment, now with further increase in rates.
I have bought puts on GLD for November & December a couple months ago. They are already in the money.
Sunny, I was joking of course. I perhaps would buy a couple of coins were gold to trade under $1300.
People still believe in the Fed put. But they don’t realize that perhaps the Fed put has now moved on to save the bond market instead, which means that they have to stop inflation rather than backstopping the stock market.
The stock market is largely irrelevant, because it doesn’t have to be re-financed. Also, corporations can issue stock instead of borrowing (which is the whole point of having a stock market!). At this point though, corporations are still doing stock buybacks! This is actually an indication that money is still too cheap.
There also still seems to be a general believe that a central bank can backstop government debt, while actually the opposite is true: ultimately, the money/ central bank is backed by the ability of government to tax and nothing else.
What happened in the UK last week illustrates this nicely. They are now forced to tighten their belt because the bond market wouldn’t accept the unfunded spending any more.
There is also a misguided believe that the USA is somehow exempt from this risk due to reserve currency status of the US$. But that reserve currency argument is overrated. Only about 25% of US government debt is held by foreigners, and they are not increasing their holdings. So these trillions of future deficits really have to be funded by Americans. You cannot stick it to the foreigners.
But but but… the Fed can buy it all, so it is free money?? No. Negative real rates are a raid on savings and pension funds. People have to understand that finance is ZERO SUM. There is always somebody paying. The only reason this approach is popular is because unlike taxation which is transparent, it obscures who is paying, so it can appear free money for a while. But never forget that this is a zero sum game.
In a global economy which is leveraged to the hilt ,bond markets are worried about bankruptcy and default.My opinion is that entire countries are going to default,England was first shot across the bow ,anyone want to name a country that is solvent?
Luxembourg
Very intersting. So to backstop bond market the Fed is crashing bond market? TLT (20+ year Treasuries fund) fell off a clif.
Also, if the Fed already has 2% target inflation, what to stop them from targeting 4% inflation for example?
If they want to limit yields on the long duration end of the curve, then they need to raise rates on the short end. This is why you typically see the yield curve inverting before a recession.
They can set a higher inflation target, but provided that they can actually control that (they can’t), it would then also raise yields and make debt less serviceable.
I have been saying this for years: while most people think that you can “inflate debt away” in a benign way, actually the opposite is true. The reason that a country like Japan has got away with such high debt is only because their inflation was so low. Only because of that, they were able to keep their interest rates so low and keep the debt serviceable. But now the game is up.
People have to understand that if inflation rises and as a result interest rates also rise (for example they double), then suddenly debt servicing costs double. Yes, the higher inflation hollows out the debt slowly, but the much higher cost of servicing the debt brings trouble IMMEDIATELY, as governments now have to cut spending or raise taxes to be able to finance it. The central bank cannot backstop it either when you already have runaway inflation, as doing that (=money printing) just adds more fuel to the inflationary fire. Therefore, this usually this ends in default or hyperinflation (which is the same thing, because creditors, i.e. pension funds etc, get stiffed and it results in not being able to borrow in your own currency anymore).
The UK bond market crash gave a nice preview last week how the dynamic works. Note that this is a G7 country and not some banana republic (although we are well on our way to become one). It should scare the sh!t out of everybody who lives in the developed world and still clings to Magic Money Tree hopes.
YuShan,
So what is one to do in such scenario(s)?
No sir. The ones who FIRST get to spend freshly issued trillions of currency buy trillions-worth of goods and services. The ones who exchanged their goods and services for said trillions, end up with LESS purchasing power (less than the trillions initially represented), possibly with NOTHING if hyperinflation ensues. So no. Fiat currency systems are not a zero-sum game. Those holding currencies instead of ‘goods and services’ may very well end up with NOTHING instead of the purchasing power they had traded their goods and services for. Where we had goods and services + purchasing power (work and profits represented by the presumed store of wealth currency) before, we end up only with one side of the equation entirely in the pockets of the buyer who basically swindled the seller.
The margin debt situation is even worse than it looks. In previous market corrections where margin debt came down, interest rates were going down too. Now they are going up!
I also think that we should be careful using the “recent” past (2020, 2008, 2000) as a guideline, because we are probably seeing the very beginning of a turn of a much longer cycle. The long multidecade trend in lower interest rates has probably ended. With it, I expect that the multidecade trend of ever higher P/E ratios has also ended, as has the relative power of central banks.
YuShan, you can probably write some articles for Wolfstreet. Just a thought.
I wonder about the components of margin debt too. A speculator who is shorting stock also does so in margin accounts, using borrowed money. So a spike in margin debt may represent bearish sentiment, and not a bullish outlook. And margin debt on the short side is even more precarious, given that the potential loss is theoretically infinity.
In late September, the put/call ratio reflected such extreme bearishness that it triggered BUY signals on trading desks. Options buyers are considered some of the dumbest money of all, which is why the put/call ratio is a pretty reliable negative indicator of future market moves. That said, are professional traders and market makers also bearish? If so, they would be shorting a lot of stock, and using margin accounts to do so, in which case — just as in up markets, increasing margin debt would be fueling downside moves.
Wrong. Retail options writers of long term out of money puts in the onset and during bear market are the dumbest money of all. These are the people who wake up with million dollars negative balance in their account. Buyers of those options made out like bandits, while risking relatively small sums. And no, you do need to borrow money to buy options.
VIX goes parabolic when writers can’t cover their contracts and buy it back at any price in panic. They are the ones that put up large sums of money for 1-2% return.
Actually, it’s you who is wrong. Long-term options OOM don’t move very much in price day-to-day. And if the trader has written puts to hedge a short position in the underlying, his balance would be up millions, not down, using your example, and would still be net short and be pocketing risk-free profits on the time premiums paid by the put buyer. And if he’s naked, he’ll just write some calls close to the money as expiry approaches, or buy some puts with almost no time premium.
Most retail investors who buy puts are bullish, and trying to hedge investment losses in down markets. And in a bear market, that’s the dumb money.
Sounds like you get your “experience” from reading Reddit comments.
Give me one example how you made money this year on such trades?
I bought and sold options that moved 25 times initial bet. I only managed to get 10 fold out of it over only few weeks. Amazon is specific example, but I have many.
There are no “long-term” options any more. Most options traded are D-1 or even D-0 options, playing the “Gamma game”.
The stock Market has officially benn turned Into a backroom casino.
As Wolf writes in this piece, margin debt is about the only stock market leverage that can be accurately measured. But there is a lot more speculation financed by debt going on.
How many people have both a mortgage and a stock portfolio? Using your money to buy stocks instead of paying off that mortgage is also debt fueled speculation. With mortgage rates going up and the stock market still overvalued and in a down trend, how many people will now choose to sell theirs stocks and pay off their mortgage instead? I think at this stage most people are still sitting on profits too, so it is psychologically easy to do.
Agree but just saying that if you are at 2% on a 30 and underwater on the house right now paying down the mortgage would be counterproductive.
Better to renovate the master bath and closet space to add value.
Of course. If you are paying only 2% on a 30 year mortgage, then hold on to that. We are not going to see that again in our lifetime.
I commented on this many times during boom times. How does it make sense to invest in 1%-yielding sp500 or Nasdaq while paying 4% mortgage with after-tax dollars. It all makes sense while stocks are going up.
if your using 1% yield in your calculations your truly a bit off in your investing acumen
Ok, so tell me about non-gaap P/E ratios wise one.
how much money did you lose this year?
I have no problem using options and inverse funds at this time. I do agree that the put/call ratios are a good indicator, up or down.
Between the Lines
“put/call ratios are a good indicator’
Not with ‘front running’ with the anticipation (real or not) of a Fed’s pause, pivot or some thing going to break b/c of Fed’s rate increase like UK
Look at short squeeze and the mkts spike, for the last couple days even though the PUT to CALL ratio is higher than ever in 2022 so far. Speculation fever and animal spirits are still strong along with hopium.
Hey Wolf this seems like pretty incredible data and top/bottom indicator. I searched the FINRA website but was unable to find this chart. Can you plesse share a link to their page? Thanks for all you do, you’ve helped me so much to understand the macro space.
These charts are MY charts. I built them from the raw data — like nearly all charts here. That’s part of what I do for a living. The charts are copyrighted, like all my content here. Wolf Street Corp owns the copyright. You can see this at the bottom over every page: “Copyright © 2011 – 2022 Wolf Street Corp. All Rights Reserved.” To build a chart like this, you go to the FINRA site and download the raw data and then build the chart. If your chart looks like my chart, I might sue you for copyright infringement.
To get the data, google it (super simple); and if you don’t know how to google something that simple, you don’t need the raw data either because you wouldn’t know what to do with it.
You already asked me the same question yesterday under a different login. Not good.
IMHO the margin debt should decline to level of Feb ’09 around 200 Billions, not straight way but zig-zag down in 2-3 yrs.
The macro economic factors are worse than in 2000 and 2008 including the global level of debt (over 200%) to GDP. USA D/G level is over 130% (conservatively) Deficit spending 1 trillion or more in the coming years. National debt have to keep on climbing now 31 T towards 40 T. Mkt cap to GDP is near 170%.
There will be a lot of bear(trap) whiplash rallies along the way(expected) in a secular mkt coming after 13 yrs of surreal bull mkt predominantly insanely created credit. The eruption of ugly inflation after 40 yrs of deflation won’t be that easy to contain in short period, especially now the inflation is sticky and broadly. The global economy including China is contracting. Europe is already in recession, will get worse with ongoing energy and currency crisis.
We are in uncharted waters.
Good summary.
SO, $550 is a baseline for a healthy market?
-Thanks
Hope you are right wolf! I have some QQQ puts expiring in December, I guess we’ll see what happens!
For small margin balances under $25,000, the cost of buying stock on margin is now over 11%. What the stock broker firms gave up via zero commission stock trades, they are now making up in high cost margin loans.
Another huge factor in the stock market is the price of oil. If Russian oil, which is 10% of the worlds total, is restricted, it is going to drive oil price much higher, and high oil prices are negative for the worldwide economy.