Few took the warning seriously that margin debt issued last year.
By Wolf Richter for WOLF STREET.
There is a huge amount of leverage out there, and most of it is hidden until it blows something up. The Fed encouraged leverage through interest rate repression and QE, and folks took that encouragement and piled into it. Some of this leverage is already blowing up with spectacular results, such as the leverage in the crypto world. In the stock market, leverage takes multiple forms. But only margin debt is reported and known, it’s the only visible part of stock market leverage – the tip of the iceberg. And it’s associated closely to “stock market events.”
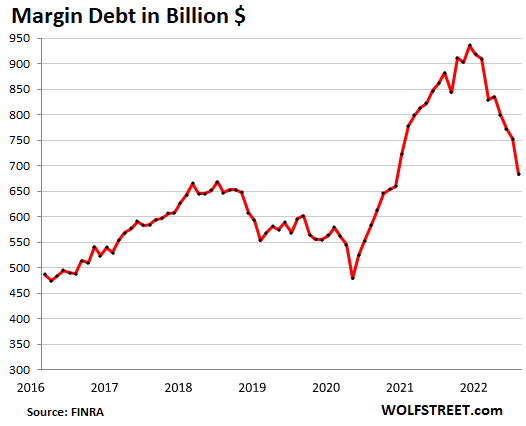
In June, margin debt plunged by $69 billion from May, the second-largest month-to-month plunge ever, behind only the $80 billion plunge in January, according to Finra, based on reports from its member brokers. In percentage terms, margin debt plunged by 9.2%. This type of percentage drop is invariably associated with the biggest stock-market sell-offs, as we’ll see in a moment.
At $683 billion in June, margin debt was down by $252 billion, or by 27.5%, from the peak in October 2021 ($936 billion). The Nasdaq peaked in mid-November and has since sold off by nearly 30%. The S&P 500 peaked at the beginning of January and has since sold off by nearly 20%.
This chart is an indicator of the gigantic levels of risk taken in 2020 and 2021 through ballooning leverage – with margin debt being just the visible tip of the iceberg. Starting in November, it became an indicator of the turmoil in the market. And now, it’s an indicator of a huge amount of leverage still left to unwind.
Financial market “events” and 9%+ drops in margin debt.
The month-to-month percentage-drops that had been nearly as big or bigger than June’s 9.2% plunge all occurred during financial market events, going backwards in time:
- Covid crash, March 2020, margin debt: -12.1%
- Euro Debt Crisis, August 2011, margin debt: -10.4%
- Financial Crisis crash, margin debt drops:
- August 2007: -13.0%
- October 2008: -19.7%
- November 2008: -18.1%
- May 2010: -9.1%
- Dotcom crash, margin debt drops:
- April 2000: -10.4%
- December 2000: -11.6%
- March 2001: -12.1%
- October 1987 crash…
The October 1987 crash... Just for fun. The margin debt data I have access to goes back to 1990. So it does not include margin debt levels in the run-up to the spectacular crash in October 1987, when the S&P 500 collapsed by 32% in 10 trading days, including the 20.5% plunge on October 19 (Black Monday). And there was a record amount of margin debt before the sell-off and a record amount of margin calls and forced selling during the crash that accelerated the crash.
That’s what leverage does: it drives up prices before, and it drives down prices during the sell-off. Leverage is the great accelerator, in both directions.
The numbers were minuscule compared to today’s Fed-encourage leverage binge and after 35 years of inflation. From the archives of Los Angeles Times, which is kind of cute today, I mean, 44 lousy billion…
“Margin debt at the end of September had ballooned to a record $44.17 billion, double the $22.47 billion at the end of 1984 and quadruple the $10.95 billion five years ago, according to the New York Stock Exchange. More than 2.8 million investors have margin accounts, with the average account size growing to more than $4,880, up from $1,415 in mid-1984, when the NYSE first started tracking them.”
The LA Times also reported in the same article about some of the side effects of leverage blowing up, and that’s not so funny anymore:
“On Monday [Black Monday], a distraught Miami investor – reportedly facing a margin call – shot and killed the branch manager of his brokerage office and critically injured his broker. The investor then killed himself.”
Brushing aside the margin debt signals.
Ballooning amounts of stock market leverage adds new fuel to the market. But vanishing amounts of leverage not only removes that fuel to be poured on the market but pours water on the fire, when investors get spooked and sell stocks to pay down their margin debt, and when margin calls go out and forced selling kicks in.
Margin debt, when it’s ballooning, can serve as an effective warning signal about risks and issues building up in the stock market. And when it starts to decline, as it did last November, it can ring the alarm bell.
No one ever takes this warning bell seriously, and it’s loudly pooh-poohed by stock-market hype mongers who want to put margin debt charts on a log scale or adjust it to inflation or whatever, or both, in order to conceal the issues and cover up the risks.
If anyone ever tells you to put a financial chart on a log scale, such as margin debt, to make it look less scary, run!
No one took the margin-debt alarm seriously late last year. Well, maybe some people did… Microsoft CEO Satya Nadella dumped 50% of his Microsoft shares on November 22, totaling $285 million, for an average price of $349.59. On Monday, Microsoft [MSFT] closed at $254.25, down 27% from his average sales price. He’d saved himself $80 million so far.
When a market gets whipped to ludicrous levels, it pays to get out. Hundreds of hype and hoopla stocks have by now collapsed by 70%, 80% and over 90%, and I have tracked some of them in my Imploded Stocks column.
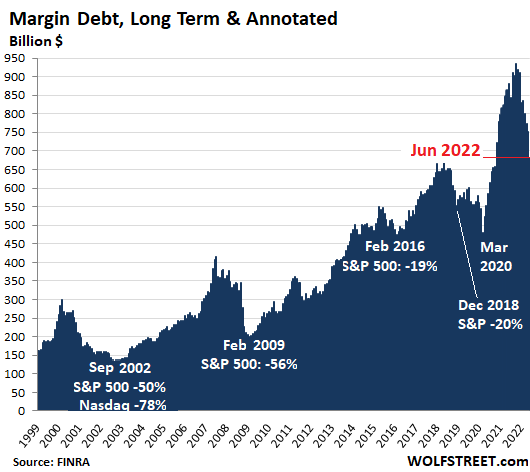
Margin debt annotated with stock market “events.”
In terms of the warning signal of margin debt, the absolute dollar amounts over the decades don’t matter. What matters are the steep increases in margin debt before the selloffs, and the steep declines during the sell-offs. The chart below shows the relationship between margin debt and “events” in the S&P 500 index, including the current “event.”
Enjoy reading WOLF STREET and want to support it? You can donate. I appreciate it immensely. Click on the mug to find out how:

![]()
So we’ve totally found the bottom. Right?
Far from it. In the dotcom crash and during the financial crisis, the bottom in margin debt hit levels last seen several YEARS earlier. Margin debt might have to break below the 2016 low.
I agree. Here at about 1pm on Tuesday, July 19, 2022 I am backing up the truck buying SQQQ ($49) and SRTY ($61.37). If the markets go higher, I will buy more!
I’ve been selling UVXY puts when I think the bear rallies are getting on their final legs. You can sell below the 52 week low (when taking premium into account) and still collect 5-6% a month. Close at 50% profit, or on the next gigantic VIX spike.
Damn, I wish inverse ETFs were available at brokerages in my country. Wanted to add gradually more and more of them, first as a differentiation, then as a must-have… Oh well.
I always pair them with the long variety! Too many whiplashes when the Hopium is very high!
How long do you intend to hold it, or at what price will you sell it?
At what point will you get out if the trade goes against you.
@ Harry Houndstooth –
what kind of price action do you expect, and over what duration?
Read the fine print. These are very dangerous products that are not designed for long term investors. They are designed for short-term speculation with money that you can hopefully afford to lose. So, hopefully your truck is not a big part of your investable assets. Notice that word “hope” again? Trying to time the market is a very dangerous game. In the long run, most people end up losing badly…
I was being mildly facetious. I came upon this site months ago and have enjoyed it very much. Thanks for replying to my very first comment!
That is why I keep emphasizing that value has TWO elements. 1) Solid fundamentals, a decent “moat”, good management, and a promising business model. 2) A decent price. Let me repeat. A decent price. For some reason, a lot of people ignore point #2.
When the market tanks, virtually everything gets pulled down. Even great “buys” and “value stocks” can get hammered. Maybe not as bad as the Nikolas get hammered, but hammered just the same.
We are in treacherous waters. Beware…
Wolf, maybe I missed it but I dont think so, any chance of an entry quantifying the QT to see how the balance sheet is progressing??
Looking forward to that TIA
Which bottom? From the November/January peak? Maybe
From the mania starting in the mid-90’s?
I don’t think so!!
Anyone else curious to see the August and September 2021 phone records of Satya Nadella, Robert Kaplan, and Eric Rosengren?
Wait, Satya has a phone? I thought they’ve shut down Windows Phone back in 2018 for good.
JK. I’ve actually used wonderful 930 up and through the 2019, and it still received incremental updates until full closure in 2020.
Also, yes, the records would be sweet, thank you.
Maybe Satya Nadella reads WolfStreet :)
Never going to happen
Way too many people keeping score in life by how much money they have.
That is due to the current American way. To paraphrase Oscar Wilde, ‘America is where the populace knows the price of everything, but the value of nothing’.
The real question is, do you have happiness and good health in the life you have lived so far? If so, you have won the game.
Just a comment that corresponds to the housing post.
Just an observation about consumers flush with cash. The cash is running out but homeowners, which are 64% of the families, have an average of $125k in home equity.
I have read different amounts but most say at least $28 trillion in home equity. Three states had an average increase of $100k just last year. (California, Hawaii, Washington, DC)
So sure, the housing bubble will pop in 2008, most houses had very little home equity as many homes were bought with 0% down, or interest only loans, and people where doing cash out refinancing almost every year and had little equity. Another trend was people taking out 2nd mortgages and actually had 110% LTV.
So even if the price of houses fall 10% or 20%, this will not spur people to sell IMHO. IF they lose there job, they can take a HELOC to help them get by?
I even know a couple that over bought a house 5 years ago and where house poor, They did all the fun stuff. They did forbearance during covid. When that was forced to end last fall, they filed bankruptcy, and they were finally sent a foreclosure notice. So what happened, they sold their house and walked away with $150k in cash from the appreciation of their house.
They are in their 30s and they have never had this much money. I am guessing they will go out and buy a new car, new cloths, and other stuff.
Summary: they just filed bankruptcy, house was foreclosed, and they are cash rich. LOL
Plus besides being cash rich, they were able to get rid of almost all their debt they accumulated from 2017 to 2021 by filing bankruptcy a few months before they sold their house and gained the $150k in profit.
So they lived large for 5 years, defaulted on debt. Now they get to live large for a little while longer. Only in America.
I hate it when people think they are banks.
I wonder what their plans are after the $150 K runs out?
There is a HUGE difference between 2008 and now. In 2009, the government stepped in with massive money printing and lowered interest rates. This put a net under the fall in home prices because it improved the affordability of the monthly payment at any given price.
This time around, we have a demand problem, due to the unaffordability of the homes at the current interest rates. That is a problem which has only one solution – lower prices for the homes (or lower interest rates).
There are still a few homes getting sold to suckers. That will end soon. As the first round of lowered comps start to hit the market and inventories pile up, the smartest potential sellers will lower their prices and be the first ones out the door. Because with each successive round of new comps that are lower, the negotiating power of buyers gets stronger. Why buy a home when the next set of comps will be 10% lower?
This is all psychology and cash flow. But many sellers still think they are living three months ago when mortgage rates were less than 3%. And there are still some buyers who think home prices will never fall. The rest of the year will totally change the psychology of the real estate markets. Just wait for those falling comps (and growing inventory) to do their trick.
Someone can always come up with a reason why it’s supposedly different this time.
It isn’t.
Well, it may be different this time, but not for the better. There could be a problem with availability of affordable natural resources comming up. Recovery from that can be difficult.
“The cash is running out but homeowners, which are 64% of the families, have an average of $125k in home equity.”
Yeah we used to get confused by that number a lot, until one of our financial seminars set us straight about what it means–and actual US homeownership is much lower than that 64% would suggest. It does not mean that young working couples are going out, earning and saving enough to buy their own homes, free and clear. It simply means that “someone living in the household is listed on the deed of the house”, and that plays crazy tricks with the numbers.
For ex. all the boomerang adults and kids returning to a childhood home because they can’t afford rent or to buy a home of their own? (Or even just saving up while the housing bubble unwinds) That increases the percentage because, even if 7 people are now boarding together in the home, the family “owns” the home, with no reflection of the financial stresses the family is under–even though ex. a grandfather bought it decades ago working a factory job on one salary without a high school degree. Multi-generation homes are a big thing in many cultures, ex. out in California, Arizona, Texas and Florida, I remember it was very common for Latino families to have many generations under one roof, it’s cultural but also a good way to deal with ridiculous home prices and housing bubble (esp all over southern California). It wasn’t unusual to have 1-2 dozen people on the property, some in ex. an attached home or shed in the back, but the stat above would just lump that in so that all 1-2 dozen people were part of “a homeowning family”.
A more accurate indication is given by the percentage of people in younger generations who are homeowners, ex. Millennials and Zoomers, and here the USA is actually on the lower end of the developed world. Don’t have a link offhand but saw the tables at the seminars and surprisingly, Millennials in most of the EU have a higher homeowning percentage rate, and it’s much higher in China (though of course it’s often a small condo or cottage, so those numbers of course don’t tell us the quality or desirability of the home either).
“ For ex. all the boomerang adults and kids returning to a childhood home because they can’t afford rent or to buy a home of their own”
I wish I could return to my childhood home…
But my Grandma blew it up…
True story…. :)
Miller,
My understanding is that the Census Bureau, which puts this housing data together, works off of addresses. And we’ve gotten a couple of Census surveys. An address gets the survey. The survey asks lots of questions, including something like, “does the household own this place, or does the household rent it.” This would produce a reasonably accurate account of renters v. homeowners. These housing surveys are huge, with something like 100,000 addresses across the US. But they’re largely focused on big urban areas and don’t include rural areas.
To me the USA is a strange land, world superpower, but they run a survey to find the number of homeowners.
Other places there is one governmental registry on who own all properties and another with the adress to all residens. Combined the regisries tell how many that own their homes and a lot more.
Sams,
Yes, we’re decentralized republic, and states vigorously defend their rights and try to keep the central government from encroaching on them. That’s just our thingy here. It can be inefficient, but we love it that way. Property transactions are recorded at the county level. Each state handles it differently. Same with vehicles. Here, we get a state driver’s license. So when I moved from Texas to Oklahoma and then to New York and then to Texas and then to California, each time, I had to get a new driver’s license from that state. And each time, you have to pass the written test because rules are somewhat different in different states (minor stuff usually). And you have to do it pretty soon after settling down in the state. Same with lots of things. And we cherish this decentralization.
Wow not very smart at some point will get a swift kick in the pants ,right to cardboard box under bridge
“IF they lose there job, they can take a HELOC to help them get by?“. -RU82
No. You need to have set up the HELOC or even a cash-out refi while you still had a job or other income source. I know a few people who own their homes free and clear & set up their HELOC in the way you asked as a potential “life catastrophe” reserve above and beyond savings. Setting up the HELOC costs money and an annual fee approx $100. They use it also as a form of title protection: it’s harder for someone to remotely sell your house or borrow against it without your knowledge because the HELOC creates a lienholder.
Serious question….is this a sign that the ‘smart’ money is getting out or something else? There seems to be so much money sloshing around it’s hard to tell what the smart money is doing…
Mr. Wolf, I am quite possibly the least savvy person you have reading this article. I’ve never been formally trained in any aspect of finance or investing. But even I know enough to READ and learn from history.
Here’s my (off color) take on why this keeps happening over and over again
Margin debt is indicative of the “everything” bubble that we are now working our way to unwinding. As shown by Wolf’s chart, it is still inordinately higher than anytime other than the later pandemic era. As it stands the market down draft to date has been rather orderly, with no capitulation or panic selling evident in the indexes and large cap stocks. But when the margin calls go out, historically that is when the bargains begin to materialize, unless of course you talking 1929….
The issue is how to capitalize on this end of cycle. I personally have some low ball limit orders to buy stuff I like, particularly closed end funds which tend to trade at wide discounts at the end of the market downturn. I am just preparing for possible panic selling, albeit neither expecting it nor requiring it come to pass.
For my own affairs, I am more comforted by cold cash or US Treasury money market funds than leveraged assets. Reduce your leverage now if you haven’t done so earlier. Winter is coming.
“The issue is how to capitalize on this end of cycle.”
Same thoughts here. We’ve been thinking and planning, but right now too nervous about catching a nasty falling knife. This unwinding of leverage really has an ominous element to it, the tip of the iceberg. Just seems like something’s that’s inevitably going to start feed on itself.
“For my own affairs, I am more comforted by cold cash or US Treasury money market funds than leveraged assets. Reduce your leverage now if you haven’t done so earlier. Winter is coming.”
Good advice, agreed.
Oil stocks turned out to be bargain in 2020 because the yields were high and balance sheets were strong enough to support it until cash flow recovered.
US stock market was nowhere. cheap in 2020. It was about “fairly valued” historically in March 2009. A similar decline to the GFC from the peak wouldn’t make stocks cheap now.
“I don’t do drugs. And I don’t have a pimp. This place is a dump. But it’s cheap, it’s clean and it’s all mine. I’ve saved 42 grand and it’s in T-Bills earnings interest.”
Investment advice from Ophelia
Margin Debt – another way the Wall Street Machine fuels speculative behavior and excess among the gamblers.
Yep, the margin debt along with the housing bubble has been one the most societally wrecking outcomes of the Fed’s reckless QE and ZIRP policy over the last decade (mostly over the last 40 years, really), distorting price discovery and sensible valuations lining up with incomes. And it was the margin debt bubble, in particular that brought on the Great Depression when it unwound with a vengeance in 1929.
How much is too much? Margin debt has increased and retreated from 1999 (the earliest point on the chart) on. When has it “ballooned”? Are there ratios to compare the margin debt to: total S & P 500 capitalization, total market cap of the NYSE, margin debt to p/e’s, other, to know that it’s going to blow a fuse? As it now looks, it doesn’t indicate it’s a bubble until the market pops and hard to use as a market top.
Comparing margin debt to market cap is the ultimate rationalization.
It’s using the reasoning that the bigger the mania inflates, the less of a problem margin debt becomes.
How does that make any sense?
How much is too much? It doesn’t matter, that’s not what the chart is meant to tell you. As Wolf explains in the article:
“In terms of the warning signal of margin debt, the absolute dollar amounts over the decades don’t matter. What matters are the steep increases in margin debt before the selloffs, and the steep declines during the sell-offs.”
I understand that. I was asking whether some indicator can be identified, using extreme margin debt, to recognize a market top. It doesn’t appear to have any as it just rises and falls, dramatically, but the big market drops are triggered by exogenous events. Margin debt rises but there doesn’t seem to be any correlation to anything consistent. Or is there something?
Virtually all public companies use leverage to improve results. Buying on margin is just leveraging up leverage. Stocks are already volatile enough without using additional leverage.
“There is a huge amount of leverage out there, and most of it is hidden until it blows something up.”
Everybody likes surprises. Unless they detonate. Then, not so much.
I think the leverage cycle will not be symmetrical on the way down. People make choices to leverage up, but on the way down the deleveraging can be forced on debtor. Fed has down the easy part in getting most to lever up, but the deleveraging will probably get out of their control.
An example will be the housing market. Now there are a lot people with 3% mortgages. What is the new state of the housing market going to be with 6% mortgage? A lot of people will be frozen in place til rates go back down.
This is a great point.
Taking it a step further: as a bank (sort of) the fed can really only put gasoline on the fire. Leverage at 3% or 6% is still leverage. That’s what banks sell at the end of the day. When they want to leverage up its easy enough to dump lots of gas on the fire and get an instant effect. People and companies refinance debt.
When the fire needs to burn out they can only add a lot less gas and wait for rain or the timber to all burn out. People and companies still sit on the debt they took – the deleveraging part happens when they are forced to sell. Not bc of the fed but bc of a squeeze from some external-to-the-fed event that happens who knows when.
Hence the asymmetry.
The more “permanent” this mania becomes, the bigger the ultimate financial calamity.
Exchanging posts with someone with an economics degree on another site and if his view is common, it’s no wonder current mainstream perception exists. Telling me there really is something for nothing in macroeconomics and credit levels don’t matter.
It’s incredible to find an actual person who believes such drivel.
Wolf,
Now if I can only get you to feel about “…to GDP” metrics the way you feel about log charts…
False equivalence. There is no accepted alternative to GDP. GDP is what we have as summary figure to track the economy, and that’s what we use as summary figure. If you don’t like looking at GDP, you’re in the wrong place, fine, then go look at cat videos.
I do think mr. Wolfe do a very good job at providing insight beyond GDP figues, an example is his Ford pick up and Toyota Camry price index. Other data sets he provide also give the reader the possibility to do their own judgements about the state of the economy.
Log graphs are controlling for a perpetual exponential increase in leverage. Imagine thinking that’s a law of the universe that needs to be taken out of graphs instead of an underlying assumption that we really need to question.
Basic math, the knowledge of exponential functions. All exponential growth goes to infinite. Compound interest is one of them.
Infinite growth crashes all physical systems as there is allways finite limits.
In any monetary system with interests the amount of money goes to infinite and the value of money zero.
We are seeing the rip-off-your-face rally I have been expecting for this Summer. I think it entirely possible the S&P 500 and Nasdaq make new highs in August.
Rip-your-face rally is past due. Not so sure about new highs. Nasdaq is oversold and may catch up to sp500 on 1-year chart. Perhaps another 8%. Will not last 3 weeks, if that.
You should definitely “go all in.”
God, no. Not touching this stock market at these levels. I might look for a short position sometime next month, though.
Still time to buy the dip!
Still time to *be* the dip…
Yancey Ward,
Out of the last 8 trading days, the S&P 500 finished higher on 2 days (including today) and finished lower on 6 days. We’re due for a summer rally, but so far, it’s been a pretty shitty summer rally.
In the summer of 2000, from May 27 through July 17, the Nasdaq rallied 33%, in the middle of what ultimately was a 78% collapse. Now THAT was a summer rally in a bear market! But it didn’t get anywhere near setting a new high in the summer of 2000. Far from it. The high was 5,000 in March 2000. On July 17, 2000, it got back to 4,275.
The Nasdaq didn’t set a new high until July 2015, 15 years later, and it took trillions of dollars of Fed money-printing to get there. Now the money-printing has stopped, and the Fed is doing QT. And CPI inflation is 9%, and the wage-price spiral has kicked off, and there is a chance that the Nasdaq is going to take a very long time to get back to 16,200.
5% up in 4 trading days. I meant to say this was the beginning, not the culmination.
Maximum pessimism is a trademark of a bottom. In fact, the bottom might be in, and S&P might meander back up and past the old high within a year.
No doubt you are correct in your pessimism, but you still may be too early, with one last rally left. Have we really hit our euphoric top yet?
You did see manic stocks are down 70-90%, right? Still waiting for euphoric top?
Yep. It’s crazy thinking to argue that stocks by rule should go up when they plunge. Sometimes they plunge for a darn good reason. The only reason stocks went so far beyond a reasonable P to E ratio is because of Fed interference, ZIRP and QE, Now the Fed is pinned down by inflation and the PPT can’t come to the rescue. So stocks have to find their true value based on what the companies are actually worth, bot based on some arbitrary measure of investor sentiment.
What maximum pessimism?
Certainly not in 2022 in US stocks.
Seriously, what do you expect to coincide with it?
The arrival of extraterrestrial aliens with a deus ex machina to solve all the world’s problems?
That would be nice, thanks.
My opinion only. For most people guessing where stock prices are going is a big waste of time. Much better trying to focus on longer term valuation metrics and decide if stocks are worth the risk over treasuries. If it’s a close call you can be 50/50 or some other allocation.
It isn’t maximum pessimism that marks the stock market bottom, it’s when the value of stocks reflects the actual value of companies, and when P to E ratios are back to making sense. How would anyone even measure “maximum pessimism”? That’s based on the hypothesis of efficient markets and the wishful thinking that investors have perfect knowledge at their disposal, and make purely rational investment decisions. You could argue that a bottom has reached when there’s maximum pessimism even when valuations are below a reasonable value for the companies, but we’re not anywhere close to that–equities, are valued way above what the companies in the exchanges can actually produce. It’s the same reason that we’re in a housing bubble based on the fact that homes cost way more than what Americans are making an income, not based on some sentiment indicator that’s arbitrary and wrong.
Easily not on spx rally. If sellers dry up and buyers want in does not take lots of cash for markets to climb on small volume.
As Wolf noted the increase in the margin during the runup is his risk on point.
Caution and watch for a reversal his is second point. There were indicators to watch.
And the curve has not reversed these things don’t go up or down in a straight line.
After speculators learned yesterday that earnings for Goldman-Sachs only plunged 47% for the second quarter, the rockets were lighted and it was up up and away for the Dow which has risen 705 points so far today with GS leading the way! Happy days are here again!!!
My question with margin debt is whether it is a leading indicator or a coincident indicator? Eyeballing it, margin debt looks coincident which limits it’s usefulness. Has anyone done the math to settle the question of leading vs coincident?
If you caught it in November, and reacted in December, you would have picked the top of the market. That’s every useful.
But margin debt is useless for day traders and dip buyers. It’s useful only if you have a longer-term view measured in years, not hours and days.
We sure are living in precedented times.
I am gruntled.
It takes a few years for the FIC to blow a bubble, and then more time to deflate it. We call this the ‘business cycle’. It’s been recognized for 200 years that they’re not inevitable but have to be engineered, and they’re very profitable, especially to insiders.
The good news is that if things go as expected this should be the last one.
That’s also the bad news.
No more so than usual.
Possibly the most fascinating series of installments on a financial perspective I’ve seen in my memory. Both factual and visceral.
Speak this truth Wolf. Thank you.
Interesting correlation but more explanation about how causation can be found using historical data would be helpful. We know that this type of margin is inherently correlated, because there are limits on how much margin you can take out based on price, as well as margin calls.
Takeaway may be that investors are, in the aggregate, terrible at predicting the future if they’re loading up on margin at the top and getting calls or fleeing margin towards the bottom, and margin investing for most is rather stupid. Margin is not free.
Nate,
I would pose that “investors” don’t need or use margin… they play the long game with secure money…
Gamblers, on the other hand, are looking to score and get out with a quick profit… and thus play a constant churn short game… thus a margin loan betting that the internet makes them smarter than the internet makes anybody else…
Kind of like Cramers stock picks, just for you….
It’s all a gamble, really. Notice how they only talk about the US for passive investing and don’t talk about Japan? Even holding cash is a bit of a gamble because it’s fiat money. FDIC insurance is all based on nominal values, just ask the Argentinians about how immediate access to money can be rather important. T-Bills depend on the debt ceiling increasing and Congress has flirted with idea of watching it all burn. Even gold, blessed gold, depends on scarcity and who knows, maybe Musk will figure out asteroid mining someday.
It’s the ability to evaluate the quality of the bet that matters. Margin players, in the aggregate, look like they’re rather bad at this, if their margin is spiking at the top and crashing down at the bottom.
Quality and value… and timing, as ridiculed an idea as “everyone” says it is. You can have quality and value and still lose your shirt.
FYI. You know when you go to a webpage and it now asks you to opt in or out of cookies. They usually get you just to hit okay and except all.
When I VPN into a Europe server and go to Forbes.com
The list of cookies I have to check yes or now. They are the following.
Mandatory: 1 = Forbes.com
Functional: 80
Advertising: 110
Purposes: 10
Special Purposes: 2
Features: 6
Special Features : 3
Anyway. Just over 200 cookies are downloaded when I go to Forbes.com
Wow… never knew the magnitude of that sh*t. “Remove all cookies” and kiss Forbes.com goodbye.
Example how some markets will see a bigger correction than others:
In April 2021, a household had to earn at least $79,600 a year to afford payments on the median priced home of $340,700. One year later, the income requirement stood at $107,600. According to the latest
American Community Survey data, this cost increase meant that roughly 4 million renter households earning between $79,600 and $107,600 that could have bought a median-priced home last year could no longer afford that home in April 2022.
In Fort Myers, for example, monthly payments
on the median-priced home surged by more than 77
percent over the year, to $2,996. This raised the annual
income needed to qualify for a mortgage from $65,400
to $116,000. As it is now, prospective buyers in 43 of the
top 100 metros must make more than $100,000 a year
to afford payments on a median-priced home. Indeed,
in high-cost San Francisco and San Jose, the minimum
income exceeds $400,000.
ru82: no I’m not. But thanks for that perspective on affordability! Add in the monthly cost of a new car, various and sundry fixed expenses, and you get: debt slave.
This margin debt bubble is slightly different than the others. This time the Fed told people, straight up, it would be handing out free money for s full year to the tune of over $100 billion a month. It is the first time ever it was so incredibly direct about what it was doing. That very clear statement pulled people in to cash in on the sure thing, so of course, this time, it was going to temporarily explode. This doesn’t pour water on the analysis, it’s just saying that the direct clarity of the Fed message truly did make this margin debt bubble unique.
I am seeing price cuts. Inventory in my area is increasing but it still 50% below the average.
That being said, here is what I think is different from 2008 but I do not know how it will play out.
From 1980 to 2012, there were always more single Family homes constructed than multifamily. Then 2012 to 2020, there were more multifamily units built than single family from what I can tell.
The following paragraph from the Harvard Joint Housing Study of 2022 illustrates what has happened in my area too. In my 20 years in this area, I have never seen so many apartments built and hardly any SF homes.
” With rental vacancy rates so low and demand so high, rental
housing construction is booming. In 2021, starts of multifamily units reached 474,000—the highest level since the mid-1980s and 24 percent above the average annual increases in 2015–2019. Of those units, 88 percent were in larger buildings with 20 or more apartments. In addition, fully 94 percent of all multifamily units started last year
(446,000 units) were intended for the rental market. The rapid pace of multifamily production continued in early 2022, with starts totaling 124,000 units in the first quarter. This was the highest first-quarter reading in any year since 1986″
Yes there have been a lot of housing units built to keep up with population growth but there has not been enough single family homes built for people who want a single family home. In addition, most new single family homes are above $500k and aimed not at 1st time buyers but upper middle class. Also, the past 2 years, 30% of houses priced in the lower 1/3 percentile have been bought by investors.
Thus, IMHO, there is a big shortage of houses below $350k. But there has been a huge boom this past year in the construction of new SF homes. Are these builders late to the party as usual?
“For the second year in a row, single-family starts were up by double digits in 2021, rising 13.8 percent to 1.13 million units (Figure 9). Until then, single-family production in the preceding 13 years had lagged below the 1.0 million unit annual rate averaged since 1980. Multifamily starts increased even faster, surging 21.8 percent from already high levels. In fact, more multifamily units were started in 2021 than in any year since 1987. Multifamily construction has now topped 350,000 units for eight straight years, after hitting that mark only twice in the previous quarter century”
Also, talk about crazy…
Investors have focused primarily on markets in the South and West. In the fourth quarter of 2021, the highest investor share of home sales was posted in Atlanta (41 percent), followed closely by San Jose (38 percent),
Phoenix (36 percent), and Las Vegas (36 percent).
Are these mom and pop or Wall Street investors. Mom and Pops will probably panic and sell in a downturn. Wall Street will not. They sold the mortgages into MBS which was sold to yield chasers.
I’m not convinced the 2009 secular bull market is over yet. Speculation is still rampant, and “buy the dip” mentality is still entrenched. Just look at today’s price action. The S&P 500 is no longer in bear territory, and the Dow never entered a bear to begin with.
Are we in recession :
1) US 10Y – US 2Y inverted @(-)0.22.
2) US 10Y – US 2Y weekly : Last week was the first close under Mar 28 2022
close, a setup bar. July 5 opened under Sept 9 2019 low, a lower low.
3) This week low exceeded last week close, a trigger.
4) July 5 2022 low and open @(-)0.30 : panic.
5) Max fear of recession during July 4 three days weekend : June 27 2022 close and July 5 open, opened the biggest gap on the chart, between : +0.040 and minus (-)0.30. // Options :
6) Option #1 : A trading range between Apr 1 and Apr 14 : (-)0.12 and +0.36.
7) Option #2 : 3of 3, it might get much worse.
I know you said to run from people suggesting putting it on a log chart, but isn’t that helpful for seeing the scale of things compared go prior events? I.e. this isn’y as big as the great finacial crisis (yet) but it looks bigger on the linear margin debt graph. On the log graph we sbould better be able to compare their scale of effect right?
I mean I can see why always or onlu looking at log graphs would be misleading, but they can be useful for historical comparison for relative scale of effect.
Yet the market zooms up. That S&P 500 Mini Future 9/22 graph yesterday looked…managed.
Leverage that serves speculation, like stock buybacks, is a form of market manipulation and should be prohibited.
The hyperrich grifter class likes it, so it stays. The general population can pay for the externalities as they arise, because that’s what it’s for.
Also of interest is the rise in the interest rates charged on margin loans, which naturally rise along with the rise in short-term treasury bill rates. Schwab is now charging nearly 10% for small accounts, and more than 8% even for $250,000-$499,999.
This is, IIRC, several percentage points higher than just a few months ago.
When it seemed stocks could only go up 20+% per year, it made perfect sense for the well-to-do and wealthy people who own most of the stocks to borrow against their stockholdings for spending, instead of selling stock, because a sale would force them to pay tax on the gains. As stock prices continue to fall that will no longer be true.
Note that when someone closes out a margined position the amount of the margin loan does not become “cash on the sidelines”. It winks out of existence, though it potentially can be brought back into existence by someone taking out a new margin loan. But because new margin loans are limited to 50% of the stock price, as stock prices fall the amounts that can be brought back into existence also fall.