Prices skid in the San Francisco Bay Area, Seattle, and New York. Other markets lose steam. A few power on. Crushed markets scramble to new (low) highs.
By Wolf Richter for WOLF STREET.
“The boom and bust patterns of home price growth in the West appear to be now solidly on the bust side,” said Ralph McLaughlin, deputy chief economist for CoreLogic, in a statement about today’s release of the firm’s Case-Shiller Home Price Index. So here we go.
San Francisco Bay Area House Prices
House prices in the five-county San Francisco Bay Area – the counties of San Francisco, San Mateo (northern part of Silicon Valley), Alameda and Contra Costa (East Bay), and Marin (North Bay) – fell 0.6% in September from August and were down 0.7% from the same month a year ago, according to the S&P CoreLogic Case-Shiller Home Price Index today. The index is now back where it had first been in May 2018:
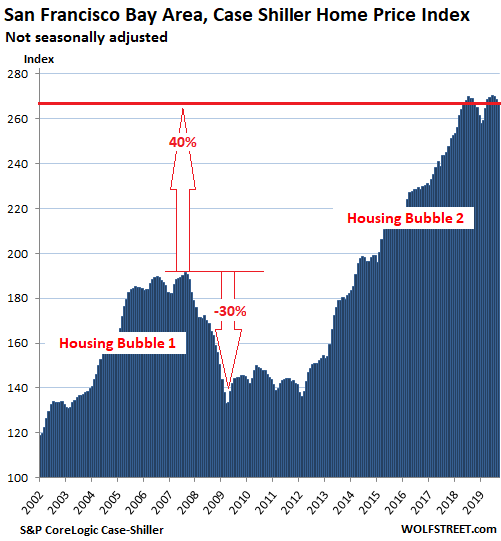
This is a veritable debacle for the news media, which, in cahoots with the real-estate industry, had endlessly hyped the assertion that the flood of IPO startup millionaires would inflate the Bay Area housing market even further in 2019 and going forward, which I pooh-poohed with gusto earlier this year. So where are those IPO millionaires? Well, they’ve been millionaires before the IPOs and already bought homes in prior years, and drove up prices back then. Duh!
The Case-Shiller Index is a rolling three-month average. Today’s release represents closings that were entered into public records in July, August, and September. The index was set at 100 for January 2000. San Francisco’s index value of 267 means prices in the metro have soared 167% since January 2000.
Seattle House Prices:
House prices in the Seattle metro ticked down 0.3% in September from August, and where down 1.7% from the peak in June 2018, and were below where they’d first been in May 2018:
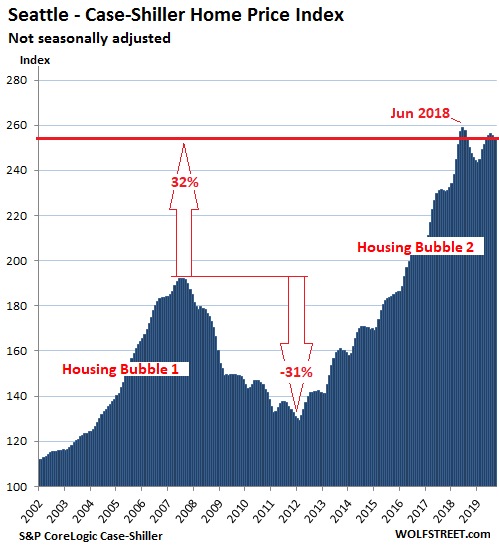
All charts here are on the same scale, with the vertical axis going from 100 to 290. The exception is Detroit, which we’ll get to in a moment. In markets where house prices have not soared as much as they have in San Francisco, Seattle, Los Angeles, or Miami, there is more white space above the curve. This shows that there is no “national” housing market – and no “national” housing bubble. All markets are local. The bubbles are local too. And some markets, while scrambling higher, remain at crushed levels.
New York Condo Prices:
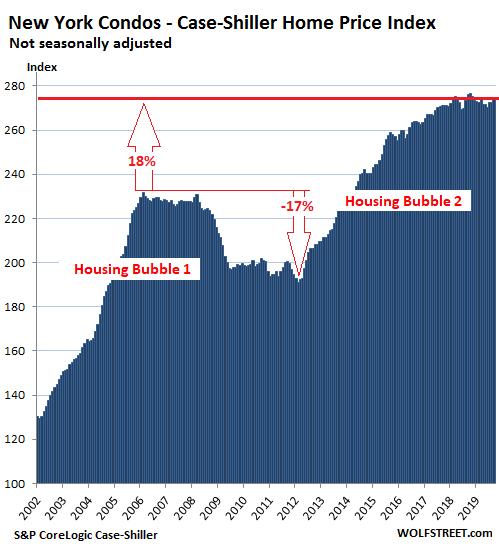
The Case-Shiller Index uses standard Metropolitan Statistical Areas for many of its city indices. But its index for New York City is based on a custom area covering numerous counties in the states of New York, New Jersey, and Connecticut “with significant populations that commonly commute to New York City for employment purposes.”
Condo prices in the vast New York City metro rose 0.8% in September from August, but were down 0.5% from September 2018, were back where they’d been in February 2018, and were up only 1.2% from September 2017:
Los Angeles House Prices:
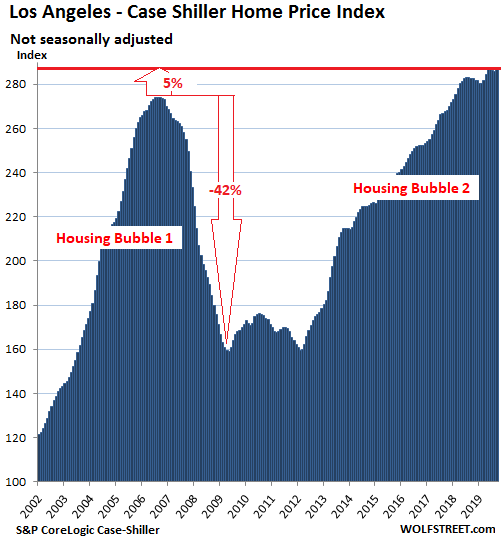
House prices in the Los Angeles metro rose 0.5% in September from August and were up 1.7% year-over-year – but have been nearly flat for five months:
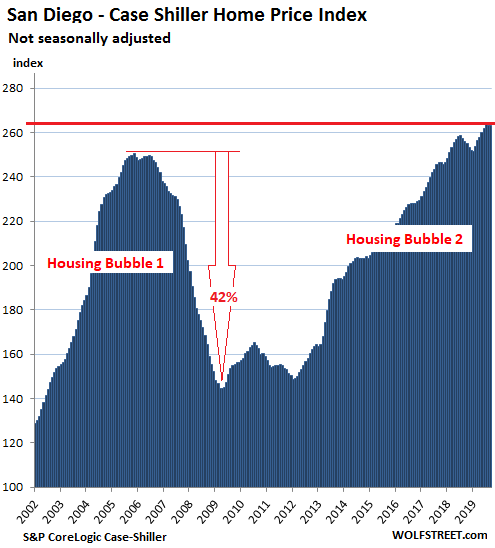
San Diego House Prices:
House prices in the San Diego metro ticked up 0.1% in September from August, were essentially flat for three months, and were up 2.8% year-over-year:
The methodology of the Case-Shiller Index is based on “sales pairs.” It compares the sales price of a house that sold in the current month to the price of the same house when it sold previously. This solves some problems other indices have: Unlike “median price” indices, it’s not impacted by “mix”; and unlike “average price” indices, it’s not impacted by a few big outliers.
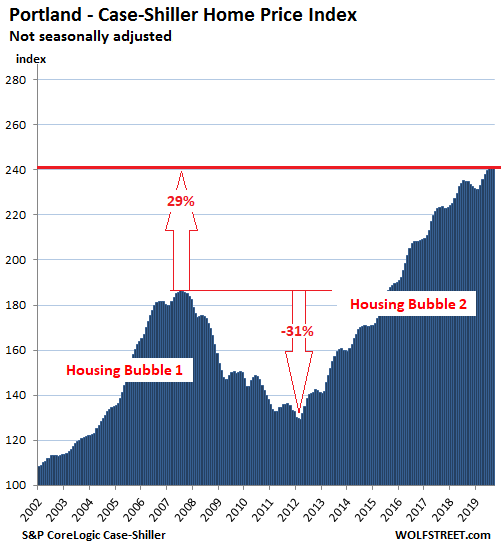
Portland House Prices:
In the Portland metro, house prices were flat in September compared to August, were flat for the past three months, and were up 2.7% from September last year. Note how the white space above the curve is getting larger as house prices have not soared quite as much since 2000 as in the markets above:
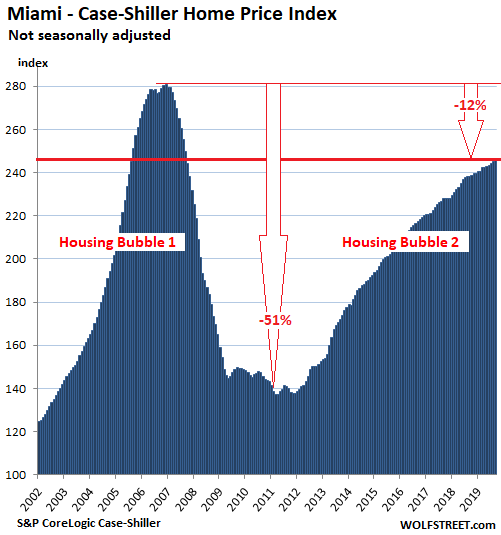
Miami House Prices:
In the Miami metro, house prices ticked up 0.3% in September from August and 3.1% from September last year, but remain down 12% from their dazzling nuttiness at the end of 2006:
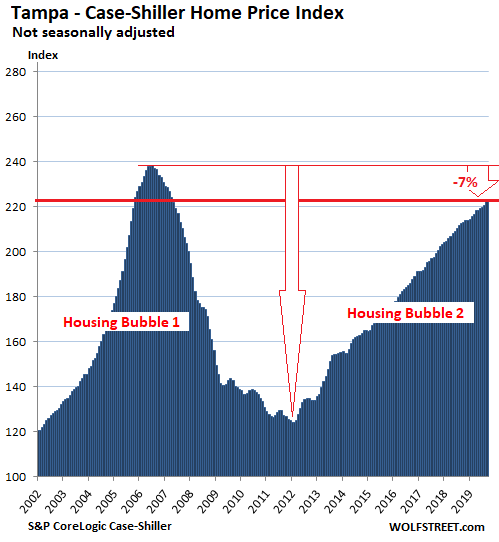
Tampa House Prices:
The Case-Shiller index for the Tampa metro rose 0.7% in September from August and was up 4.5% year-over-year. The index remains 7% below the housing-insanity culminating in 2006:
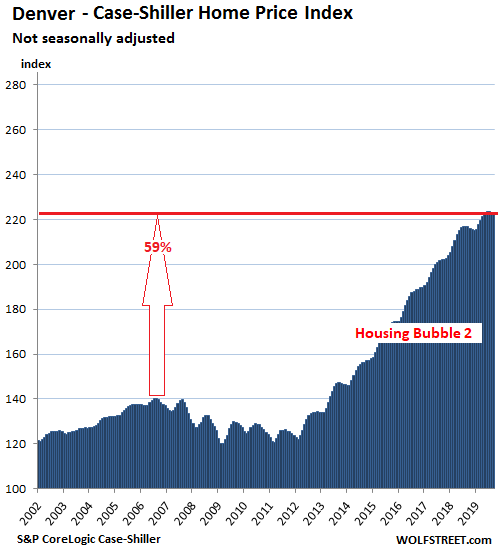
Denver House Prices:
The Case-Shiller index for the Denver metro ticked down 0.1% in September from August, was up 3.0% from a year ago, but was essentially flat for the past five months:
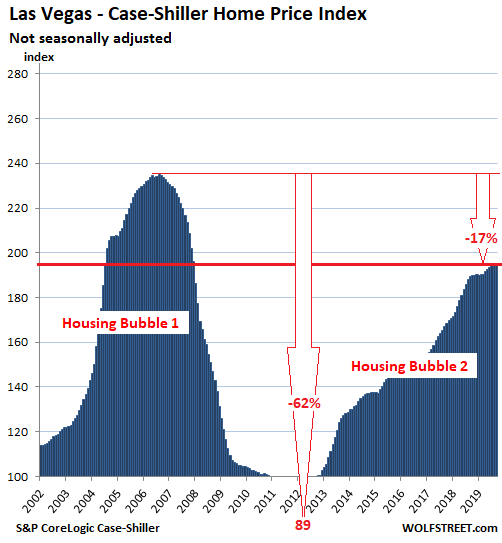
Las Vegas House Prices:
In the Las Vegas metro, house prices in September were flat for the past three months, which whittled down the year-over-year gain to 2.9%, the smallest year-over-year gain since August 2012, after a long series of double-digit surges:
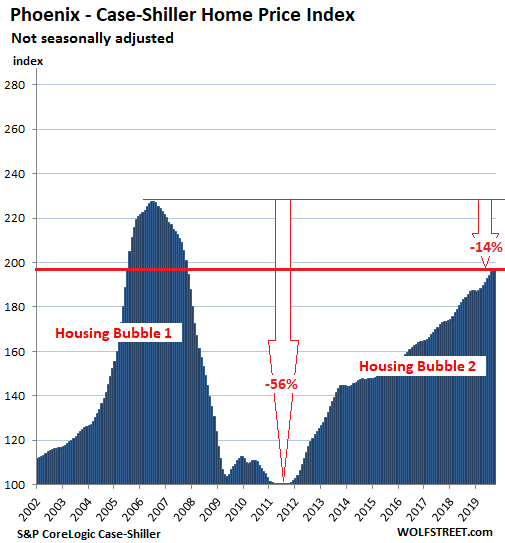
Phoenix House Prices:
In the Phoenix metro, house prices ticked up 0.5% in September from August and were up 6.0% from last year, with a new housing bubble trying to recapture peak nuttiness of 2006:
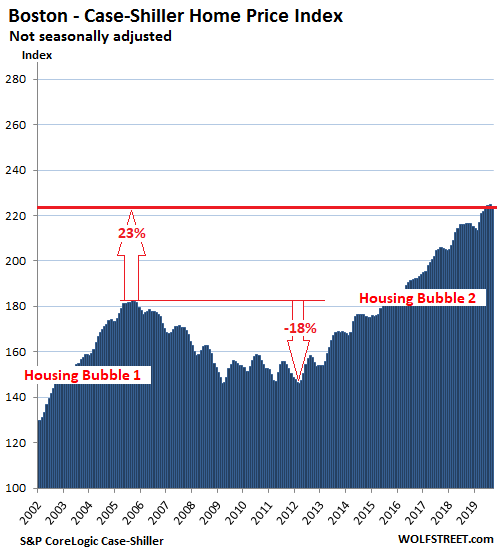
Boston House Prices:
House prices in the Boston metro fell 0.4% in September from August, were up 3.5% from a year ago, and are down a tad from four months ago:
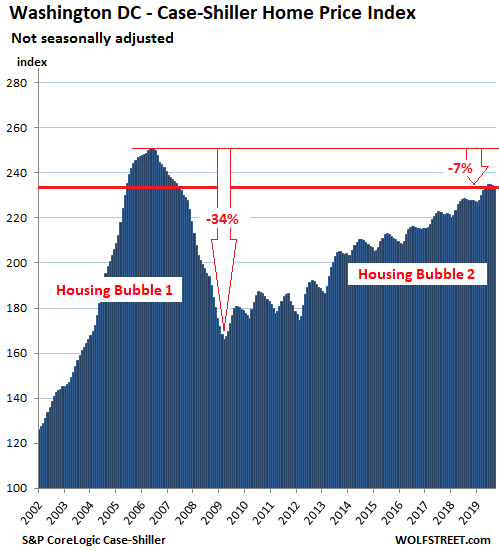
Washington DC:
House prices in the Washington D.C. metro ticked down in September from August and were back where they had been in May, but were still up 2.7% year-over-year. The index remains 7% below the peak in 2006:

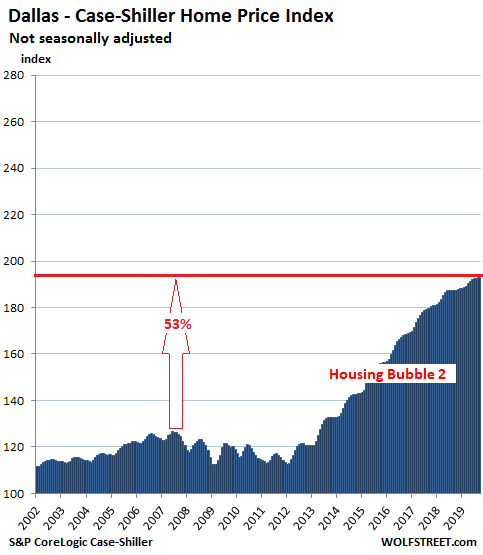
Dallas-Fort Worth House Prices:
In the Dallas-Fort Worth metro – counties of Collin, Dallas, Delta, Denton, Ellis, Hunt, Johnson, Kaufman, Parker, Rockwall, Tarrant, and Wise – the relentless house price increases since 2012 are becoming less relentless. In September, house prices ticked up 0.2% from August, after having been flat in August, and are up 3.0% year-over-year:
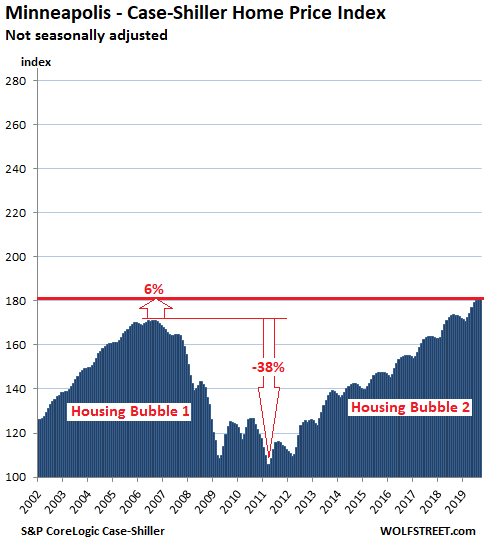
Minneapolis house prices:
In the Minneapolis metro, house prices ticked up 0.1% in September from August, and were essentially flat for the past three months. Year-over-year, prices rose 4.2%:
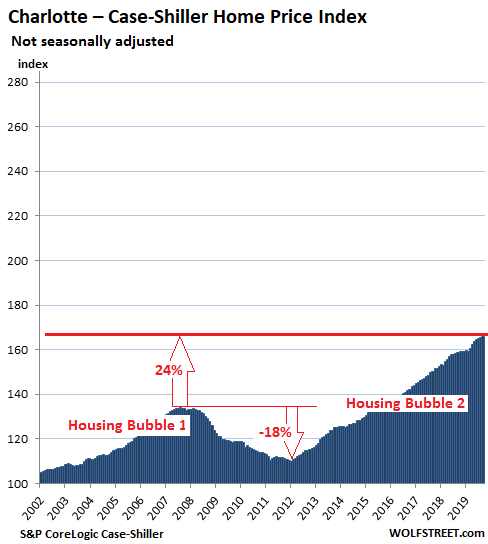
Charlotte house prices:
House prices in the Charlotte metro rose 0.3% in September from August and 4.6% from a year ago:
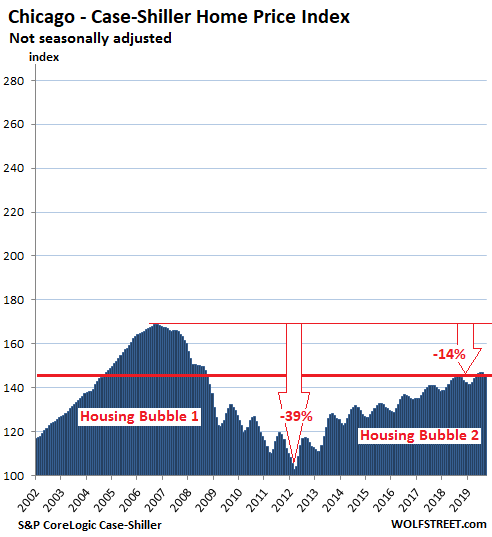
Chicago House Prices:
In the Chicago metro – counties of Cook, DeKalb, Du Page, Grundy, Kane, Kendal, McHenry, and Will – house prices fell 0.7% in September from August, which whittled down the year-over-year gain further to just 0.6%:
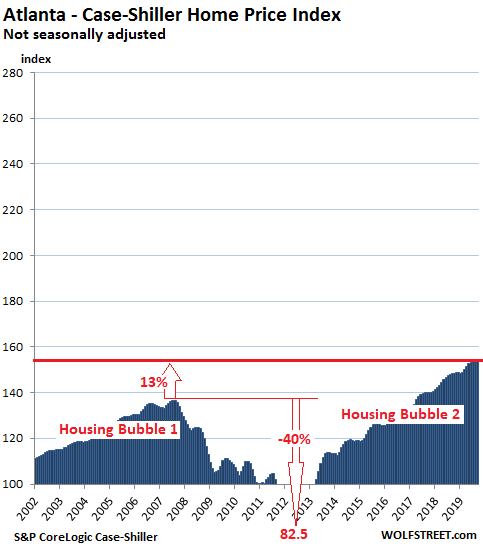
Atlanta house prices:
House prices in the Atlanta metro edged up 0.2% in September from August and rose 4.0% year-over-year, the smallest such gain since September 2012, when Atlanta emerged from Housing Bust 1, during which the Case-Shiller index had plunged 40% to a value of 82.5, taking it back to 1996:
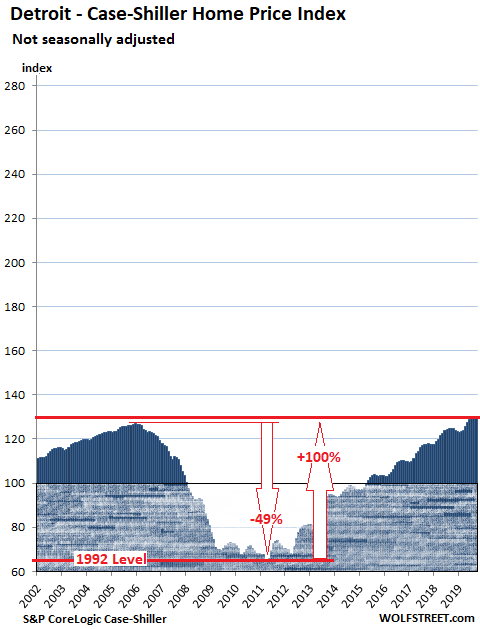
Detroit house prices:
In the Detroit metro – the counties of Lapeer, Livingston, Macomb, Oakland, Saint Clair, and Wayne – house prices were flat for the past three months, and were up 3.6% year-over-year. They’re sitting at an all-time record, surpassing by 1.7% the old record of December 2005.
Because house prices plunged nearly 50% from already low levels during Housing Bust 1, the index sank way below 100, and I have extended the chart to show the area blow 100 (shaded). From that bottom prices have since doubled:
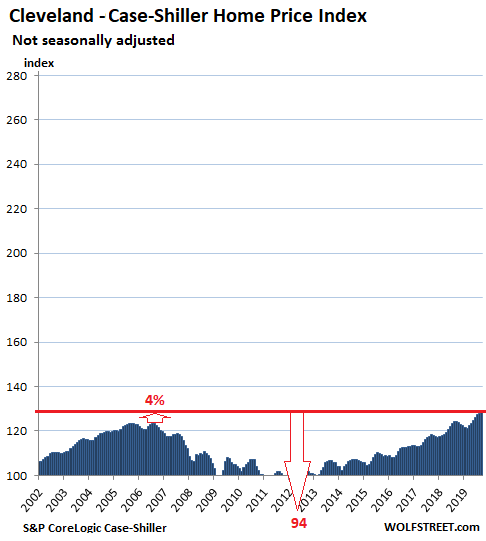
Cleveland house prices
In the Cleveland metro, house prices rose 0.5% in September from August and 3.2% year-over-year, to a new record, now up 4% from the old record of 2006. Since January 2000, the Case-Shiller Index for Cleveland has risen 28%, the smallest such increase among the 20 metros covered by the Case-Shiller Index:
A measure of house price inflation.
By comparing the sales price of a house in the current month to the price of the same house when it sold previously, the Case-Shiller index tracks how much more it costs to buy the same house over time. In other words, it tracks the purchasing power of the dollar with regards to houses in various markets, which makes it a measure of “house-price inflation” specific to those markets. So when the index shows that prices in San Francisco shot up 167% in 19 years, it means that in that market, the dollar’s purchasing power with regards to houses has gotten crushed.
Charles Schwab has been shrinking its way out of San Francisco for years. And it’s not the first major company to make the move. Read… After Years of Threats, Schwab Joins Exodus, to Move Headquarters from San Francisco to Texas
Enjoy reading WOLF STREET and want to support it? You can donate. I appreciate it immensely. Click on the mug to find out how:

![]()
Thank you Mr. Wolf for this update. Interesting the statement made by CoreLogic….”more on the bust side”. Got to hand it to the FED….they system seemed to show in 2008 that it was and is broken, but they re-inflated it bigger and faster than I ever thought possible leaving many folks behind. Moreover, this cycle really seemed to unleash a speculative fever at least on a par with the 1920’s and tech bubble/bust…but lasting even longer. But what can a “simpleton” immigrant like me know who has not one dollar of debt including no mortgage and likes to save and invest and live under the radar. Maybe one day facts and logic will make a comeback!!! In the meantime…Gird your loins!!!
Not one dollar of debt?
What about federal, state, and local? You think it’s not for you?
Socialists build walls to keep people in.
So far, you can still move state to state. And leave the public union debt burdens behind.
Just don’t have property you can’t move.
If you’ve ever availed yourself of public roads, parks, the judicial system, police and fire protection, clean air and water, safe consumer goods, flu shots, parks, or living in a country with the most powerful military force ever assembled — all paid for with tax dollars* — then you are a flaming socialist extremist. See you at the next meeting, comrade!
*fans of contemporary heterodox economics will know that sovereign national expenses aren’t paid for with taxes, but state and local expenses are.
2banana, “Just don’t have property you can’t move.”
You got that right. People in the mid-1980s who were unemployed for months if not a year or more in the mid-western states (Iowa for example) walked away from their homes, even though they were paid off in some cases, to take a job in the sunshine belt. They couldn’t afford to keep the house nor could they sell it back then.
Finland has no walls and despite the northern latitude seems quite pleasant.
Maybe the big difference isn’t social spending but authoritarianism. I often heard growing up that capitalism WAS democracy, full stop, but then, China gave us full authoritarian capitalism.
Andy: good question. As a retired CPA (as my wife says…Constant Pain in the “Arm”), here is how I look at and define debt:
1. Debt = liabilities. These are on my balance sheet. For example; consumer debt, such as credit cards (that one does NOT pay off every month and therefore allows this balance to revolve and therefore pay interest charges), auto loans, student loans, mortgages, lines of credit, etc.
2. Taxes = an expense. Fed, state and local taxes are on my income statement. They are assessed/levied year by year and then rendered unto “CAESAR”.
Of course I pay taxes, but do my best to minimize them legally.
I hope this helps. And, Happy Thanksgiving to you !
Housing prices rose 3.2% in a recent report. According to Y-charts healthcare prices rose more than 4% in the recent reporting period.
I would not like to see what a period of high inflation looks like.
“Crushed markets scramble to new (low) highs.”
Love it.
Unrealistic sellers demanding overpriced properties sell for a premium! We are seeing more inventory pile up and soon we should see a buyers market become evident . We have seen the luxury market decrease , even in Beverly Hills . Statistics show a correction is on the way – not a major one – cyclical . Buyers and sellers beware – being realistic is imperative and now is the time – if a seller really wants to sell – pricing the property is paramount and if a buyer really wants to buy – analytics are imperative !
Bubble markets turn into Vaseline coated snake pits.
Prices going from an index level of 100 to 267 are a gain of 167%, not 267%. It may still be a bubble, but of a different magnitude.
Incorrect, housing only goes up. A REALTOR(TM) and Loony Larry Yun told me so.
“housing only goes up”….are you SoCaljim under a new login?
I think you missed the sarcasm :-)
Time for new batteries in the sarcasm detector.
I was simply replying to sarcasm with sarcasm….lol….
So, some most overheated markets (California) are retreating, but many are still printing several years high. We may not be there yet?!?
If there is one thing to take home from these charts it’s this: every market is very different.
One other thing to take from these charts. These “bubbles” are not deflating. Leveling off in some cases. Moving Higher in others cases. No deflating bubbles to be seen in these charts.
Yes. Thanks for or putting into better words what been thinking and trying so say. Don’t see any bubbles going to pop so long as Fed is firmly in the Pro Bubble mode as it is now. Just regional variance & demographics.
And even in a given region, the sub- markets can vary widely. In the San Francisco Bay Area, parts of the East Bay have done unbelievably well. For example, the median sales price changed in October compared to one year ago as follows:
Berkeley 11%
Kensington 23%
Alameda 13%
Albany 3%
Other parts reflect the slowdown:
Oakland -10%
Orinda -13%
San Leandro – 22%
I am astounded to see what look like modest homes selling for crazy amounts. This 2 bed, 1.5 bath home recently sold for 1.6 million. Maybe it was the “magical creekside setting on an oversized lot” that made the difference. I haven’t seen inside, but I do know it’s on a fairly busy street.
https://www.redfin.com/CA/Berkeley/1733-Hopkins-St-94707/home/694394
TVM calculation
PV = $69500
FV = $1619000
N = 489 months
I = 7.751%
Just to put this in perspective, This home was purchased for $69,500 and sold for $1.619 million. The span between purchase and sale was 409 months. Plugging those figures into a Time value of money calculator gives me of a compounded annual growth rate is 7.751%. On average homes Across the nation appreciate at just under 4% over the long term (last 80+ years of data). Discounting this rate of growth down to the national average brings the value to $353,759.08. So the question is what is the actual value of this home/shack? That’s one “heck” of a margin to play with when taking CAGR into account over 40+ years.
Correction. 489 months, not 408 months
Wolfe feel free to correct me text if you’re able to.
Penny Wise, the simple answer is its value is what the buyer pays for it at a particular moment.
Averages and statistics are just an aggregate of what all buyers pay. They are not without meaning when analyzing trends, but mean nothing if applied to particular properties especially if taking national averages.
But if it helps our understanding, $69,500 in 1970 is about the equivalent of $350,000 today in inflated dollars. So the appreciation in real terms would be 3.175% per year compounded for the 49 years.
Presumably, the national average figure of 4% you used didn’t allow for the effects of inflation. If compensating for inflation, using the annual national average of 4% becomes only 0.6% compounded annual growth in real terms for the 49 year period.
The growth rate for the California property is actually over 5X the compounded yearly national average, not just about double!.
Funny, when the markets come down they are different.
When the bubble wants to go up, the prices are rising. No one says they are only rising in on sector or one place due to a given reason.
I studied economics, and no part of how the economics of the real world actually works as economics.
And this is with low, low interest rates again, a new FED QE again and subprime now standard again…
Housing peaked about 2.5 years ago.
Holding on by fingernails.
High end already has tanked. Mucho articles about celebrities and uber rich making drastic cuts.
Will filter downstream…
In most of the places the home prices are still increasing albeit slowly.
I don’t really see prices going down
China mints 10x more millionaires every month that USA.
The reason that Canada&USA housing is going down, is because of Trumps demonizing China, before USA was a good place to launder Chinese money, now its NOT.
Most of the Unicorn money never really materialized as promised. People who bought that aren’t Chinese, are people who already had money. Most high-tech kids coming to Bay-Ahrea rent, as they have been told not to buy.
Lot’s of kids in the Bay-Ahrea make +$200k/yr fresh out of top schools, but that money these day’s is poverty, and barely enough to pay rent, insurance, and auto payments, after taxes.
“China mints 10x more millionaires every month that USA.”
I need a source for this, and it should be broken down as to where their assets reside, housing, yuans, dollars, gold, stocks?? Otherwise you are talk out of your behind.
“Lot’s of kids in the Bay-Ahrea make +$200k/yr fresh out of top schools”
Oooh, like 5 kids, 10 kids, 100 kids?? How about some real numbers here?
Geezz!
I’ve heard Wall St. guys talk about the number of millionaires and billionaires in China outstripping us for years. Too many to remember actually. Remember that China makes things and sells them around the world and we don’t.
As for salaries in SV, I’ve heard more than one not yet graduating student boast about making 70-80K for interning at the FANGS.
Someone me on Wolf Street that one of the Fed’s mandates was price stability. Does anyone see price stability in those charts? Does anyone think it’s occurred to the Fed to look at charts like these showing housing prices? Or would be too data dependent?
From the Fed’s own website for policy objectives:
“(1) maximum employment, which means all Americans that want to work are gainfully employed, and (2) stable prices for the goods and services we all purchase.”
Nothing there about “fighting” global warming, destroying Trump or redistribution of wealth.
And yes, what a joke for “stable prices.”
“Price stability” has peculiar meanings at the Fed.
Price stability across the system as a whole would be my assumption, the wealthy helping the wealthy keep and collet more wealth while telling poor and middle class people this stuff is to help them.
Yeah, all I see is yellow showers unloading from the ‘cloud’ …..
In my area of Muskoka, Ontario, the realty is still buying up anything cheap and still driving up prices for the cheapest of properties. Big city still cashing out and buying up this area.
Joe, the people buying up RE in Muskoka are escaping from the feces throwers in Toronto.
I wonder why housing starts and permits are starting to move upwards powerfully.
Jobs, wage growth, interest rates.
Has been a very busy fall in my little
area of fly over country.
If you are of any quality, 2020 is filled or close to it,
and your scheduling builds out into 2021.
Just like schedules that booked well into 2008, 2009 and beyond, then those jobs started getting pulled within the span of 3 months.
Been there, done that, and survived.
I’ll enjoy the sun shine, and plan for stormy times.
You just keep on demanding that the sky must fall.
Tom,
I think that touches on what I’m starting to think. We can’t count with certainty that a huge 2008 crash will happen. Because ZIRP, NIRP, QE so far has a (perfect?) record of preventing down turns.
In other words, the Fed has effectively banned recessions.
That’s not an endorsement of these policies they have huge negatives and should not be policy options IMO.
But facts are facts. Japan and Europe – and now us, have gone on a very long time with no real substantial recession.
And seems to be the only thing the Fed really wants to change policy for – to not have a recession.
All other costs be ignored.
Que the THIS TIME IS DIFFERENT comments.
@Timbers After reading your “this time is different”, this confirms my thinking that this cycle is close to an end.
The FED creates recession, they don’t ban recession. Why?
Maximum employment and price stability are the two mandates, and this is the source of recession.
Definition: If a company receive $2 in Jan and pay $1 in Feb, the company has no problem.
Receive $1 and pay $2 regardless of time frame is “solvency” problem. Zombie companies.
Pay $1 in Jan and receive $2 in Feb, this is a solvent company having “liquidity” issue. The company go to money market and borrow to pay $1 in Jan and pay back debt in Feb after they receive the $2.
For the 2 mandates, the FED created lot of zombie companies under the name of providing liquidity for solvent companies.
Zombie company hires lots of people,”maximum employment” and Zombie companies sell goods/services below cost “price stability”. Two mandates acheived by zombiefy the economy.
When would this end? It is a time when the crowd starts to ask Zombie to show the profit. This is why WeWork can’t IPO, this is why Fracking Industry can NOT continue without asking Sam Zell for help. This is why Silicon Valley starts to re-evaluate unicorns.
This is why everybody knows it is all Zombies out there and the crowd starts to stay away from Zombie shares/loan papers, and the FEF needs to get their hands dirty in Repo market. One can say what ever theory about the repo, but to me, I don’t care what they say, I care what they do. Crowd don’t want securities/papers any more, crowd wants cash. Without crowd funding repo, Fed has to do it themselves.
With all of this subtle changes happening and you are saying the FED has banned recession and this time is different.
And what keeps pissing me off is Ray Dalit and Marc Benioff keeps coming out and saying capitalism is the problem and we need to reform or fix it. I can NOT say I have any chances of being able
to compete with Ray and Marc under sound money environment where Zombie will be killed and solvent companies survivors. But I do know under this FED created Zombie growth environment, I have NO chances against the billionaires and they will accumulate much more wealth than me and make it unequal. Why? Because they are FED friends. When FED showers QE they get some. NOT me.
What has the Federal Reserve been doing for the past six months? ;-)
The US real estate market is extremely reactive to monetary policies: each time there has been even the mildest “easing” it has reacted by going ballistic. No small wonder that with rates going to zero in the US in under 24 months (because…?) it’s taking off like a rocket again.
It’s likely this won’t last long because valuations are already extremely high and debt levels even more so, but it only needs to get to the next election, then it’s nobody’s problem anymore.
Wolf, why are bubbles ‘local’ if the primary cause of the bubbles is due to the Fed printing money (QE)?
Because economic activity is local, not universal, and interest rates are ‘one size fits all’ national, fixed by a central committee. A region that may be considered to be more desirable from an economic or social perspective has interest rates the same as less desirable places despite higher demand for financing. In a local ‘free market’ model for money demand, the cost of funds would be higher in a high demand region, and theoretically limit price inflation.
It’s sort of like saying that everyone experiences a personal rate of inflation despite the CPI claiming some number for the whole country.
Consider Chicago: with an index of 170 in 2008, the hypothetical inflation-adjusted current index would be 211, but is actually 145, an inflation-adjusted decrease of 39% from 2007-8, not just a decrease of 14% as shown in the charts. So in Chicago, in terms of purchasing power from the sale of your property, the averages are down almost 40% in the last 11 years or so. But from your perspective as a buyer, your house cost would be almost 40% less than 11 or so years ago. You would actually be experiencing a ‘house’ rate of inflation of minus 1.5% per annum because the index actually dropped from 170 to 145 if you bought now instead of 11 years ago. So your rate of inflation would be just 0.5% PA, rather than the 2%. Rental expense while you were waiting to buy would probably be equivalent to mortgage interest costs and the increases in taxes and other expenses should you have bought a house at the peak in 2008, so you’re even on that.
In San Francisco, you would be experiencing 15% increase in house price over the headline rate of inflation for same period, in addition to the national CPI ‘inflation’ of 2% per annum, or a combined annual ‘inflation’ rate of 3%, 50% higher than the CPI, and 6 times that of Chicago.
Many fun ways to fudge the numbers, but the lesson is that monetary inflation is individual, not universal. In this example, assuming that you are gainfully employed in Chicago and are happy living there.
Looking at those charts I don’t see a significant down turn.
I think one can make a rather confident prediction that prices will be higher next year.
In some markets, prices will certainly be higher next year. In other markets, maybe not. There is already a lot of divergence, with some markets storming higher, and others on the decline.
Unfortunately, Boston has gone way way way into the land of irrational exuberance in a town that has a culture of fairly rational people who are more fiscally conservative in regard to personal finances for the most part.
Some subjective examples:
1. One floor of a triple decker three-family sold as a condo for 1M in non-prime area.
2. Many “cash out refi” Mercedes-Audi-Tesla-BMWs
3. It seems everyone is in their 20s or 60+
4. Defections south for professionals due to COL, weather, lifestyle
5. People absolutely 1000% convinced gains are unstoppable.
So it’s either:
1 Part of the business cycle and I am in good shape OR
2. A new world order re: economy and I will be buying to just pay interest and “rent” the place I “own”. See Sweden etc.
Boston’s job market was on fire from 2010ish to now, but the growth has slowed. I’m convinced that housing in Boston will see a correction before this is all over, especially if a lot of these jobs fold in a broader economic downturn. There’s a cap to how much people will pay for 100 year old housing stock in a city with some of the worst weather in the US, and the worst (recent study) rush hour gridlock.
Vancouver is imploding but interesting how the fake mefia fails to mention it . Wolf please do a chart on vanvouver.
In my Union City, CA greater neighborhood, asking and selling prices have been pretty flat the last couple of years, and significantly lower than Zillow estimates. The disturbing thing is that about a third of the current listings are foreclosures.
I’ll say the media is in cahoots with real estate! I made a comment in the local San Francisco chronicle in which I pointed this out and said that the newspaper was essentially turning into another real estate website with all of their “showcase homes”. That comment got me banned from commenting on their online newspaper. (I was obviously utterly devastated, har har)
Hey Wolf
Why don’t you do a peak to peak line like you do with the stock charts? For instance for Vegas we can see that after 10 years, the real estate market still hasn’t recovered, or Tampa prices are back to 2007 levels. Kinda takes away the splendor, doesn’t it?
The 2006 values in Miami and Las Vegas and other places were purse insanity. If you think that going back to this level of insanity is “recovery,” then something is twisted.
San Francisco and Seattle are expensive for a reason:
They shape the world’s future.
If Florida is the cock-n-balls of America,
San Francisco and Seattle are its brains.
If you are Han Chinese, and a real isolationist,
mind and body, then Hong Kong might be the place for you.
If you’re Japanese, Japan might be for you.
If you’re uber-handsome, with a car fetish,
try Los Angeles. If you’re Mormon, try Utah.
If you want to see what tolerance looks like,
where the good, the bad, and the ugly,
live in relative harmony, try Seattle.
Seattle? Over-caffeinated blindly-progressive junkies? A very active minority tells you what to do and think. Once upon a time it was beautiful. So was Beaverton. Sigh.
Seattle and Beaverton welcome all kinds of ideas;
many of which are ridiculously absurd.
Seattle has plenty of bad, plenty of good,
and lots of ugly. It’s a mixed bag.
Very true. But the bag has become a lot more lumpy due to the new and considerably changed contents. Guess I’m just too nostalgic. Sigh twice.
“If you are Han Chinese, and a real isolationist,
mind and body, then Hong Kong might be the place for you.”
Ha! I’d make that Han Chinese AND Cantonese. Non-Cantonese Han people who aren’t even from the mainland are at risk of getting walloped by the fist (or at least kept at arm’s length by the palm) of xenophobia these days.
It seems like it’s late at a party, totally out of steam, on the verge of breaking up. However, the Fed DJ keeps cranking up the music with all kinds of phoney energy, pretending we’re just getting started, not wrapping up. Meanwhile to everyone’s disbelief, Mr Stock Market is up dancing away Solo, cheered on by the old, crazy, orange haired guy who some how is never tired. Everyone else is starting to wonder how to find their coat and exit this thing, gracefully….
Well SPX hit my 3150 number today…..I hate to say it with these many people short, a blow off top is in play….4th year of first year potus is 2nd best in term….this year being the best…..
3400 next year is not out of question…..wall street might help Trump win election, they don’t want a democrat in potus from the current crew
agree
I recall seeing that primary residences amongst the rich amount to about 10% of their net worth. In a place like the Bay Area you don’t really start moving up the housing ladder unless you are prepared to pay 40% plus more than the value of your existing home,i.e. the price inflation over the past few years. Thus a person who owns a $1 million dollar existing home has little incentive to buy a more expensive home as it increases their property tax basis by a lot more than just the difference in the sales price. Better to just buy top of the line kitchen appliances or some similar upgrade to your home the assessor doesn’t have to know about.
interesting from DC’s American Action Forum by Eakin…pjs
Eakinomics: Green Shoots in the Housing Market
On days when important economic data are released, I (among others at AAF) receive an email summarizing the data. Yesterday morning’s was entitled “New Home Sales, October 2019” and contained the following short summary:
New Home Sales
October: 733,000
September: 738,000
M-M: -0.7%
October 2018: 557,000
Y-Y: +31.6%
Yowzer! Sales of new homes in October were up 31.6 percent from sales in October 2018, but they were down from one month earlier. That got my attention.
Housing sales and construction have been in the doldrums for quite some time. Now I recalled that in the 3rd quarter estimate of gross domestic product, residential construction had added 0.18 percentage points to growth after averaging a subtraction of 0.14 percentage points over the previous six quarters. But this new report of new home sales really got my attention.
What is going on? First, the full release indicates that the median sales price decreased 3.5 percent from one year ago; it is now $316,700. Lower prices help demand. In addition, the Fed has cut rates, which provides additional fuel to the growth in wages and jobs that has been a hallmark of the past two years. These not only boosted new home sales, but also existing home sales. As a result total sales (new plus existing) rose by 7.2 percent from a year earlier, and only 5.3 months of inventory remain on the market. A full range of housing data for Q3 2019 can be found in the AAF’s Housing Chartbook, published quarterly.
As one might expect, this increase in activity has changed the equation for the home-building industry. Residential starts rose, and permits have recently been issued at the fastest pace since 2007.
Housing has traditionally been an important component of business cycle fluctuations. In the current setting, a stronger residential construction sector is an important hedge against downside risks.
pete Stubben,
Also keep in mind that this new house sales report by the Census Bureau is subject to very heavy revisions in the following months as more data become available, particularly the number of new houses sold. In my experience of looking at this for years, any major outlier like this, in either direction, is going to get revised back into range over the next two months.
But you’re right, prices are down and sales are up. I cover this every few months, and I use a three-month moving average, and sometimes a 12-month moving average, to show the trends. Here is the 3-MMA of sales vs. median prices, and you can see the correlation: cut the price, or put lower-cost product on the market, and sales go up:
This headline shows the inherent problem of trying to base an economy on selling to the 1%. There’s not enough of them.
Any economy that is based on having only a tiny percentage of its population financially able to buy is doomed to fail. Old Henry Ford once understood that his workers needed to be able to afford to buy his cars. Now, Ford workers (new hires are low-paid ‘temporary workers’) can’t afford the typical new Ford and they can’t afford to buy a house. Some try, but they take on crippling levels of debt to do so.
And the economic boffins (themselves members of the 1%) are all confused about why the economy isn’t soaring.
The housing boom is going to bump into a natural limit as the boomers age and die off. Right now they are dying at the rate of ~1M per year. This means a large number of homes and rental units opening up for the next 20 or 30 years. Since the generation after them is much smaller, the spread between supply and demand, will widen as boomers die off.
If the trend continues, in the next ten years ~10M of the population will disappear, along with the demand for housing, services, etc.
Concur, and the oversupply problem is just getting worse. Ca mandates new affordable housing which just adds to supply. Like most people in the state 2/3s of my assets are in RE, and thinking about more, only because one-ply wall street paper doesn’t get it, rather take my lumps and be able to stand on my losses. Right now vacant land is dirt cheap, and despite my generation dying off there will be new immigration and the need for housing will be there. Can’t imagine a great country like this sitting empty for long.
Starting to see more buy for cash offers, and recently got a flyer to attend a RE tax seminar. All of this suggests rising foreclosures and sellers just wanting to get out. SoCa condo prices are jacked up relative to homes with property. (condos are easier to recycle in the rent market) New rent control law goes into effect Jan 1 caps rent increases at 5% a year plus inflation, which could turn out to be a gold mine, with prop 13 at 2%. The law doesn’t cover everyone, and there are exclusions are for noncommercial rentals. So perhaps Blackrock is moving on, first we lost the Chinese money, then the Wall St money, then the insurance companies dropped fire coverage in some areas. Prices are doing pretty well actually.
I read everyone’s comments and as an owner of lower end real estate (rentals), the purpose-driven disparity between the top 5% (ish) and the restovus could not be more clear to me. My properties (2BR and 3BR homes) in the Midwest are valued at $40K to $65K and with little variance (2008-2013) have had the same valuation since the 1960’s. Bubbles are created by and for those who can afford them.
Hey Beardawg,
What are the respective rents? TIA.
I see stuff priced on the basis of low IR financing. Its seems to me that the lower end has less value and the upper end has more relative value. Also go back 2-5 years and see what the listed properties on Trulia sold for. Doubt it takes much to regress pretty quickly in terms of price…but no, I have no idea what will cause the regression.
QQQBall
Thanks for your input. I was buying properties in that market three years ago and the prices were the same. To answer your question RE rents, that is where I am definitely making advances, since I rehab the low end stuff nicely and get $1000/Mo for a $60K house. Those typically went for $650-$800 in recent years.
There was/were/are fluctuations in the $80K to $130K market……flippers have been grabbing those.
My original point was that these crazy west coast increases are created by money for those who have money. Those in the bottom tier see very little price fluctuation in housing and their affordability does not change much.
Millennial cannot have their parents properties completely. As boomers are expected to live longer, medical bills will add up and house will be gone to pay the expensive hospital visits. If your millennial son or daughter does the following beware. They are trying to win your hearts and minds, the house eventually.
….After all these years, I agree with you. You were right about…
“Kids really like it here. its like they have an emotional connection to this place”
I would like to settle in a sub-urb eventually. Its safe for the family.
I understand now, Regan (or Jimmy Carter) did the right thing for….
I recently visited Kentucky, I brought this keg of rare whiskey for you. you deserve it.
(buys fake vintage wine) Couple of glasses are actually good for your heart.
You must try skydiving, I got free tickets.
Boomers beware….
Hi Wolf:
When the entire housing market finally goes into full correction mode, what do you think that will look like in a place such as SF Bay Area? 50% or more drop over a decade period of time, like Japan in the 90’s?
Curious if you were to give your best estimate, what do you think?
Andrew,
It can take all kinds of forms. For example, in the eight years from 1990 through 1997, the Case-Shiller index for San Francisco did a long mild dip (-10%). It took the dotcom bubble to pull housing out of that dip. The last bust starting in 2006 was a sudden and deep plunge. There is no telling what this will look like in the future. This area is always cycling between boom and bust economically, so everyone I know who is in real estate and has been through this a couple of times is expecting something, but no one is sure what.
This time isn’t really different than 1970’s back then SF was porn theaters, drugs,&feces, now its back.
1980’s was the best,
Watch knob-hill real estate, if it plunges buy some.
I wouldn’t worry too much about LA or Bay Area prices. As long as the Central Banksters – Fed, PBC, ECB, BoJ, etc. – are counterfeiting (er, adding more liquidity to the economy) more money, prices aren’t going to fall significantly.
They may fluctuate, but a large drop is unlikely barring a major earthquake.
Pray tell Mr. Wolf are you a millionaire?
While this entire post is true, is any of it new?
RE goes up & down, that’s how rich people make money, buy low sell high.
People have always bought xmas with credit-cards, since they have been able to spend before they earn.
People have always carried the balance forever, because they just pay the min-monthly due.
This is the real reason the rich get richer, an the poor get more poor.
What’s a mother to do? Not be one of them, don’t live where the water is filthy, don’t spend money you ain’t got, or didn’t already earn.
Long ago there as a book called “Richest man in Babylon”, I think a reader-digest book of 1930’s that was popularized, it was ‘fake’ but essentially it told the truth, that in any and all society’s 3% get-it, and 97% don’t, that in any civilization in time the majority become slaves to the minority.
The deal is to make sure that your one of the 3% that’s all you do in your short life.
There are more houses and rentals kept off the market in Los Angeles than there are homeless people, a lot more, and there are over 60,000 homeless.
The first step to creating a residential real estate bubble is to create a residential real estate shortage. The cost is much more than offset by the increase in revenue, so the incentives are huge.
Nothing substantial gets done in the US unless tycoons get a thick percentage. If there is no thick percentage it doesn’t get done, which is why a lot of the country has turned into Haiti.
The Fed should have only allowed bulk foreclosure to pe, hedge and foreign companies with 5-8 year sell back clause……the fed, treasury and govt. fixed the housing market, like the Libor it happened but this time it was changing existing models, laws, hoarding rules by banks etc…..anything to stop price discovery on housing…….then we all became pottersvilles, just like the movie but no angel there to save us
Alternatively, perhaps prospective buyers are hopeful for a quick end to the disaster in the White House via impeachment. Afterall, OC residents voiced their preferences in the 2018 elections and historic red districts were flipped blue.
The policies current administration is the only thing keeping this leaking economic ship afloat. Any change to the current policies would adversely effect corporate profits and thus the stock market which would trigger devaluations in real estate…
GirlInOC, I presume you mean the illegal “vote harvesting” practiced by the Democrats that flipped Red seats blue. Oh, and the “moderate” policies promised by Rouda and others.
Don’t worry, they won’t be “Blue” for long, though the jackasses will be crying the blues!
It is amazing how much people fail to realize how much of this is dependent on the next election. The number crunchers have already run the numbers and should a liberal candidate who advocates for higher taxes on corporations and the wealthy win, the stock market and real estate markets will both take a substantial hit. It may just trigger the next big one…. If the election appears to be in question, I would expect the liqudations to begin well before the election…