Dallas-Fort Worth ekes out new high, Chicago struggles, Atlanta, Minneapolis, Charlotte, Detroit, and Cleveland in charts.
US housing markets are intensely local, each following its own dynamics, and with mind-boggling differences, both in prices and price movements. This is amply illustrated by the CoreLogic Case-Shiller Home Price Index for 20 metros, released on Tuesday. I detailed the markets that are deep into Housing Bubble 2 – though some have now hit a ceiling – in The Most Splendid Housing Bubbles in America: First Year-Over-Year Drops Since Housing Bust 1. And here is the other batch of metros, those that range from still crushed markets to budding bubbles that haven’t quite yet qualified for the list of the Most Splendid Housing Bubbles.
Dallas-Fort Worth House Prices:
The Dallas-Fort Worth metro largely missed Housing Bubble 1, to the aggravation of homeowners and speculators who could not figure out why home prices were skyrocketing nearly everywhere else. And they were spared Housing Bust 1. But these years of the doldrums were followed by years of party time, with home prices surging relentlessly until mid-2018. Since then, price increases have slowed to a crawl. The Case Shiller index rose 0.6% in April from March, to a new record, but that was less than the seasonal increase in April last year, and the gain for the 12-month period was whittled down to 2.7%, the slowest year-over-year gain since March 2012:
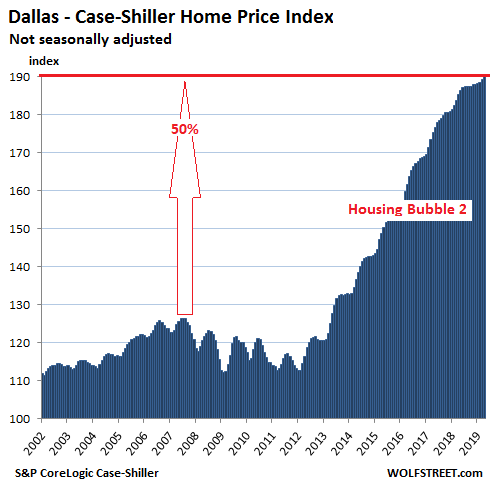
The Core-Logic Case Shiller Home Price Index is a rolling three-month average; the current release tracks closings of home sales that were registered in public records during February, March, and April. Its methodology is based on “sales pairs,” comparing the sales price of a house in the current month to the prior transaction of the same house.
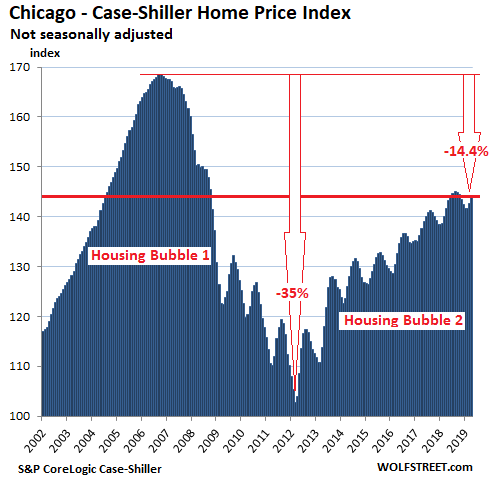
Chicago Home Prices:
Single-family house prices in the Chicago metro, one of the largest housing markets in the US, rose 1.2% in April from March, about in line with the seasonal uptick in April last year, for a 1.9% gain for the 12-month period, according to the Core-Logic Case-Shiller Home Price Index. But prices remain 14.4% below the crazy highs in September 2006 at the peak of Housing Bubble 1, which was followed by Chicago’s harsh Housing Bust 1:
Condo prices in the Chicago metro plunged 40% during Housing Bust 1, according to the Case Shiller index, but then surged with large seasonal fluctuations. However, in recent months, the surge has slowed. In April, condo prices rose 1.6% compared to March, but that was slower than the seasonal rise in April 2018, and the year-over-year gain, which has been shrinking in recent months, shrank further to just 1.6%:
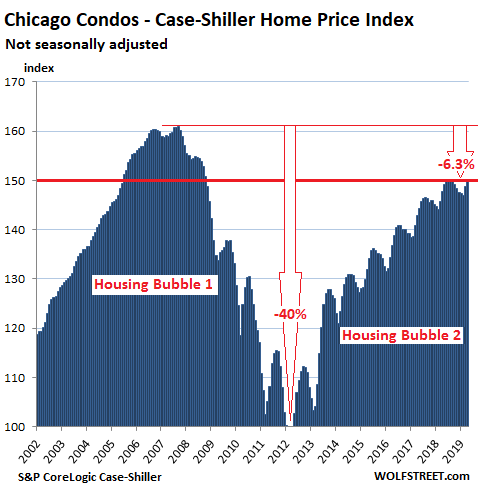
The charts here are on the same scale – except for the Dallas-Fort Worth metro, whose price surges have ballooned past that upper limit. On the charts for Chicago and all charts below, the vertical axis ranges from 100 to 175. This fits Chicago’s Housing Bubble 1. A value of 150, as is the case with Chicago condos, means that prices have risen 50% since January 2000 (for which the index was set at 100). This shows remaining metros on this list in the same light – and with chilling effect for Detroit and Cleveland.
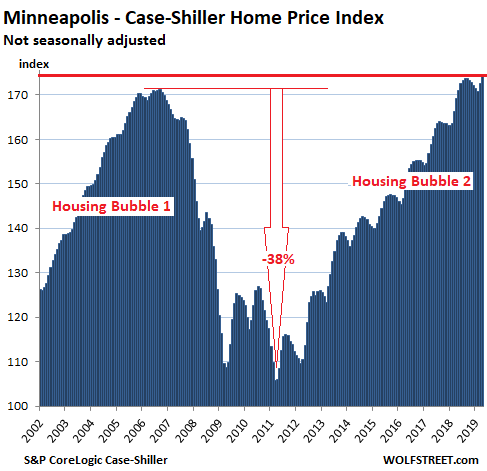
Minneapolis house prices:
In the Minneapolis metro, house prices rose 1.0% in April from March, also more slowly than the seasonal gain in April last year. This reduced the year-over-year gain to 3.0%. The Case Shiller index is 1.8% above the Housing Bubble 1 peak. Note that this chart is on the same scale as Chicago’s:
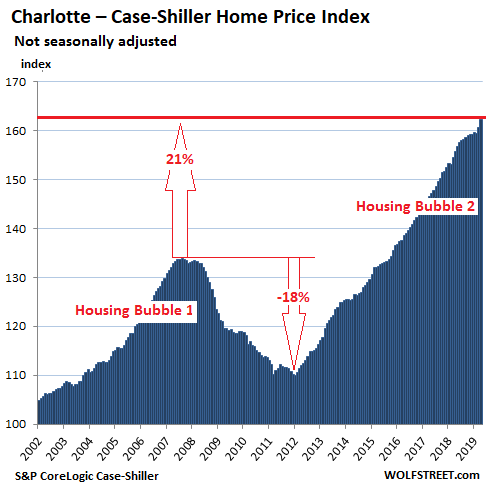
Charlotte house prices:
House prices in the Charlotte metro rose up 1.1% in April from March, to a new record. The increase was about in line with the pace in April last year. The index is now 4.2% higher year-over-year. Note the absence of seasonality in Charlotte:
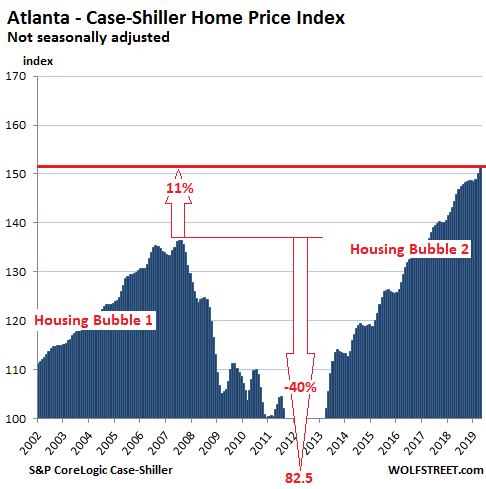
Atlanta house prices:
In the Atlanta metro, house prices increased 1.0% in April from March to a new record, putting the Case Shiller index 4.9% above April last year. The index is now 11% above the peak during Housing Bubble 1. This chart, which is also on the same scale as the charts for Chicago, is starting to show more white space than the prior charts, indicating that house price increases have been more muted. It also shows just how far prices dropped during Housing Bust 1, falling all the way to 82.5 by March 2012, back where the index had first been in 1996:
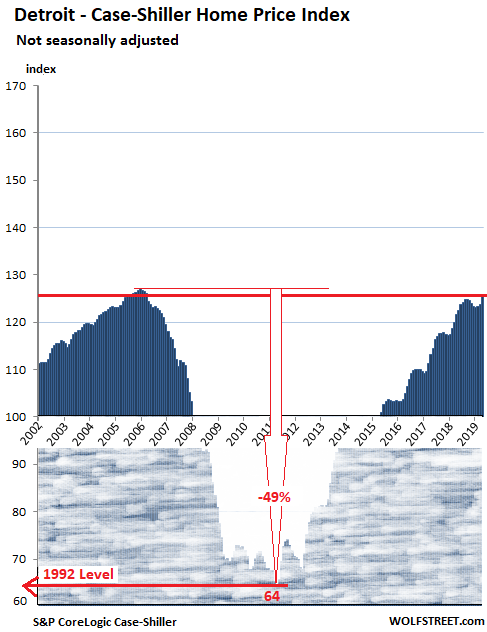
Detroit house prices:
The housing market in the Detroit metro has experienced a huge rise (+95%) since the nadir before the city’s bankruptcy, but off very low levels. In April house prices jumped 1.6% and are up 3.5% from April last year. This leaves the index 1% below its peak in December 2005. The dark-blue part of the chart below is on the same scale as Chicago’s, but I added the shaded area below the scale value of 100 — the underwater part — to show just how far prices had fallen – to 1992 levels – and how much they have surged since:
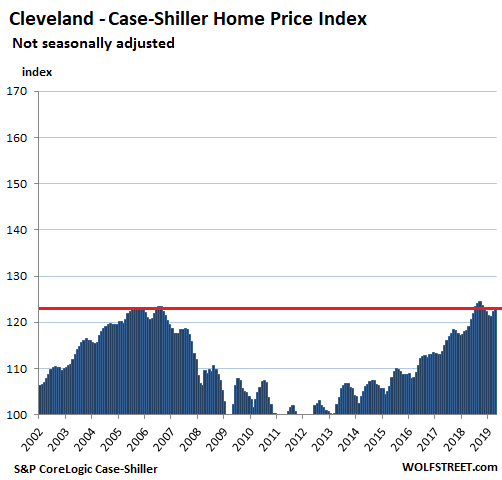
Cleveland house prices:
House prices in the Cleveland metro ticked up 0.7% in April from March and are up 3.5% year-over-year. They’ve now almost but not quite reached their previous peak of 2006. The index value of 123.2 indicates that house prices have risen 23.2% since January 2000. That should sound about right for “normal” housing markets that rise in line with inflation, but the US has not been a “normal” housing market, studded as it is with housing bubbles and busts and more bubbles. So this 23.2% increase since January 2000 makes Cleveland the housing market with the slowest price growth since 2000 in the 20-city Case Shiller Index, a couple of notches below Detroit:
Condo prices in New York and the San Francisco Bay Area fell year-over-year for the first time since Housing Bust 1. Seattle house prices were flat year-over-year for the first time since Housing Bust 1. After earlier declines, Denver, Boston hit new highs. Miami, Phoenix, and Las Vegas try to regain nutty peaks of Housing Bubble 1. Read... The Most Splendid Housing Bubbles in America: First Year-Over-Year Drops Since Housing Bust 1
Enjoy reading WOLF STREET and want to support it? You can donate. I appreciate it immensely. Click on the mug to find out how:

![]()
I remember the Case-Shiller Index is supposed to be inflation adjusted according to CPI price data. These peaks little peaks are scary. It is getting worse as home prices rose faster than inflation.
It seems like too much money is spent buying homes, renovations and additions. Not a good time to hoard empty homes.
Some retirees have driven their campers into the deserts of New Mexico to avoid paying rent. I saw it on 60 Minutes. The price of gasoline is rising.
I think Case-Shiller is *not* inflation adjusted and that this has been mentioned in many past articles. Rather, it is a measure of house-price inflation.
My son bought his first home in the Dallas area around 2009 for $206k using the first time home buyer tax credit program. He sold that same 2500 sqft home last month for $316k. If my math is correct this lines up with the chart for Dallas.
Prices in the older suburbs around Dallas seem to be jumping up in price also as people are priced out of the new suburbs.
The number of new home sales YoY have been on a downward slope for the past 7 years, actually since 2011.
Just this past MoM they have dived almost -8%.
Taken in context with all the other negative fundamentals, that just keep on piling up, it spells recession. eg: The US 2 year swap spread has turned negative for the first time ever! Just add these latest numbers to the ever growing list of recession confirmations.
Since the inception of the USA, say landing of the Pilgrims, its been about ‘real estate’, and the ‘like’ of immigrants has been about real-estate, keep them coming in, keep them in debt, and keep the real-estate prices rising.
Funny thing is most places on earth don’t allow foreigners to own land or homes, just ‘apartments’, this is so the locals don’t lose the ‘farm’, like what has happened in USA where farming is now AGRI-BIZ and the little-guy farmer is a distance dream.
Most ppl in USA that do have a net-worth have their ‘worth’ tied up in real-estate, funny thing is this is not liquid, and when the time comes for ppl to cash-out, who is going to be the buyer?
It’s all going down, and like Wolfs graphics here, next time it very well might not come back for generations.
IMHO the best approach is to sell out NOW, and get far away from USA, and then post civil-war, if you really must return, then come back and buy for penny’s on the new FIAT. I think that post civil war the USA, will be a most un-civil place for decades. Remember the 350M ppl most of them don’t even have the ability go feed themselves or find drinking water, and with ‘just in time’, once the food trucks quit rolling, then +90% will go cannibal, and how do you re-domestic once gone ‘feral’?? You don’t
Decline unfolds in, perhaps, more benign ways than revolution and apocalypitic visions. Think Portugal, Spain, England.
Many years ago I listened to a historian discuss the eventual decline. This was right after the Iraq invasion. He was English and his wisdom?, “Relax, it isn’t the end of the World and you’ll get over it, just like we did”.
As to breaking RE bubbles, it doesn’t really matter if you don’t plan on moving or aren’t underwater. IMHO, a house isn’t about just investing, it is a home. Buy what you can afford, where you want/need to live, and buy what you can afford when you’re not working full time, not what you can afford going flat out on the hamster wheel. If more people lived within their means, nay, below their means, we wouldn’t be in this pickle of debt and worry in the first place. My Dad’s first home was about 600 sq ft, in Minnesota; he had 2 young kids. His parents were pleased to have 1 bathroom with indoor plumbing. Where/when did this insane consumption craving enter our lives with granite counters and appliances the size of tug boats? Nuts.
I agree with Paulo. I come from Hungary but live in Canada. It is the banks and corporations controlling governments and governments dumbing down the generations. Not necessarily in the general sense of “intelligence,” rather in the meaning of “common sense.” It is too bad, but I’m sure it happened in humanity’s history a few times before.
I always say: “It could be worse.”
I wonder how many of us in the U.S. have lived this way Paulo?
Mostly farmers and retirees, I suspect.
Young people in general would be highly unusual if they postponed gratification to attain financial independence early in life.
Might be the worst comment i’ve ever read on this entire site
You’re not getting your share of the booty in America so you move to some third world country (where they hate Americans?). I know if you are Jim Rogers, or Bill Bonner you can make it work anywhere, but for Joe BBQ? I tell people I am going to hang around for the revolution, or hang in the revolution.
Thats totally insane…. we are a civilized and educated nation it will never happen.
I wonder if these charts show some evidence that people are moving to places like NC, TX, etc and away from CA.
The dynamics of the market is local, but the influences that is driving those markets seem to be quite global.
Very interesting. Pictures and charts say thousand words…
I could not see the Bubble so clearly without I read this article. It shows exactly the reality of the Bubble wealth and assets overvaluation with the help of Federal Reserve and manipulated economy. That is why we see so many homeless people because of man made statistics established by the few in decision making rule to cause pain and suffering to millions of their false insight and real facts manipulation.
Now, the stock market is the economy and the people involved will make you to believe that all Americans are prospering.
No need to worry! When the stock market collapsed the government arranged the greater rise in share prices in history. When the housing market really collapses, the government will do the same for house prices, it’s called democracy i.e. any politician who doesn’t do it will be gone. Just look at history, 1928 the US is the most capitalist country in history, 1935 it was not much different from the USSR in government control of the economy. The answer to every problem – we have ink, we have paper, we have printing presses, we have no problem.
The top 10% own 85% of all stocks. If you’re not in the game, you’re out of the game.
Single family housing permits have been in decline for 7 months. This means less inventory in the near term so price gains will continue. Over the next 18 months employment and economy will slow and people will have to start some panic selling—and the prices will start to decline.
You know what I see in these charts? I see the rust belt getting back to where the were when Bush was in office. I know people in metro Detroit, and they are excited again. To me, this looks like our president is more likely to be re-elected because they are getting optimistic about their future. Their biggest asset, their home, is showing some promise. If the midwest homes continue to do well, and if a Chinese trade deal happens, then the president’s re-election is likely because the midwest will be happy.
I don’t see anybody anywhere getting optimistic about their future. We have a recession coming around the bend and most people see it. People are not kind to each other anymore. Dog eat dog. Too much self worth tied into materialism. It’s a shallow depressing existence for many people. Always wanting more of what doesn’t matter.
Don’t get me wrong. A national recession is around the corner … the question is does it appear before or after the election. With enough rate cuts, it might not happen till after the election and that is what the president is hoping for.
But, much of the midwest has been in a recession for much more than a decade so times are the best they have seen in a long time. That is Detroit’s story. Rising home prices and improved job prospects.
This attitude tends to change from day to day. The last time one of his fans that I know was boasting about his progress with China was disappointed the next day after Trump tweeted out more threats. The latest pause is for the G20 Summit, expect another celebration 24 hrs after the Summit and a falling out within 24 hrs after that. The usual.
Do the demographics in HB2 have any political consequences?
I think there might be political consequences from demographics in the next housing downturn. Millennials will be saddled with student loan debt for years and they understand they will be subjected to the gig economy, no matter their occupations. The lack of stability will have a big impact going forward.
Got a friend who works in Raleigh, NC in professional legal services. She has worked about 5 different jobs in last 5 years all in the computer software or hardware area. Just got hired away with 10% plus bump in salary. I think job market is very tight.
Plus two (at least) major development projects are being floated 1) a large stadium for a professional soccer team that has not yet been hooked 2) a tear down of Sears store and construction of a mixed used high rise. Makes me think top is close as both require a lot of debt and are speculative.