Seattle home prices drop at fastest pace since Housing Bust 1. Feeble declines in San Francisco, Denver, Portland, etc. Flat prices in others. Condo prices in NY City suddenly jump.
Single-family house prices in the US, according to the S&P CoreLogic Case-Shiller National Home Price Index, were essentially flat on a month-to-month basis in September, and rose 5.5% compared to a year ago (not seasonally-adjusted). This year-over-year growth rate is below 6% for the second month in row, after having been above 6% all year. This leaves the index 11.5% above the July 2006 peak of “Housing Bubble 1” in this millennium, which came to be called “bubble” and “unsustainable” only after it had begun to implode during “Housing Bust 1”:
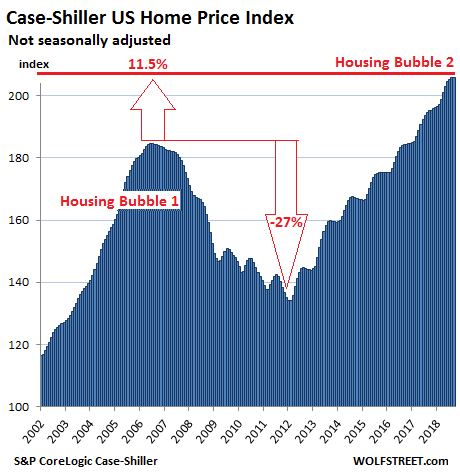
The index is a measure of inflation — not of consumer price inflation but of asset price inflation, specifically house-price inflation. It shows to what extent the dollar is losing purchasing power with regards to buying the same house over time.
The fundamentals of the hottest housing markets around the country have been weakening for months, with declining sales and rising inventories. On the West Coast, this inflection point occurred in July. Prices in those markets, as tracked by the Case-Shiller Index, are gradually reflecting the new reality. But “gradually” is not the right word for formerly piping-hot Seattle, where prices are now dropping at the sharpest rate since Housing Bust 1.
So here are the most splendid housing bubbles in major metro areas in the US:
Seattle:
House prices in the Seattle metro dropped 1.3% in September from prior month, after having dropped 1.6% in August, and 0.5% in July, according to the Case-Shiller Home Price Index. Over those three months, the index dropped 3.5%, the sharpest such decline since December 2011, during Housing Bust 1. So home prices are beginning to unwind a historic spike. The index is now below where it had been in April. This confirms that the inflection point — when the direction changes — was in July and that conditions have deteriorated since.
Over the past 12 months, the index is still up 8.4%, down from the 12.0% year-over-year surge in July. The index is up 30% from the peak of Seattle’s Housing Bubble 1 (July 2007), but that is down from the 35% increase in the July reading:
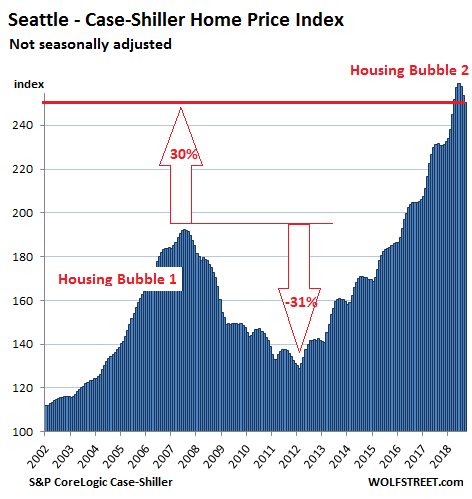
The Case-Shiller Home Price Index is a rolling three-month average; today’s release is for July, August, and September data. Based on “sales pairs,” it compares the sales price of a house in the current month to the prior transaction of the same house years earlier. The index incorporates other factors and formulas to arrive at each data point. Unlike median-price incidences, it does not provide dollar-price levels. It was set at 100 for January 2000; hence, an index value of 200 means prices as tracked by the index have doubled.
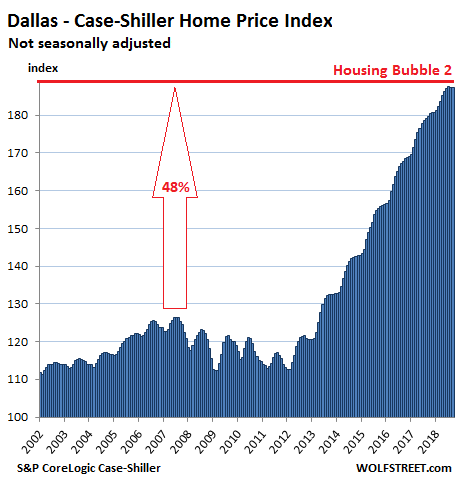
Dallas-Fort Worth:
The Case-Shiller index for the Dallas-Fort Worth metro in September was flat with August and July. This three-month flat spot comes after a glorious run of 54 monthly increases in a row. The index is up 4.3% year-over-year — down from the 5.0% year-over-year increase in July. Since its peak during Housing Bubble 1 in June 2007, the index has surged 48%:
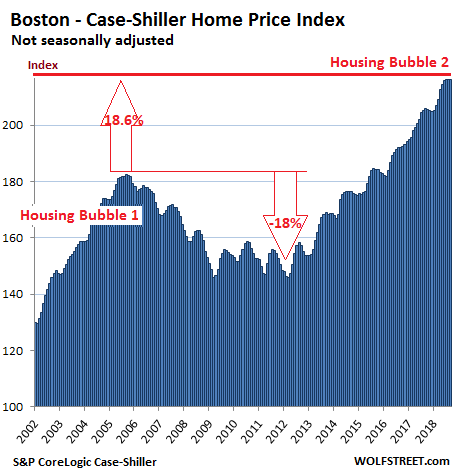
Boston:
House prices in the Boston metro in September were essentially flat on a monthly basis for the fourth month in a row. They remain up 5.0% from a year ago, but that’s down from a 6% year-over-year increase earlier this year. The index exceeds the crazy peak of Housing Bubble 1 by 18.6%:
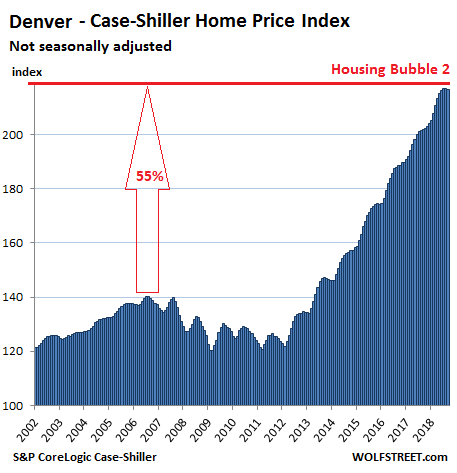
Denver:
Prices in the Denver metro fell in September from August and from July, the second month in a row of declines, after a run of 33 monthly increases in a row. The index is up 7.3% from a year ago (down from an 8.0% pace earlier this year):
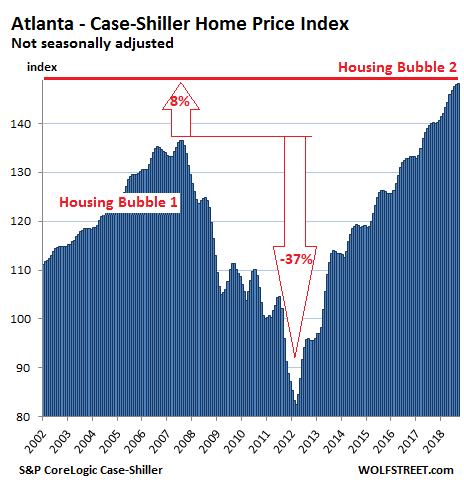
Atlanta:
Atlanta’s Housing Bubble 2 is still on track: The Case-Shiller index for the metro rose 0.2% in September from August, and 5.7% over the 12-month period. Prices exceed the peak of Atlanta’s Housing Bubble 1 in July 2007 by just over 8%:
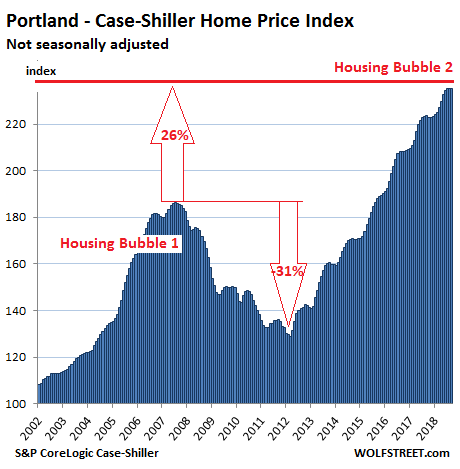
Portland:
The Case-Shiller index for the Portland metro in September edged down again on a monthly basis, the second month in a row of tiny declines. The index is up 5.1% year-over-year (down from the 5.6% pace early in the year) and up 26% from the stupendous peak of Housing Bubble 1 in July 2007:
San Francisco Bay Area:
The San Francisco Bay Area has the malaise too! The Case-Shiller index for “San Francisco” includes five counties: San Francisco, the northern part of Silicon Valley (San Mateo County), part of the East Bay (Alameda and Contra Costa), and part of the North Bay (Marin). In September, the index was flat with August and slightly down from July. It was still up 9.9% from a year ago, but that pace is down from the double-digit gains earlier this year. This index remains 40% above the peak of Housing Bubble 1:
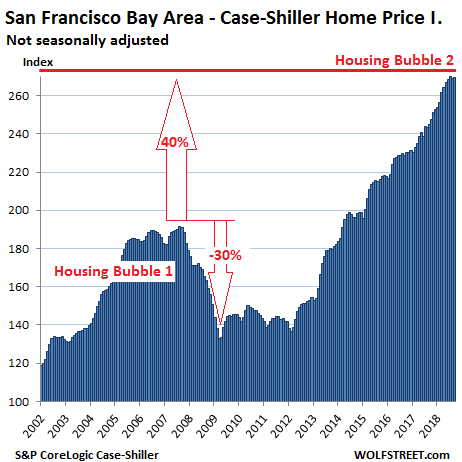
The Case-Shiller index tracks condo prices in the five-county San Francisco Bay Area separately, and this index is now down 0.6% from its peak in June.
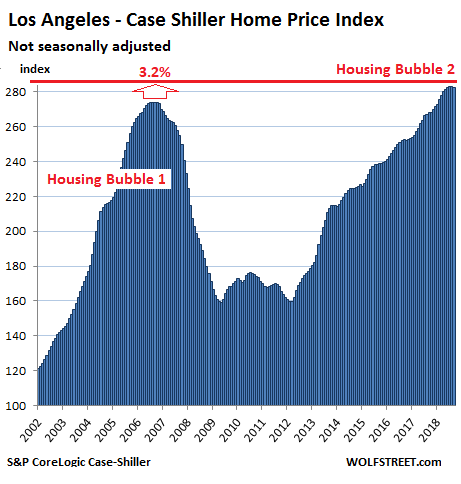
Los Angeles:
House prices in the Los Angeles metro too fell in September from August and are back where they had been in June. The year-over-year gain of 5.5% was down from well over 6% earlier this year. Between January 2000 and July 2006, the index had ballooned 174% before collapsing. The index now exceeds the crazy peak of Housing Bubble 1 by 3.2%:
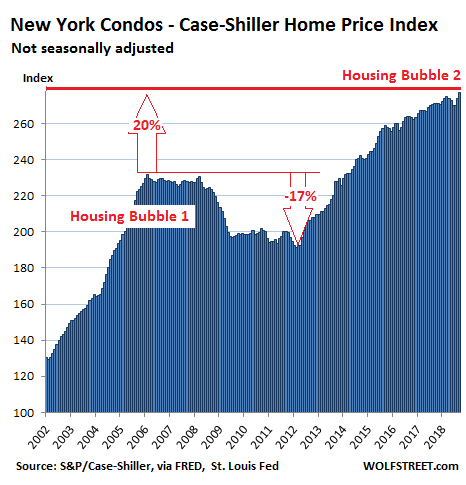
New York City Condos:
Condo prices in the New York City metro jumped 1.2% month-to-month in September, after having jumped 1.3% in August, after several months of declines, according to the Case-Shiller condo index. The September jump pulled the index up 2.3% year-over-year, to a new record, after having been nearly flat on a year-over-year basis two months earlier:
Some markets covered by the Case-Shiller index such as Miami, Las Vegas, and Chicago have not yet reached their highs of Housing Bubble 1, so they don’t yet fit into this theme of the “Most Splendid Housing Bubbles in America.” But other markets that would fit perfectly into the theme, such as the Nashville metro, are not covered by the Case-Shiller data.
The inflection point in the Seattle metro housing market occurred in July. Conditions have deteriorated since. Read... Bubble Trouble: Seattle-Bellevue Metro Housing Market Goes South
Enjoy reading WOLF STREET and want to support it? You can donate. I appreciate it immensely. Click on the mug to find out how:

![]()
Case Shiller is reporting the September data. We all know it’s gotten worse since then. We saw another interest rate increase in September, and the stock market tanked in October. People are feeling a lot more jittery, especially on the West Coast.
Bobber, you’re more right than you realize: the Case-Shiller data is an average of July, August and September, so it’s even more stale.
Also, specifically for the Bay Area, Wolf and others have documented that stock prices drive real estate prices, since a large fraction of buyers get their down-payments (or cash payments) from stock option compensation or appreciation. I expect this affects Seattle as well and would correlate with performance of Amazon, Microsoft, Boeing etc. from that area.
Amazon stock is down about 23% from its peak price on September 4th. I think that’s also putting the fear of god into Seattle lemmings – I mean homebuyers.
I’m really, really interested in seeing what happens this coming spring. I predict a flood of listings as sellers (correctly) recognize this cycle’s top.
Actually, July, August, and September rolling 3-month average. The lag is around 2 months, compared to MLS data. And MLS data lags real time. So yes, what we experience today is already quite a bit different from what is in the data.
It’s official, Powell announced today he is a dove and the easy money spigot will open wide and continue to feed inflated house prices.
Powell stuck his ugly camel nose inside the tent. Did you guys honestly believe the U.S. would pay it’s bills by collecting taxes, now that’s hilarious, the Fed will do it’s job and monetize our debts.
The current, so called, “tightening cycle” got the FFR barely above 2%. In the past, 2% would have been an emergency policy rate resorted to only in the depths of a recession. Now 2% represents the end of the current tightening cycle as Powell has proclaimed we have achieved a “neutral rate”
With the economy running red hot and inflation continuing to worsen Powell shows his true colors and conviction. Powell is neither a hawk nor a dove, he is a different bird altogether, like so many before him Powell is a spineless chicken, his only concern is to not get blamed for pricking Bernanke’s bubble.
You were lied to, yet again, the dollar is on the express bus to zero. Fool me once shame on you (Fed), but fool me four times in eight years… not gonna happen.
Powell = Trump’s easy money, inflation, lap dog.
Fantastic. It’s akin to the relief one gets after a fever breaks.
Breaks, yes… But did you mean to write “fever” or “dysentery”?
New York City real estate is experiencing a mini boom due to the Amazon deal. It seems there has been insider trading of real estate in anticipation of the deal. I think I read apts are being sold in bulk.
that would make sense especially because the amazon h2 will be the epicenter of recent condo development. i imagine there has been a lot of flipping of unoccupied new construction.
Denver is kind of a microcosm of the overall economy: i.e. overall unemployment is low with high numbers of openings; however, many jobs simply do not pay enough to keep up with the cost of living.
How this ends is hard to predict: will there eventually be a correction that drops prices more in line in with reality, or is Denver becoming the San Francisco of the Rockies?
In sheer dollar amounts, much of Denver isn’t as pricey as the Bay Area, though Boulder seems to be catching up, but when incomes are factored in, affordability is a real issue.
Denver was, at one point, on the list for possible Amazon headquarters. Though sites it may not be politically correct to say, I’m glad Denver lost out because it would have exacerbated the current affordability problem.
Employers have 2 options, train unskilled labor and invest more in manpower that way or raise compensation to draw more skilled employees from the current pool. Longer term the higher salaries drive individual investment in that field to increase the pool but that is a multi year delay to implement and compensation has not increased significantly yet.
Either way housing prices will not drop unless the labor pool stays the same or grows while the compensated demand drops enough to create an oversupply of labor and therefore reduces the available equity available for investment in housing and services.
the “jobs” are fake, a chimera, a fraud…theyre real jobs, but theyre 100% neo-feudal.
you got guys like former NFL QB peyton manning who owns at least half of all the papa john’s franchises in colorado. Just 1 guy. This was the real reason manning chose to go to denver to play, becuase of the papa john’s deal (and $40million for 2 years to play football for the broncos).
then you got guys like former NFL WR Keeshawn Johnson who owns all the panera franchises west of the Mississippi. ok? again just 1 guy (or family or small group).
an hour south of Denver, in Lone Tree you have loads of these types of stores, all open, all nearly empty getting very little demand in business.
All of them got at most, 2 on-shift employees, and they just sit there and lose money year after year.
And when new developments are getting zoned like south of lone tree in Castle Rock/Pines etc, before the plans are even laid, those corporate crap stores like papa johns, paneras, chipotles, jimmy johns etc are all-in before the small mom and pop guy can get his foot in (even if he did there is little business in the first 10 years of a brand new development, so small mom and pop dont have the money, timeline or risk appetite).
Its essentially a tax scam.
what youre observing and describing is the financilized never-ending greed of elites.
I don’t see how home prices in America can increase.
With the lowering of the immigration numbers and the
tiny birthrate only the very popular cities that suck
in domestic migration will show price growth.
Immigration doesn’t have much to do with home prices in the modern world.
Home prices are high because of investor money, and the problem is generally that neither locals nor immigrants can afford it.
That being said, the bond and stock markets are what to watch for in predicting home prices.
In the world of modern central banking, all investment assets tend to move together based on capital flows and the centralized decisions to ease or tighten financial conditions for the wealthy.
“Home prices are high because of investor money”
Accomodative (as in ZIRP and NIRP) monetary policy by the Fed and other central bankers along with outflows from China probably helped things along.
Also helping fuel the demand was the constant bombarding of the message that owning a house is part of American Dream. All is part of an orchestrated strategy of fuelling demand for housing due to its multiplier effect on the economy.
Not to forget the need for perpetual growth, bringing forward the demand (not only for housing but for all things) and creating a wealth effect that will trickle down.
All the above shows a lack of common sense (IMO, you do not need a doctorate in economics to understand that pulling forward the demand continuously would lead to increase in price today and a demand vacuum tomorrow), meddling tendencies and a smugness that an economy can be made to do the bidding by the central bankers.
“Also helping fuel the demand was the constant bombarding of the message that owning a house is part of American Dream. ”
No. Everyone has to live somewhere. Renters live in a building owned by someone (even if not them). Demand for housing has nothing to do with the American Dream and everything to do with population and household size – not messaging. Household size depends on economic factors and is forced upwards wherever the number of available housing units is too small for the population. Idle housing “investments” are wasted money from a holistic since a larger supply would reduce prices, and inexpensive housing implies a higher average standard of living.
The price of houses is very easy to predict. “They” will raise prices until they will transfer your next 30 year income into their hands in the form of cash while you hold the house and the bank hold the mortgage paper. So as long as you can still have some borrowing capability, the house price will keep rising. Why the price hasn’t dropped yet? Because they have NOT successfully transferred MY next 30 year earning yet. When I take out a bigger loan for a bigger house, I will let you know. Then house price will fall. This is NOT supply/demand, this is “THEY” take something necessary to “YOU” and ask you for your next 30 year income.
Portland OR has been a hot market for quite a while, and I think even our time has come. A $525k property I was watching just dropped $65k. Sold quick after that, but it took a huge cut to move it. And that was a nice place in a HOT neighborhood. Portland’s new “tenant rights” laws may be a factor in this case since it was a duplex, but big price-drops and 60 day listing times are a regular thing now.
Off-topic for this thread, but of interest to all who oppose usury and “modern bank robbery” (where the innocent get robbed by the banks) – Bloomberg had a fantastic article last week on small-businesses getting destroyed by predatory “cash advance” lenders, after being bamboozled into pre-signing “confessions of judgment”:
https://www.bloomberg.com/graphics/2018-confessions-of-judgment/?srnd=premium
The story even includes after-the-fact documentation fraud by the lenders, because once your borrower has signed away any right to defend themselves, who’s gonna check the paperwork?
Beware: This article may trigger unpleasant flashbacks to the days of NINJA loans and robosigners…
I can’t believe the legal system itself hasn’t stood up and gotten the legislature to ban a practice that is so obviously unjust. But I guess justice isn’t their job…
It won’t end until the whole system is overturned.
The corruption is to the core.
Wisdom Seeker, reading that story has me physically sick. Somebody needs to take those evil people out!!
Give me the printer of money and I shall NOT care who makes the law
That is an excellent article! Scary stuff, too.
“I can’t believe the legal system itself hasn’t stood up and gotten the legislature to ban a practice that is so obviously unjust”
there in on the swindle…..too much money to be made by the too few in charge…..same as it ever was.
exaclty, yet, you got people with full blinders on, putting the blame 100% on the fed, governments and politicians, which in my mind lets wallstreet and industries off the hook and misses the trees for the forest.
This is all about Greed. That’s it. Period.
Wolf:
“inflection point — when the direction changes”
Strictly speaking, the inflection point is where the concavity changes, not direction
Is it time to go all in on preconstruction condo’s on the Salton Sea?
used to be some fun corvina fishing there in the 80’s….don’t know if same now…it was hot as hell fishing….
IMO, what drove Bubble v2 wasn’t low interest rates, but the introduction of the “Conventional 97” in 2013 (you can include 100% USDA/VA mortgages in there as well). With the 97, it was possible to climb the property ladder with a lot less equity, accelerating the price increases in Bubble v2 (which I think is why so many areas overshot 2008).
With such a small equity cushion, these buyers will not be able to absorb the upcoming price decline, accelerating the descent…
Yes, but, those loans were still no comparison to the programs that were popular in 2004-2007.
Night n day difference.
“Conventional 97” — I didn’t realize that Fannie Mae and Freddie Mac were both buying these loans.
3% down. Homebuyers using these loans are more leveraged than Lehman at its collapse. Meanwhile, many markets are at all-time highs. Amazing corruption.
You guys need to take it easy on this conventional 97 program.
Maximum loan amount over the years has been around 400k. So, no one was buying 500k to 1 mil houses with only 3% down conventional.
Also don’t forget all these loans you must income qualify.
No, I’m not implying that conventional 97 is based on fraud. I’m just stating the fact that when ANY barrier to market is removed (here, 20% down payment), you more buyers, and the entire demand curve shifts forward, which naturally results in price increases, especially when inventory is tight.
I would think proper evaluation of a person’s debt to income goes a long way. If you can afford to carry a place underwater a lot of people will.
Not sure how our underwriting standards compare to before. The small mortgage banks seem really eager to qualify people for loans…
Ranger,
I think you are correct in that income is the main factor to determine whether a person will default on a loan.
After the crash in 2008 they ran actuarial tables and discovered that it was not the lack of down payment that caused the foreclosure or walk away event it was the lack of verifiable income and the job loss.
Of course it is nice for someone to have a lot of skin in the game however the drop in equity will not immediately cause a default it is the debt versus income.
I’m not too sure how loans were written pre 2002 as that is when I got into the business so I can only comment from then on.
What is the compounded return on the Case Schiller from 2002 to 2018? I would guess 4%. Can someone do the math?
I think it is safe to conclude that real estate prices go in cycles, and that to properly call it a bubble, it would be nice to see a real bubble bursting, say a 50-70% decline, but this just doesn’t seem to happen. Bitcoin was a bubble, and internet stocks in 2000 was as well, but real estate, even after the worst bear market since the Great Depression, just can’t be called a bubble. A bubble pops, but real estate exhales, getting ready to breathe again. As Sam Zell once said, as long as people keep reproducing, there will be a demand for real estate.
Can we agree to use a term other than bubble? It is too dramatic, and gives false hope to potential buyers looking for a huge sudden decline that never seems to materialize.
Do you think that this rapid run-up in house prices is even remotely normal, or eerily similar to housing bubble 1.0? Do you think the Fed did or did not do everything in it’s power, and then some (unprecedented or not) to reflate housing and stocks after the GFC? We are SO far from free markets and sound money that I’m feeling like this is life in a Salvador Dali painting.
Housing bubble 2.0 is but one part of “The Everything Bubble”, thanks to central bank stimulus via various and sordid machinations. BTW, asset bubbles have been shown, much like socialism, to not end well. Now, if Stocks, Bonds, RRE, CRE ,Leveraged Loans, Art, etc. all deflate in roughly the same time frame, what happens to the global economy? That couldn’t happen, right?
If the shoe fits…
The “duck test”: “if it looks like a duck and walks like a duck, it is a duck.”
https://www.investopedia.com/articles/stocks/10/5-steps-of-a-bubble.asp
5 Steps Of A Bubble By Investopedia Staff
“Minsky identified five stages in a typical credit cycle – displacement, boom, euphoria, profit taking and panic. Although there are various interpretations of the cycle, the general pattern of bubble activity remains fairly consistent.”
Quack!
Not just due to CB stimulus – due to usurious, reckless lending practices and unlimited greed and exploitation in the private world of finance (which of course led to the events of 08 requiring extraordinary CB measures in the first place…)
As long as people like you continue to point the finger only at what you see as ‘state intervention’, and totally fail to acknowledge that deregulation and rapacious greed (which will only ever be reined in by regulation) play a massive part in our problems, nothing sadly will change.
From “Google”:
“The federal government now invests or insures over 90 percent of mortgages in the US via Fannie Mae, Freddie Mac and Ginnie Mae.” These are GSE’s. Not private Cos.
What about the 0-3% down mortgages from FHFA (97-100 LTV)? At least Mel Watt will be out in Jan.
Other than the sales people, exactly what part of the U.S. housing industry is private sector (vs. public sector)? Think GM and you’d not be far wrong.
BTW: This bubble and the last three are almost exclusively due to fast and loose policies at the Fed and other central banks. Certainly Wall St. gets their cut from first access to cheap $, but the blame for 21st century bubbles (x3 now) falls squarely on the Fed and Federal Gov’t. policies.
“it would be nice to see a real bubble bursting, say a 50-70% decline, but this just doesn’t seem to happen.”
It does not because it will not be allowed. If necessary, the Fed will come up with all the Acronym money that they conjure up!
Home prices should be seen in relationship to household income. So if home prices rise 4% per year on average, for 18 years, and if household income rises 2% per year over the same period, you will have a huge bubble after 18 years.
In other words, if the median household income can pay can for a median home, the market is in good shape. When only the top 20% of households can afford to buy a median home, the market is in a bubble that will eventually self-correct.
Median = midpoint where half are over and half are under.
Thank you for posting my comment. Yes, the long-term/historical house price to income ratio is 3:1. Anything else will (eventually) mean-revert (applies to lower or higher ratio values). This process can take longer in a centrally planned, command economy, with frequent and massive interventions, etc.
Wolf,
Take a look at this: http://www.usdebtclock.org/index.html#
It shows the median income and median house cost now and in 2000. Basically income is up $1K and house prices have doubled.
Year 2000:
median income ~31K, median house price ~168K, 5.4 : 1 ratio
Now in sort of real time:
median income ~32K, median house price ~332K, 10.3 : 1 ratio
Also look at the median unfurnished apartment rent cost.
https://www.statista.com/statistics/200223/median-apartment-rent-in-the-us-since-1980/
2000 – 848 per month or 10,176 per annum
2017 – 1492 per month or 17,904 per annum
2000 – median income is 3.04 times annual rent
2017 – median income is 1.78 times annual rent
Petunia, better check those numbers…
I suspect their median income figure is inflation-adjusted but the median house price isn’t.
If so, then the comparison you are making is not valid.
Same goes for you, IdahoPotato.
Make sure you are using either all real figures or all nominal figures. You can’t mix and match.
Petunia,
I think the debtclock uses inflation adjusted “real” income and nominal (not-inflation adjusted) house prices. On a nominal basis, household income has come up a lot from 2000.
So it would be better to compare nominal household income and nominal house prices. That said, since 2000, nominal house prices have still outrun nominal household income. Now dig deeper by layer. Nominal income at the bottom 60% has increased a lot less than at the top. And that’s where the real problems are.
The “base” Case-Shiller is an index of nominal, not real prices. Looking at a graph of Case-Shiller adjusted to income or inflation over time then I think there is a strong case to be made that the 2007 housing crisis and subsequent collapse can indeed be termed a “bubble”. Before and after home prices have gone into significant over and under valuations cycles which yeah, probably don’t merit the moniker of “bubble”. Here is a graph:
https://i0.wp.com/inflationdata.com/articles/wp-content/uploads/2013/06/Inflation-Adj-Housing-Prices.jpg?ssl=1
Thanks Max, I think both the nominal and real versions are useful to get perspective.
Wendy –
The threshold for “bubble” in a market depends on the leverage used. Since real-estate buyers typically put only 20% down, they are leveraged 4:1, and wiped out by even a 20% decline. There’s no need for 50-70% drops to wipe people out and induce widespread panic, so the threshold for “bubble” conditions is lower.
Also, and more important, all real estate is local. But a national average blends together “bubbly” regions and bubble-resistant areas, so it doesn’t show the size of the local bubbles. The 2005-2009 decline included 80% drops in many locations. I’m specifically aware of situations in California, Arizona and Nevada (Vegas).
Prices are definitely coming down. I keep a close eye on SF and my Trulia updates now recommend five 2 bedroom condos from $1 – $1.3 million. Condos of similar quality were not under $1.5 million just a few months ago. Monthly payment on that amount including taxes and insurance and HOA (assuming 20% down) is still about $1.5K – $2.5K above rental parity.
I think the Fed will do their December rate hike and then blink in 2019. That might be the time to buy because once they blink they prices will to some extent go right back up. With all the whining I can’t ever see the Fed truly letting the bubble deflate, until they can’t stop it and there is a massive crash.
Of course prices are coming down. Transactions are dropping, and that means builder income is drying up. They have to turn deals to make payroll.
Same with ordinary sellers. I see lots of empty homes in the listings. Sellers have to absorb duplicate living expenses when they move to a new location. That gets expensive really fast. They drop prices to reduce the pain.
However, prices have a long way to drop before they get into the reasonable zone. Frankly, I see more buyers continuing to walk away from the market. Views on real estate sites seem to be way down.
Chris Martenson had a very informative podcast yesterday with Ben Jones of the Housing Bubble blog: https://www.peakprosperity.com/podcast/114566/ben-jones-housing-bubble-popping-right-now
One highlight in the podcast is when Jones explains how to profit from the pending housing collapse by buying property at a deep discount in distressed sales.
If Mr Martenson believes there will be a “housing collapse”, he’s bound to walk away disappointed and possibly a few dollars short.
If Mr Martenson believes this will be a long (5 years? 10 years?) slide into considerably lower absolute values with occasional upward spikes in some specific markets (see Japan), that’s another matter.
At one point in the podcast, Jones mentions how in the last housing bubble, 70% of loans were gov’t guaranteed, while now it’s over 90%. That should tell us something. It’s a government-backed housing bubble! Thanks Fan and Fred, now we know who you really work for.
It’s a government backed bubble alright but much more so thanks to the Fed rather than the GSEs. The GSEs have pretty stringent underwriting requirements. The housing market meltdown of the late 2000s was principally the result of the mass failure of the non-guaranteed sector of the mortgage market which was rife with all sorts of fraud and shenanigans.
David Horowitz, thank you for the link.
It says Deflate in the heading though every chart is at a vertiginous apex. If the magnifying glass reveals a little dent, it is still perfectly aligned with the undulating patterns up that meteoric rise.
Unless of course the trend is reversing right now and the article is suggesting some interesting clues in that direction.
I see no deflation on those charts, if anything they look as inflated as it has ever been.
Is Wolf throwing out of the window the moderation of language that made this blog different from the other click bait fear mongers that pollute the internet on daily basis?
I didn’t think the linked webcast is fear mongering. They have useful data in there. The focus is on the historical link between house prices and income, and the fact that this ratio is 11x in some overheated locations. I call this information.
And there it is….cowardly Powell bows down to the disgusting blob in the White House. The crash once Donald Dipsh!t gets done with the economy will be special.
I imagine that the Fed chair thinks that the attention span of the average American is so short that they cannot recall the comments from yesterday would influence the Fed’s actions today. Truly shameless! I guess “moral hazard” is no longer in the Fed’s vocabulary. I’ll bet against the Fed on this one. Their credibility is shot.
No he didn’t. Wall Street is always reading “dovish” into everything the Fed says. According to Wall Street, back in 2016, the Fed would never raise rates above 1%.
Gradual rate hikes will continue until “neutral.” Powell didn’t back off one iota form it. The latest average among Fed heads is 3% for “neutral.” Yeah, rates are pretty close to neutral already, so about three rate hikes away — Dec and two more next year. Then the Fed will look around. If the economy has turned south by then, the rate hikes will stop. If the economy is still strong, the rate hikes will go on, one or two more hikes.
It’s just hilarious how Wall Street twists everything into dovish, always, for three years.
Wolf, saying we are close to neutral is a lot different than what he was saying a few months ago about having a long way to go. I agree they will hike in December and then we will see once the crying starts again. Sounded to me like Powell was laying the groundwork for one more hike and then calling it quits.
The average projection among Fed governors on the FOMC as to where “neutral” is has been around 3% for quite a while.
This is a data point that is published after each press-conference meeting of the FOMC.
There just wasn’t anything new in what Powell said that would change the average projection of “neutral.”
I’ve been having these discussions now for at least two years. It’s just amazing to me how this works.
That said, the surge in stocks makes it easier for the Fed to continue raising rates.
There was no such mention although the algos might have had a different read.
There is this:
“For Economic Club of New York trivia buffs, I will note that the second ever presentation to this club by a Federal Reserve official was about this very topic. The date was March 18, 1929. Weeks before, the Fed had issued a public statement of concern over stock market speculation.”
And:
“Instead of relying on improvised responses after crises strike, policymakers now constantly monitor vulnerabilities and require firms to plan in advance for financial distress, in a framework that lays out solutions in advance during good times.”
There was no direct mention of housing bubble, nor how ZIRP effected the viability of the pension funds.
The banks should be OK when everything else goes south, though.
Neither was there a philosophical discussion of two metrics to which many financial things are anchored and monitored: inflation and real GDP, but who would expect that?
I fall back on the fundamental principle of supply and demand. West coast cities are on the right side of the demographic trends and the demand is strong. For now and the foreseeable future Portland, SF, LA, Seattle and San Diego will be desirable and there will be pressure on housing prices – both to buy and to rent. The primary mechanism to relieve the demand pressure – increasing supply – has been further hampered by the recent phenomenon of increased costs for building materials due to the Trump tariffs and by the dearth of available contractors – which seems to be due to recent catastrophes and a restricted supply of cheap construction labor at the boarder. Simply put, it is now considerably more expensive and time consuming to build than it was two or three years ago. I am getting ready to put a house on the market and was warned by my agent to book the contractors several months in advance of the list date. Housing prices are up in my market and I don’t doubt that there will be a slowdown, but the increased cost of building will mitigate for a slight rise in interest rates. Lastly, I am dubious of the claim that ‘as goes the stock market, so goes the housing market,’ because nobody needs to own Amazon but everyone needs a place to live.
What bubble?
“We see no major asset class, however, where valuations appear far in excess of standard benchmarks”
– Fed Chairman Powell
(Also too, the Medicare and Social Security Trusts funds are the cause of America’s deficits and military spending and tax cuts for the rich are deficit reducers).
That’s from ZeroHedge so take it for what’s worth…