Everyone is talking about the AI bubble – proclaiming it or denying it – but this is what it looks like from the leverage point of view.
By Wolf Richter for WOLF STREET.
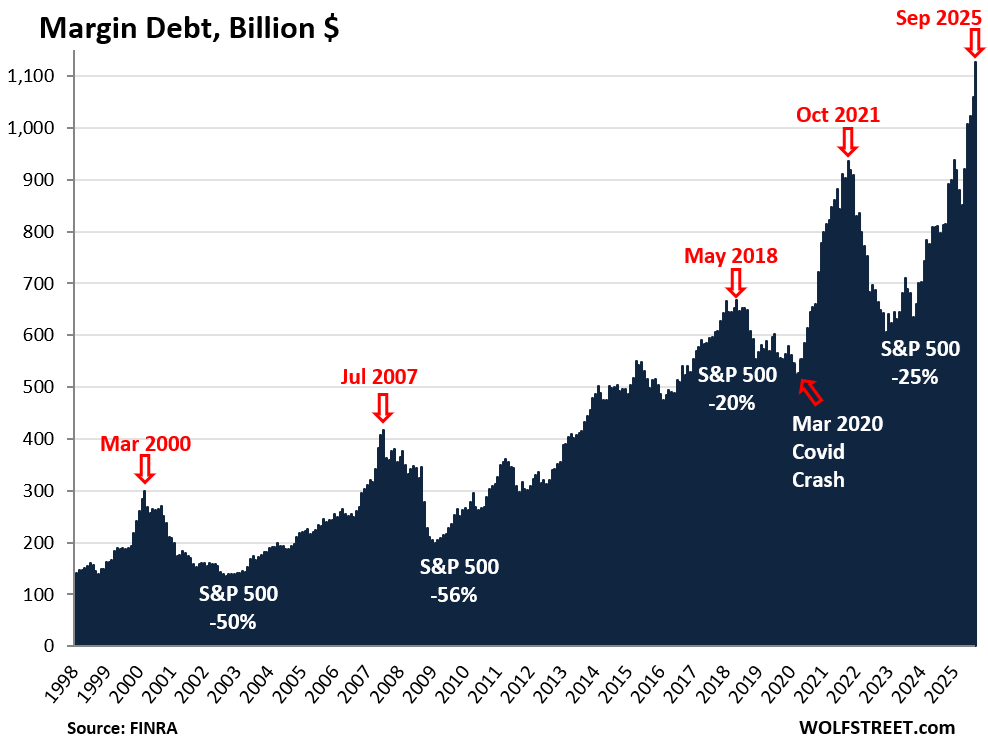
Leverage in the stock market has been spiking since April. In September, margin debt – the amount investors borrowed from their brokers – spiked by another 6.3%, or by $67 billion, from August to a record $1.13 trillion.
Since April, margin debt has spiked by 39%, the biggest five-month increase since October 2021; it was in early November 2021 that stocks began to tank, with the S&P 500 ultimately dropping by 25%.
The additional leverage – borrowed money flowing into the stock market – creates buying pressure and drives stock prices higher. Leverage is the great accelerator on the way up, but it’s also the great accelerator on the way down. Multi-month surges in margin debt, jumping from new high to new high, indicate excessive speculation and risk-taking and have invariably led to sharp selloffs:
Everyone has been talking about the AI bubble, either proclaiming it or denying it – Is it Really Different this Time? – but this is what it looks like from the leverage point of view, and it’s scary: A massive spike in risk-taking and excessive speculation in the stock market, as demonstrated by this multi-month spike in margin debt from record to record, that is creating big vulnerabilities and risks.
In the long-term view of margin debt, such as in the chart above, it’s not the absolute dollar amounts that matter, but the steep spikes in margin debt from new high to new high over a multi-month period.
The annotations in the chart:
March 2000 was the beginning of the Dotcom Bust, during which the S&P 500 fell by 50% and the Nasdaq by 78%.
July 2007 was just before the stock market started turning into the beginning of the Financial Crisis, during which the S&P 500 fell by 56%.
May 2018 was followed by a 20% decline in the S&P 500 by late 2018.
October 2021 led to a 25% decline of the S&P 500.
March 2020 was the Covid crash, caused by investors’ reaction to the pandemic. At the time, leverage was relatively low and had been declining, which was a good thing and protected the market. If leverage had been spiking for five months from record to record before the pandemic, the sell-off would likely have been much more severe.
Enjoy reading WOLF STREET and want to support it? You can donate. I appreciate it immensely. Click on the mug to find out how:

![]()
Let’s see where this will go…all the warning signs are out there plain as day but yet plenty of people treating it like it’s another nothing burger, every single dip follow by twice the velocity of FOMO buy the dip rally, rinse and repeat….guess the lack of any real moral hazard or long term sustain consequences like that of dotcom recently, couple with just buy index funds and you’ll be just fine mentality got us to where we are at now….
This time is different right? hmm…
Pretty much. If you read the investing blogs or forums, you see people say things like “Don’t try to time the market,” “Time in the market is more important than timing the market” or “Just dollar cost average your investments in and don’t worry about valuation.”
Nobody thinks a protracted drawdown is even possible, much less likely. Any crash will be a “flash crash,” and the Fed and Congress will swoop in to fix everything, and the losses will be recovered within a year and then we’ll be back at all-time highs in no time. Anytime after 2013 or so, they’ve been right.
This is the mindset. Psychology is a powerful drug. It will all continue until something happens to break the psychology, and then, look out.
If you have a 20 year timeline, this is fine advice. Even if you bought on the night before the 1929 stock market crash, if you held stocks for 20 years, you still made 3% annually. And that’s literally the worst 20 year period in US history! If you bought at the top in 2000, you still made 7% annually if you held for 20 years.
Precisely. Unless global industrial civilization collapses the line will always go up.
And if it does collapse, you have bigger problems than red in your portfolio.
Your end point is the currently extremely high level in the market. If there is another 50% drawdown, that calculation will look different when recalculated at the bottom of the drawdown.
And if you bought the S&P500 in October 1965 it took till December 1991 to reach the purchase price when adjusting for inflation. Including dividends it still took till 1983 to break even. A lot of ‘VOO and forget’ investors would not be prepared for a performance like that.
Yeah. They’re referring to long term investments. No one is saying that if you need the funds short term. Stick with treasury bonds or CDs if you’re worried about the market volatility or valuations.
An expert Trader’s view:- ” Long Term Investors provide the Traders,the profits they [ the latter ] make”.
Even then, the idea that at any given point people shouldn’t worry about valuations is why we’re in this mess in the first place.
For the 1965 bottom, it recovered by 1983 (when you include dividends), so not trying to time the market and leaving the money in there for a long time is sound advice.
There is a fifth dimension beyond that which is known to man. It is a dimension as vast as space and as timeless as infinity. It is the middle ground between light and shadow, between science and superstition, and it lies between the pit of man’s fears and the summit of his knowledge. This is the dimension of imagination. It is an area which we call “The Twilight Zone”.
haha speaking of twlight zone….current environment do feel like the episode “Eye of the beholder” where the patient wakes up and everyone have pig face and that’s the norm, her with a regular face is considered disfigured…
Feels like the entire retail investing environment are pig face norm and us looking at data, chart, tread carefully are doomers with the regular “disgured” face…new normal I guess..
PI – …redolent of the late George Carlin’s: “…it’s a big club, and you ain’t in it…”.
may we all find a better day.
The asset markets are all seriously overvalued if one were too evaluate the situation from a historical perspective.
Let alone the results experienced by the fall of the most extravagant winners when the market adjusted without the Fed guarantee.
Housing asking prices are too high. The most important people would like too buy a house but they don’t have the monthly income to get a traditional loan.
A QE relic.
Paradox:-
“The weak Fiats are the ones over-valued”
Sounds like the average day and state of mind.
Just new today: OCT 17. For the first CNBC’s FX quotes has a new addition:
USD/ CHF
At least the s&p has some underlying value. What’s the same measure for crypto assets look like?
Whenever posts like these come out in the news the market goes up, is that irony or planning?
Thanks Wolf. It’s charts like these which I only saw after the sell off in 2008. They made me regret not seeing the obvious warning signs of an overvalued stock market.
Not to worry. It will all be saved when Sam Altman’s OpenAI announce 50 Jiggawatt deal with next hyperscaler – Amazon, or Apple, or General Electric.
Altman seems to be the quintessential pitchman who is in a hurry selling a toxic product.
My view of AI capability is that is stupid.
And that it is mathematically predestined to be stupid.
Just like the American population. AI can only mimic.
We must remember that the AI sexual partner is your own hand.
If AI ends up being *only* as stupid as the American population then it’s still good enough to replace them. It’s a pretty low bar – but one that I think is irrelevant because I’m still betting that it’s basically going to work out the same way as crypto: very meh; no real revenue model considering it’s costs (at least not one that’s legal), environmental disaster, but a boon for speculators and criminals.
For details, there’s a Substacker named Edward Zitron who’s been writing about the finances and such around AI for several years now. He seems like the AI equivalent of Wolf. The main difference I can see is that Wolf seems to be doing a better job of holding his sanity together while writing about BS every day – or maybe he just hides it better.
Good Chart, We need to see through the Lens of Margin Debt to Market Cap $1.1T to $63T in MCap ie. 1.7% is much lower than 2.7% in 2007-08…So the Bubble has more Legs to Run :-)
That’s not how it works. You’re abusing the chart. This is how it works, second paragraph under the chart:
“In the long-term view of margin debt, such as in the chart above, it’s not the absolute dollar amounts that matter, but the steep spikes in margin debt from new high to new high over a multi-month period.”
It’s the rate of change from new high to new high that matters.
Well, if zoom in on the most recent 6-9 months by which to consider rate of change vs the entire peak to peak, then this most recent period has a much steeper slope than prior new high to new high tails. In that regard, it definitely seems like we’re in the middle of a euphoria margin debt bubble.
I’m seeing a lot more people starting to point the finger @ private equity as being the nexus of a future credit crunch that triggers some sort of systemic run.
Because the margin debt is directly causing an increase in stock prices (and thus, in market cap), your reasoning is circular.
Thank you for a great article that hints that margin debt is indicative of the euphoria level sensed by the every day people, the dumb money.
To make a profit requires buying stock at a price far below the current price
Forget the vision of the WW2 veterans that would never have supported the current mockery of their sacrifice.
Jose, consider though that the market cap valuations of stocks are current valuations. Those valuations fluctuate and as most readers here have pointed out, represent an extremely bloated bubble. So of course margin debt to market cap is a small fraction. Drop total market cap to $45 trillion and all of a sudden that percent changes to 2.4%.
Brilliant chart. Thanks, Wolf.
Measured as a percentage of market cap, margin loans were —
2.1% in March 2000,
2.8% in July 2007,
2.4% in May 2018,
2.0% in Oct 2021, and
1.7% in Sept 2025.
Source: gurufocus
In line with Wolf’s argument, most of these prior peaks were preceded by a sharp run-up in the margin debt / market cap ratio. The monthly figure was 1.3% in August 2024 (which was the lowest since 1998) but has since risen persistently each month (with one exception — April 2025) to reach 1.7% as of end-September.
Is that 2% line the Crack of Doom? Or should we worry more about the parabolic increase over the past year? Asking these rhetorical questions for a rhetorical friend who discloses that he/she/they is/are still up there dancing the AI lambada.
That’s not how it works. You’re abusing the chart. This is how it works, second paragraph under the chart:
“In the long-term view of margin debt, such as in the chart above, it’s not the absolute dollar amounts that matter, but the steep spikes in margin debt from new high to new high over a multi-month period.“
It’s the rate of change from new high to new high that matters.
Thanks! I was just about to ask this exact question. I’d be curious to see this in graph format. Any idea where to find it?
But that would be a nonsense figure and won’t tell you anything because total leverage of the stock market is not tracked.
The only reason to look at margin debt is the rate of change from new high to new high.
There is a lot more leverage in the stock market than margin debt, but margin debt is the only measure we have that tracks leverage, and so it’s like a thermometer of changes in leverage, which is what we’re talking about here.
Not included in margin debt, for example: Any amounts borrowed outside of brokerage accounts, such as by stock funds borrowing from whoever; Securities-based lending, such as Musk putting up his Tesla shares as collateral (many founders and executives pledge their shares as collateral for all kinds of things); borrowing at the institutional level to buy stocks; etc.
But a key element of bad reporting on stocks (or numbers in general) is a failure to contextualize or to adjust for changes in base numbers.
There are always more crimes in Texas than Vermont because Texas is 50 times larger.
If you measure stock increases or decreases in pure points on the S&P500, you’re always setting new records, because the underlying index is also increasing.
I agree with your point that data is limited, but if I want to understand this data, I want to understand how much of the change is because the economy (and population and GDP etc) is bigger, and how much of the change is on top of all that.
It is, of course, true that the increase in the number itself says something. I just want to know how to contextualize. For example, there’s a big increase from 2012-2014 in that graph that to my eye is indistinguishable from the one from 2016-2018. Why was the latter dangerous and the former not?
and rehypothecation?
cross collateralization?
and what of cryptos being used as collateral / margin?
and the fact that banks dont have required reserves anymore keeps popping in my head.
Came to comments to ask exactly that: Do loans against stocks owned appear in the margin debt? Not just those purchased with borrowed funds.
I can’t imagine how much leverage VCs have against post IPO holdings invested in pre IPO ventures.
I have no idea whether these calculation have any relevance whatsoever, but:
Relative to closest quarter market value of all corporate equities the corresponding numbers would be:
March 1990: 1.431% [$300B vs. $20,970B]
July 2007: 1.519% [$410B vs. $26,986B]
May 2018: 1.339% [$650B vs. $48,554B]
October 2021: 1.212% [$925B vs. $75,868B]
September 2025: 1.113% [$1,130B vs. $99,797B]
Relative to prior year nominal GDP the corresponding numbers would be:
1999: 3.115% [$300B vs. $9,631B]
2006: 2.968% [$410B vs. $13,815B]
2017: 3.314% [$650B vs. $19,612B]
2020: 4.332% [$925B vs. $21,354B]
Now: 3.872% [$1,130B vs. $29,184B]
An interesting comparison is Market Value above divided by GDP above. I kind of Price-to-Sales ratio.
1999: 2.18x
2006: 1.95x
2017: 2.475x
2020: 3.55x
Now: 3.42x
Thanks, those GDP normalized numbers are helpful and better than normalizing by Market Cap which feels like ‘putting the horse before the cart’ in relation to margin debt.
As for your Market Cap to GDP ratios, this is actually a frequently cited metric, in particular the Wilshire 5000 / GDP known as ‘Buffett Indicator’.
But it doesn’t tell you anything. It’s completely irrelevant. You can adjust anything to anything. But what does it tell you?
Margin Debt to Market Cap is an indication of leverage and hence risk,if any.Buffet Indicator shows the relation between the Indexes V Real Economy,again pointing to risk, if any. Of course,Liquidity and the expectation of rate cuts or hikes,have an effect on the Indexes..
“Margin Debt to Market Cap is an indication of leverage”
No, because stock market leverage is much larger than just margin debt. Stock market leverage also includes, in addition to margin debt at brokers, the huge amount of securities based lending (SBL), which I discussed in detail here in the comments above, plus borrowing at the institutional level by funds to buy stocks, including hedge funds, leveraged funds, etc. None of that is tracked, except for margin debt, so we don’t know total stock market leverage. We only know the margin-debt part.
What matters with margin debt is the rate of change from record to record.
I have viewed it as the intersection between the public philosophies of the conservative versus the liberal.
A perfect example of the conflict of everyday life requiring choosing sides.
I thought America was immune,
Isn’t leverage considered a ‘coincidental’ indicator though? It moves with the stock market…
No, it DRIVES the stock market – up and down.
Does this include margin debt used for short selling?
Margin debt includes every dime that any investors borrowed from their brokers in their brokerage account for whatever reason.
Short selling: If you have enough cash in your account to cover the short sale, there is no borrowing of cash, and no margin debt. So if you have $10,000 in cash in your account, and you sell short $1,000 of XYZ, you just borrow the shares and pay the dividends (if any), and your cash balance goes to $11,000 (but you cannot use that $1,000 from the short sale), and there is no margin debt, and you pay no interest. But if you have $10,000 of shares in your account, and no cash, and sell $1,000 of XYZ short, you have margin debt on that short sale, and you pay interest on it.
Not included: Any amounts borrowed outside of brokerage accounts, such as by stock funds borrowing from whoever; Securities-based lending, such as Musk putting up his Tesla shares as collateral (many founders and executives pledge their shares as collateral for all kinds of things); borrowing at the institutional level; etc.
There is a lot more leverage in the stock market than margin debt, but margin debt is the only measure we have that tracks leverage, and so it’s like a thermometer of changes in leverage, which is what we’re talking about here.
Thnx for answering, if not directly.
The question then becomes, how much leverage is driven by institutional betting as opposed to retail? (which was what I was asking)
Most people on Wall Street are too young to have seen 2008 & 2000 depression.
I say Depression as both were very much an economic depression to me. I got cleaned out in both.
The lesson I learned? A fool & his money are soon parted. I was that fool who thought real estate could never go down in 2008. And that fool who invested in Nortel & Cisco in 2000. Boy, did I get that wrong.
This time I’m fully hedged for a crash.
T.I.P.S, I bonds, cash, T-bills, long bonds, ammo, guns, water, land for a garden, every Led Zepplin album & Gadstone flags.
Your jealous, I know.
You are missing gold and silver.
I had all my fillings replaced with gold. Sure, more reactive to hot and cold but when it comes a pair of pliers is all I need to get by.
Lord, lol.
A gold filling fell out. I did retrieve it and my dentist told me that people actually do exchange them for cash. Depending on the gold content it could fetch as much as $50.
Yes, but he has both lead and Led, so he should be OK.
Sac,am with you,some modest investments including in hand metals along with all you list except own land.
That said,have a large track of land with friends with home,am always welcome there as own a portion of it with a home/water source ect. that till the zombies arrive will do well.
I hope we never need preps and just keep using the old ends while supplying the new ends.
Oh,have every Tull album!
same for me but I have Sabbath albums and Pride flags. Also do you know if cocaine goes bad over time?
We’ve never found anyone with enough patience to test this
What, no Grateful Dead albums?
The primary lesson from those events was not to put all your eggs into the SP500. And, to be fair, VOO for life is a common enough sentiment that it is something people have forgotten about, because of the last fifteen years.
Sacramento refugee in Petaluma,
I can see having most but not all of those albums but why no Pink Floyd?
Glen,
Your right.
Pink Floyd & Gold & silver should be on my list too
Question, if you saw and got cleaned out from 2000 “depression”, did you approach 08 thinking this time is different and 00 type event will never happen again? or did it take 2 times in less than a decade to develop your view now?
I do agree with you, youngsters and even old timers forever high in hopium land spoiled by lack of moral harzard and conditioned to think FED got your back no matter what is actively disregarding warning signs out there but it’s getting very very tiring to throw caution at the wind and over the last 5-10 years continue to get eggs throw at our face….Not saying there’s no probability being cautious will be right at the end….but do definitely take a lot of mental effort to do so…
Sac – auxiliary electric power (…those albums won’t play themselves…)? Sufficient woodlot on the land? Bridge provisions until harvest season arrives+future seed, starts, canning capability? Amenable relationships with the neighbors? (…’crashes’ are a matter of degree, I’ll admit, YMM(Wildly)V). Best!
may we all find a better day.
What is it with Americans that think the remedy for a crash or worse is guns and ammo? What value are financials like long bonds if you need a gun to defend your returns? In this imaginary world, who will redeem your bonds? If you expect the collapse of the government, of society, by all means buy ammo. But T Bills, Bonds? Those REQUIRE a functioning economy, like the one you inhabit but you imagine is disposable.
To pursue a possible collapse of society a bit further, the first need would be to re-invent the closest analogy to what used to be: if the government is gone you need to belong to a tribe.
Nick – …perhaps our narrow,mass-entertainment-enshrinement-view of the ‘rugged individualist’, which ignores that enduring societies are a result of wide, but boring, general-cooperation-and-compromise in dealing with the always-messy, self-vexing, often brutal, mundanities of our human natures…
may we all find a better day.
How much, if any, of that margin volume is generated by the banks and brokers themselves?
Margin debt includes every dime that any investors borrowed from their brokers in their brokerage account for whatever reason. It doesn’t include anything else. There is a lot more leverage in the stock market than margin debt, but margin debt is the only measure we have that tracks leverage, and so it’s like a thermometer of changes in leverage, which is what we’re talking about here.
Not included, for example: Any amounts borrowed outside of brokerage accounts, such as by stock funds borrowing from whoever; Securities-based lending, such as Musk putting up his Tesla shares as collateral (many founders and executives pledge their shares as collateral for all kinds of things); borrowing at the institutional level to buy stocks; etc.
The most high profile margin transaction of the last few month is probably Musks purchase of TSLA to the tune of 1 billion USD.
But that’s not included in margin debt because that wasn’t done through a brokerage account. That is part of the stock market leverage that is outside of margin debt. It would likely fall under Securities-Based Lending.
Not included, for example: Any amounts borrowed outside of brokerage accounts, such as by stock funds borrowing from whoever; Securities-based lending, such as Musk putting up his Tesla shares as collateral (many founders and executives pledge their shares as collateral for all kinds of things); borrowing at the institutional level to buy stocks; etc.
There is a lot more leverage in the stock market than margin debt, but margin debt is the only measure we have that tracks leverage, and so it’s like a thermometer of changes in leverage, which is what we’re talking about here.
Does this include leveraged assets like SPXL? Or options?
Margin debt includes every dime that any investors borrowed from their brokers in their brokerage account for whatever reason.
Not included: Any amounts borrowed outside of brokerage accounts, such as by stock funds borrowing from whoever; Securities-based lending, such as Musk putting up his Tesla shares as collateral (many founders and executives pledge their shares as collateral for all kinds of things); borrowing at the institutional level to buy stocks; etc.
There is a lot more leverage in the stock market than margin debt, but margin debt is the only measure we have that tracks leverage, and so it’s like a thermometer of changes in leverage, which is what we’re talking about here.
Haha, this is near four times in a row. Are you using AI to help ;-)
Wolf using Nvidia tech to help moderate… that has to be some kind of top sign? :)
AI-powered comments that all say the same thing because they all use the same AI get the same AI-powered replies. It’s not magic.
I thought I had scrolled up by mistake …
…hm. So AI can be a great, additional brain-convoluting-tool while engaged in serious thinking, though perhaps a great brain-smoothing one when not?
may we all find a better day.
all of this happening with what Powell calls “restrictive” interest rates.
add in Gold doubling in price in a year, new car prices up 25% in 5 years, people racing to cryptos….and all the talk is of cutting.
If this is the time to cut, when is the time to raise rates?
This feels frothy and contrived.
JustAsking,
I am definitely naive in this area but would rather have people invest in companies and get a return on investment rather than taking an ownership stake. Feels like those that need money to grow are forced to give up what they built as no choice. That said, the owner typically do quite well with IPO, regardless of what happens to the company.
Glen – sounds like a ‘new normal’, and now long-passed, paradigm shift…
may we all find a better day.
Hi Wolf,
Thank you for the warning, great article. Some thoughts:
Margin Debt / GDP: currently at 3.7%, nearing all time high of 3.97 of late 2021. Compared against the peaks of 3% (2000) and 2.9% (2008).
Margin debt / Total M cap: on the rise at 1.69 after a near all-time low in 2024 as market valuation growth exceeded margin debt growth in 2022-2024.
Margin debt / US10Y: I’d expect the US10Y rise since 2020 to dampen the the increase, but the opposite is true.
Meanwhile the direct & indirect stock holdings now account for a whopping all time high 45% of financial assets of US Households. Which to me seems concentrated at the top, as the relative amount of households directly holding stocks hasn’t signficantly changed.
In summary, the blow-out valuations are not slowing it, the interest rates are not slowing it, it outgrows gdp growth by far, and folks are more exposed than ever in history. Is that fair to say?
It’s the rate of change from new high to new high that matters.
From the second paragraph under the chart:
“In the long-term view of margin debt, such as in the chart above, it’s not the absolute dollar amounts that matter, but the steep spikes in margin debt from new high to new high over a multi-month period.“
Hi Wolf, thanks for the reply. Yeah I read and agree with that.
I was attempting to highlight that the rate of change has been accelerating despite some indicators pointing in a different direction, which to me makes it seem even more alarming. Folks seem to not in the least be hindered by increasing rates, and seem blind to the already incredibly high valuations.
What a great chart in pictures. And the commentary from Wolf that the key is not the absolute numbers but the parabolic shape.
Option activity is also experiencing a significant rise especially with the proliferation of leveraged etfs . Tqqq maybe one of the largest was created in 2010. Pretty much the bottom of the GFC drop and the start of QE. Impeccable timing to have created a product with leverage with the rise tech money printing era. Manage risk my recommendation .
Draw a graph using “If I had invested $20.67 in the S&P 500 index in 1933, our investment would be nominally worth approximately $465,088.97 in 2025….. Then overlay the decline in the US $ purchasing power due to inflation and money printing until 2025, that being now worth 4.013 % of a 1933 Dollar……. = $18,664
BTW, do this knowing, one oz of Gold was $29.67 in 1933.
I think there is something in that for everyone when you talk about leverage and how completely messed up the World has become when lenders lend fiat into existence
I may just be too old, but I can’t figure out how any money is being made off applications of AI (as opposed to those making out like bandits selling shovels at the gold rush). I expect it all to end in tears.
Not with ChatGPT and so forth but when agents are sold for other reasons they make money and allow companies products to continue to compete. I am a software developer a few years from retirement but already common for developers to use AI such as Claude. Not as good as a human yet but makes them much more productive. I see it like Lyft and Uber who hemorrhaged money to get market share, who unfortunately thought humans could be eliminated quickly but have had to pivot to revenue models now.
Since March of 2023 I have used AI to:
Write filler content for web and product descriptions
Write computer code
Assist in graphic design
and many other random tasks
This is a massive time saver, we’re talking orders of magnitude more production which = $$$$.
Problem is that filler content, design assists and programming eventually gets filled with AI hallucinations and errors that pile up and soon make an unworkable mess, that’s what we’re running into with company after company. They start the same way and think it helps with production and productivity, unfortunately when they go back in over the following weeks and months it turns out the AI was putting out a lot of material that looked good and seemed right at first, but the accumulated subtle errors and imprecisions at many steps quietly built up underneath. Even with very good prompting and seeming careful controls with the content.
And then at some point their whole content or programming base breaks and turns out to have a creeping but eventually massive build-up of issues are too widespread to easily fix. (and often they’ve let go of their programmers and staff who could have caught at least some of it) Then they wind up facing a mountain of costs to clean up the mess the AI was making, in some cases bankrupting them from it. Very little actual ROI and a straight up loss with enormous expenses. And for all this, models are starting to break down from training on their previous made output leading to ever worse AI slop and “Internet weeds” with each case through.
I had to buy tires for my Tesla Y. I told Grok where I lived, mostly freeways etc. i asked it to recommend tires sold at Discount Tire. It gave me 4 choices with pros and cons . I ordered my choice online and had them installed in 2 days .I would otherwise encounter the Paradox of Choice on Tire Rack. Maybe I should have first asked Grok the best way to proceed to buy tires in the first place..Oh well
Great informative chart.
I see the problem, but what does a retired guy do about it?
This is just the leverage that is required to be reported for stocks. Don’t forget all of the leverage in terms of companies taking an equity share for this or that circular dealing that AI companies have been doing. That has also been blowing up. Not to mention a lot of equities are pledged as collateral in other arrangements.
With the risk of “abusing the chart”, it appears that the slope in each subsequent bubble is steeper than the previous. In my mind, Big Money is perfecting the art of pump-and-dump. They fund the economy to the brink and once the little guy takes out a second mortgage to join the fun, they get out leaving him holding the bag then buy his house when he can longer keep up with his extended debt.
I second the sentiments of A Guy. Wolf, do we completely ditch the market at this point? Personally, we are currently about 40% TBills, CD’s, etc.
And I suspect I speak for most of your readers when I say – thanks for all you do!
You need to be aware of the risks, and not brush them off, and figure them into your calculus. Stocks are not risk-free.
Once the little guy understands this, he no longer has to be the little guy.
<– A Former Little Guy
Be interesting to see a margin debt chart overlay with stock prices. Why? To see debt levels when prices turn. What I find interesting is the hump after the break, before it resumes dropping until hitting bottom and turning once again to begin a new climb. The duration seems to be decreasing but is nevertheless present in all the depicted breaks. Guessing next time it will decrease to about $600B (approximate trend line) before turning.
Do they break down where the margin is going anywhere?
My fear is it’s concentrated in the young for whom “investing” has been gamified and pushed so heavily it’s nearly indistinguishable from gambling at a bookmaker.
We know where margin debt is NOT: retirement accounts. 401ks, IRAs, SEP IRAs, Roth IRAs, etc. do not allow margin debt. Margin debt is only in regular brokerage accounts.
which adds to my fear.
It seems extremely easy to get margin on Robinhood, for example.
Funnily enough, if you get tagged as a “pattern daytrader”, they insist you deposit $25K instead of $2K. That seems…problematic.
That may be a regulatory requirement, not a RH thing.
When I worked in the biz in ‘99-‘02 there were endless margin calls (and phone calls too, pleading “Don’t sell my position today, I’ll bring in funds to cover tomorrow!”)
But as Wolf clearly said, it’s not the volume, it’s the rate of change, the spike, that is indicative.
This measure is a thermometer of one measured part of leverage and is indicative only.
We see the spike in 1999 before dotcom, decades before mobile phone trading etc.
We see the spike today.
Northsider, it may be regulatory, but it’s still problematic.
Kenny Logouts, that last leg up the mountain coincides with the growth of the gamification of the stock market.
Thank You for this angle. The posts tell most most do not get it. When was the last time (this time is different) yet I have heard variations of that before.
With risk there should be reward. Where is it at these levels?
Machine trading will not help the volitility when it happens.
Here’s a little lesson. Ask AI “How overpriced was RCA stock in the 1920s?”
Sellers need to be reasonable..For example,
I monitor My neighborhood.
This home at 423 W Monterey Ave 95204 just sold,
From June 2025 to Oct 2025 they dropped it by 70k it then sold quickly.
Sellers understanding reality.
Have a fantastic day !
The notable thing in that listing is that the seller is actually taking a loss. This is important because this is how the declines go. First, the delusional sellers think “I’m going to make 50% on my investment!” Then when it doesn’t sell quickly, they move to “I’m going to make 25% on my investment. Still not bad!”
Then, when reality starts to set in, it’s “I’ll break even after fees. Could have been worse!”
Then, it finally ends at “I’m going to have to bring cash to closing, but better to get out now!”
A lot of fools are going to ride this all the way down.
I looked at that one as well; noted that the seller initially decided that the house was worth 20% more than 4 years ago. And it’s not sold – it’s pending at $10k below the 5/21 purchase price. Curious to see what it actually sells for.
I think the break is finally beginning to happen as sellers who bought 2021-23 are realizing that the will be lucky if they can sell without bringing cash to the table. But there are still wishing prices and flippers as well (e.g. 1020 Oakleaf Way Stockton, CA 95209 bought 6/25 for $300k listed 10/25 for $464k – hey it’s been painted, can lights installed, new “luxury” vinyl plank flooring and new kitchen cabinets (but for $163k they don’t bother to put in a refrigerator )
Hot money burns…
Excellent chart!!
That intersects nicely with things I’m researching about stocked based compensation and stock buybacks — and also the hidden off balance sheet arrangements that hide this wall of debt.
It’s different this time — it’s insanely, systemically dangerous — the hidden leverage in this bubble is vastly underestimated!
From my Google bro:
When margin debt rapidly increases, it can form a feedback loop with stock-based compensation (SBC) and dilution. The cycle begins with increased investor confidence and risk-taking, which inflates stock prices. Higher stock prices make SBC more valuable, providing stronger incentives for employees. However, this also encourages companies to issue more equity, which can dilute shareholder value, especially in a market downturn.
In 2020 when the Fed went QE crazy around the pandemic I thought that the general price level had just jumped 30-40%, and sure enough over the next few years it did. Food, cars, goods. Housing popped almost immediately and then was further juiced by the 3% mortgages for a couple years. I know a lot of people around here think a big housing crash is coming but I truly believe prices will just flatten out until the rest of the economy catches up, including earnings. Down a bit here and there but no 30-50% drop like some are expecting.
Gold is signaling something. What if with $38T in US Federal debt and maybe ten times that globally in all forms, “they” have decided that only another 75-100% price level increase will work to keep the music playing. $38T debt in a $30T economy is much worse than $45T in a $60T economy. And you can either grow or just reprice everything except that fixed debt.
There was a time when $1 gas and $15k cars and $2 hamburgers were normal. Now it’s $3.50, $45k, and $8. What if in 2030 it’s $7.50, 80k and $14? No more value in anything really but just higher numbers. Then the stock market can levitate for a while and S&P 8000+ won’t seem so out of place.
Sometimes I ask myself if I’m just thinking about all of it in the wrong way. With gold at $4200+ and climbing maybe now is one of those times. Gold could be ten thousand an ounce in 2030 with all those other prices way up and somehow it might all make sense.
“Gold is signaling something.”
Yes, MANIA
I look at gold as something you buy and then put away and never sell. Let the beneficiaries of your will decide what to do with it after you found out that you cannot take it with you.
I also look at gold as a trading instrument, buy low sell high. And it’s great for that during a mania because it moves a lot when there is a mania. But as trader, you have to remember the “sell” part.
Gold is a legitimate long-term investment. But it is subject to periodic manias that then collapse, which makes gold very risky unless you intend to hold for a long time and don’t care about the price changes along the way, and don’t need to sell it along the way for whatever reason.
What we now have is a massive, unadulterated, all-out, balls-to-the-wall, FOMO-driven mania.
You can see that in the comments here.
The last mania of that type ended in Sep 2011, and then over the next four years, gold plunged by nearly 50%. People who bought at the peak in 2011 were underwater for nearly a decade. And they earned no interest on it. And they may have had some carrying costs.
Like I said, traders can make a lot of money when there is a mania, but they shouldn’t forget the “sell” part of trading.
Wolf, I’ve been long the yellow metal since 2004 and watch that market intently. I respectfully think you are missing the big picture on it if you think this move is FOMO. Gold is money, everything else is credit said JP Morgan back in the day. Central Banks all over the world have been adding it as reserves to the detriment of the US Treasuries for the past year or so. They aren’t sellers near term I don’t think. We could be looking at a huge global restructuring. It’s happened before.
philm
Your comment is precisely the kind of comment I get in a MANIA. In recent weeks, people have posted hundreds of these kinds of comments. It’s proof that this is a mania. If you sit where I sit, you see it every day. The comments tell me a lot about sentiment, and gold is now in a mania sentiment. All the reasons people concoct why this time it’s different from other manias is proof that this is a mania.
Excellent comment, I also have oodles of gold and silver that will be left to my grandkids when I die to do ever they want. I am extremely ok with that.
Just got to say that that looks pretty scary. The 2000 and 2007 are dwarfed by the size of this one!!!!
Wolf –
Love this chart for, as you call it, a “thermometer” of leverage. You’ve sort of answered this question in other comments by explaining (several times) what it is, and what it is not.
But I’m curious if you know of any other metrics for leverage. This stat is mostly just retail investors taking margin loans to buy more “normal” shares.
But anecdotally, I think it’s clear other forms leverage have accelerated HUGELY and I don’t think most investors (even limiting ourselves to retail investors, to say nothing of increasing institutional leverage) are using standard margin loan leverage as much as they used to. From simply high-beta holdings (NVDA, TSLA, Bitcoin etc). To leveraged ETFs (TQQQ etc) to options (wall street bets crowd) to futures. I think retail investors are increasingly finding other ways to add leverage beyond margin loans.
A 20% decline in the S&P is going to cause a loss much higher than that for even the average investor, and a small but significant percentage are going to get completely wiped out by a mere 20% dip. And note, just a return to the low of 6 months ago would be a 25% drop.
“But I’m curious if you know of any other metrics for leverage.”
No, but I wish there were some.
Securities-based lending (SBL) is a big one. Some banks/brokers disclose it on their balance sheets, while others don’t. And no one tracks it overall since banks/brokers are not required to disclose it. This is leverage that wealthy investors use, often pledging the shares of their own companies, such as Musk pledging Tesla shares to borrow for other stuff. The amounts per investor can be very big, in the billions of dollars.
Occasionally, an SBL deal like that blows up, and then we read about it even on WOLF STREET:
“Citigroup, HSBC, Goldman Sachs, and Nomura had extended Wiese this “securities-based loan” in September 2016. His investment vehicles pledged 628 million of his Steinhoff shares as collateral, at the time worth €3.2 billion.”
https://wolfstreet.com/2017/12/19/margin-debt-backed-by-steinhoff-shares-hits-bofa-citi-hsbc-goldman-bnp/
Great chart. I wouldn’t be surprised to see the mania drive these numbers higher. It seems there is still both excess liquidity and delusion out there. If it ever does come crashing down, boy some people are going to get wiped out.
Yes, there could be another piece to the parabola. It cannot nail down the final month of the binge in advance. We’ll see it when it comes.
Yes.
Call my broker! He won’t answer the phone, dang it!
My computer sell button is not working. It’s froooooozeeeeeen!
That’s what happens when the crowd piles up at the door trying to get out and your crawling over dead bodies.
Wonder how this chart would look if we included TQQQ and other popular leveraged funds. Not sure if leveraged funds count as a “different type” of leverage and have to be treated separately.
TQQQ is not margin debt, nothing to do with it.
There is a lot more leverage in the stock market than margin debt, but margin debt is the only measure we have that tracks leverage, and so it’s like a thermometer of changes in leverage, which is what we’re talking about here.
Not included in margin debt, for example: Any amounts borrowed outside of brokerage accounts, such as by stock funds borrowing from whoever; Securities-based lending, such as Musk putting up his Tesla shares as collateral (many founders and executives pledge their shares as collateral for all kinds of things); borrowing at the institutional level to buy stocks; etc.
I see, thanks for the explanation.
Curious if leverage in personal consumption compares to this at all. There’s been some coverage of the proliferation of buy-now-pay-later offerings to regular consumers, who end up leveraged up on debt.
Wonder if there is a systematic dependence on those loans getting paid back, like there was a systematic dependence on mortgages getting paid back before the financial crisis.
But maybe that leverage is too small to become a systematic problem.
Households have relatively little leverage (government and businesses are the overleveraged entities now)
BNPL is minuscule and is included in “other consumer loans,” the blue line here:
https://wolfstreet.com/2025/08/19/credit-card-delinquencies-balances-burden-credit-limits-and-collections-in-q2-2025/
And BNPL loans are included here along with credit cards:
Many thanks. I did not know that disposable income seems to have skyrocketed since 2022, to keep the debt as % of disposable income flat even as credit card balances have shot up.
In fairness, there may be some “average” vs “median” sort of issues occurring in those graphs, but overall, this is the real reason a recession is unlikely. You need to be over-leveraged in order to have real problems, and individuals just aren’t there. They are not happy, mind you, but social media tends to exaggerate the amount of debt people have or the nature of that debt. Like half of all of that credit card debt is paid in fully every month, which people who post that graph don’t bother to mention.
This is going to end one way – badly.
Anyone who says that this isn’t a bubble is lying to themselves and others.
Protracted drawdowns in stocks and other assets are absolutely possible. The federal government can’t bail everyone out this time.
Act accordingly.
Does the Oct 2021 drop have a relationship to the Russian war on Ukraine in Feb 2022? And the subsequent increase in oil prices, which lead to drop in market and tumbling of the margin?
Should we be expecting a “trigger event” before popping of the bubble and a run on market?
Zero relationship. It was a stock market peak after a crazy run-up. The stock market peak was in mid-November 2021, thereafter stocks tanked for a year.
Looks like the master trading Algo just got new marching orders to change direction. Unless the buy the dippers can come thru today and tomorrow. Technically is the basis, input creates output!
From a conspiracy perspective maybe the recent big down day was front running the hot inflation data leaked to insiders and the china tariff news was just a cover story. We will see this month what the inflation data is. Hot? Or Very Hot?
As a graphic designer and occasional stock picker, these lines look pretty well defined. A correction is due soon.
“…this is what it looks like from the leverage point of view, and it’s scary: A massive spike in risk-taking and excessive speculation in the stock market, as demonstrated by this multi-month spike in margin debt from record to record, that is creating big vulnerabilities and risks.”
When the FED prematurely paused on their rate hikes, I said that the stock market would be making new all time highs. I wish I could find the thread, but you disagreed with me, Wolf. Yet here we are. This bubble is grotesquely insane.
There is a clear link between asset prices and economic growth called the wealth effect. The Fed seemed to enjoy leveraging the wealth effect on the way up. Now, with asset prices at nosebleed levels, they are afraid of what they’ve done. It’s to the point where policy options are extremely limited.
A REVERSE wealth effect will happen when the stimulus music stops. Currently, an AI investment bubble and $2-3T deficits keep the music playing. What will we need tomorrow?
Wolf,
Can you shed your brilliant insight on the current revaluation of gold?
Everyone is mesmerized by possible ‘gains’ and what have you casino speculation
More interesting is the side effect that the USD M0, is starting to be sufficiently backed by the US gold reserves again. With current price of $4200, we are at 20% , the minimum as is deemed good enough for a gold back currency.
Give it a little more and a declaration by shiny-gold-on-display-everywhere-loving bragging Trump that the USD is again backed by gold might very well become a possibility. All it takes is Treasury to revaluate the reserves to current prices.
Your thoughts and what this could mean?
I already said what I think about the current gold situation further up. So I’ll just repeat it:
I look at gold as something you buy and then put away and never sell. Let the beneficiaries of your will decide what to do with it after you found out that you cannot take it with you.
I also look at gold as a trading instrument, buy low sell high. And it’s great for that during a mania because it moves a lot when there is a mania. But as trader, you have to remember the “sell” part.
Gold is a legitimate long-term investment. But it is subject to periodic manias that then collapse, which makes gold very risky unless you intend to hold for a long time and don’t care about the price changes along the way, and don’t need to sell it along the way for whatever reason.
What we now have is a massive, unadulterated, all-out, balls-to-the-wall, FOMO-driven mania.
You can see that in the comments here.
The last mania of that type ended in Sep 2011, and then over the next four years, gold plunged by nearly 50%. People who bought at the peak in 2011 were underwater for nearly a decade. And they earned no interest on it. And they may have had some carrying costs.
Like I said, traders can make a lot of money when there is a mania, but they shouldn’t forget the “sell” part of trading.
I look at me gold as a final form of monetary value in a currency crash,after that tis barter/grow food/survive ect.
I also look at it as a chance if things go very wrong but then get a bit better to have a currency people might(?)have faith in.
I otherwise have it allocated to me best friend(an ex I still love) and her kids in me will along with me other metals(including the brass/copper items).
Sorry for not being clear enough.
My question is absolute not related to the investment, casino and gambling aspect . I don’t care. I don’t gamble.
My question is the implication for the USD.
Because of the revaluation, the bashing of USD paper money by the pet-rock hording crowd becomes less valid ; the value of the Treasury gold reserves increases and with that paper money is better backed by that gold in reserve. It currently stands at 20+% .
Also,Gold was $800 in 1980/’81 and 20 yrs later you could have bought some for under $300 . Core position is fine but, buying at these levels you could be holding those purchases for quite some time to hit a break even point. Even if you bought 5 yrs ago you should be lightening up in my opinion as gold does go thru some very long consolidation periods after a downturn. jmo of course
The US Treasury only own 8,133 metric tonnes of gold which they value at $42.22 per ounce for a total value of around $11 billion. The US federal debt backed by the full faith and credit of the US government is now around $38 trillion and the total value of all assets in the US alone is now more than $100 trillion. Do the math. Gold is of absolutely zero financial relevance and is worth far less than 1% of all assets.
Wolf,
Many thanks. Timely. Especially since there may be a bank in trouble. Fed’s Standing Repo Facility in use the past two days. $6.5 B Wed and $8.35 B today.
Maybe a blip is all this is, maybe not. If there’s no more usage tomorrow, will go with the former.
That “bank in trouble” is stupid-ass clickbait ZH bullshit.
The new SRF is designed to encourage banks to borrow at the Fed and lend to the repo market when repo market rates are higher than the Fed rates. That’s its purpose. The SRF’s job is to keep the repo market rates under control. The Fed has improved the SRF with two auctions a day. The amounts are small, $6 billion, $8 billion a day, the biggest since Covid was on June 30, $11 billion (quarter-end), as repo rates have risen because QT has tightened liquidity, and so banks are making money on the spread, and in the process keep a lid on repo rates. That’s exactly how it is supposed to work, and it’s working. Liquidity is normalizing after 3 years of QT.
I have discussed this here endlessly, starting over a year ago in my Fed articles. And now you drag this stupid-ass clickbait ZH bullshit into here?
UK press reporting two US regional lenders in spotlight: Zions and Western Alliance.
Sure, they have some bad commercial and industrial (C&I) loans. That happens to banks. They didn’t pay attention and got caught. These are big banks with lots of profits and capital, and the loan losses hit their profits, that’s all. The cash was handed out years ago when they made the loan, so this has no funding implications for the banks, but loss implications, and a lower stock price. That’s all. When it comes to banks, the clickbait media is making hay with BS.
We went through the same BS about the CRE loan mess that were supposed to cause the banks to collapse. I crushed this BS manually on a near-daily basis, pointing out that banks’ exposure to CRE was actually fairly small, and sure enough, all that did was dent their profits some, and two years later, not a single bank, larger than minuscule, failed because of bad CRE loans.
Stocks get expensive and the cash pile gets tight, time to borrow. Time to leverage.
“ The additional leverage – borrowed money flowing into the stock market – creates buying pressure and drives stock prices higher”
So I have to borrow more? To afford a few shares?
I can see why this might not end up very well.
And if my stocks drop, I have to put up more cash I don’t have.
Sell,sell,sell!
Climbing the paperwallofworry must be exhausting. 401’s and IRA’s in for a religious experience. Your Index Fund will not save you.
The most experienced and notable investors have gone to cash. Took their massive profits. Most, I’d posit, traded cash for gold.
Cash, metal, property working out quite well for some
When I started seeing more ads from my brokerage firm on how I could make money by lending shares of stocks in my account to “investors” I knew that this time “things are truly different”.
Yes, things are worse than ever.
I guess when the implosion happens and there is no electricity to keep me warm because it is all being used by the artificially unitelligent companies to power their data centers, I can burn all my Benjamin Graham books to keep warm.
Bob B, I hope the data centers don’t start hogging natural gas. I have natural gas for heating and I have electricity for everything else (the electricity could be used for heating). I like having two sources of energy, plus my car can be used for electricity (use an inverter) and heat and air conditioning.
Only the braindead think there will be no stock market crash. The stock market always crashes. We don’t know when, but it will, and it will be nasty, like all crashes. When it starts, retail investors will experience very slow trading, priorities will be for big institutions, meaning it will be tough to get out. Many mutual funds will suspend redemptions (read their prospectuses, they can do this legally). Stay far away from mutual funds. Good luck.
People will once again relearn what overbought means. It’s a “Wile E Coyote Moment”
MW: Dow, S&P 500 and Nasdaq all dive as concerns about bad bank loans spark stock-market selloff
DJIA -0.65%
SPX -0.63%
COMP -0.47%
If the FED lowers its policy rates again, gold will continue to rise. Gold has risen since the 10-yr has fallen from 4.79% to 4.03% while the CPI has risen conterminously. I.e., a declining real-rate of interest fuels gold’s price.
Declining real-rates of interest are fueling gold’s rise.
Gold doesn’t earn any interest and has nothing to do with interest rates of any kind or duration.
Example:
The rate-of-change in the proxy for real-gdp (monetary flows MVt) peaks in July. The rate change in the proxy for inflation (monetary flows MVt) peaks in July. Therefore it should be obvious: interest rates peak in July.
Because interest rates top in July, the exchange value of the dollar should resume it’s decline. A very good time to buy gold!
The “Holy Grail” has no disclaimer.
posted by flow5 at 7:50 AM on 06/29/07
Actually, it becomes more competitive when interest rates are lower as it pays no interest ( so, lower interest rates can indeed be a catalyst for gold rising in price ).
CNBC: PayPal’s crypto partner mints a whopping $300 trillion worth of stablecoins in ‘technical error’!!!
Que up the crytobro who explains how stablecoins will improve the safety of markets via an immutable blockchain, and that, no, it’s not possible to just print them in excess. Watch for the turn where they say this error proves errors can be corrected.
The USD has been abused.
Inflation rates:
2021 – 7%
2022 – 6.5%
2023 – 3.4%
2024 – 2.9%
2025 – 2.9%
Plus, they intend to “look through” any future inflation related to tariffs. If tariffs cause prices to rise 5-10%, the Fed could stand by and watch it happen.
Buying gold was a no-brainer up to this point. Future gains likely won’t be so easy, but a reversal of gold price should be limited as long as deficits are running $2-3T/year, inflation is running hot, and the Fed continues to prioritize the employment part of its mandate.
I have big gains in gold and miners and I’m letting them run. I purchased them as a hedge against monetary debasement, and it’s done well in that regard. If gold drops, I suspect stocks would go down with it, providing option value to my cash holdings.
Between two recent auto- related bankruptcies: Tricolour (used car sales AND financing, lots of subprime) and First Parts (who bought a string of manufacturers, from wipers to plugs) senior lenders look to be stuck with close to a billion in losses. The relevant thing is, none of them had any inkling of this. They came out of the blue, in rapid succession. They have exposure they didn’t know about. Morgan’s Jamie Dimond wondered if it was like cockroaches: there are usually more than you see.
At least there is not that problem with the 40 Billion USD swap for Argentine pesos. No doubts about the status of that credit.
Brain wave! Seriously, how about this: could the US put the arm on new friend Argentina to drop their claim to the Falklands. Relevance to US: this would be a ‘good and valuable consideration’ to the UK, and worth a lot in UK pounds or favours or a mix.
The old banker adage: Bad deals are made in good times.
These investors were chasing yields and closed their eyes. And they got defrauded, according to allegations. Thankfully for the banks, much of the losses are investor moneys not bank moneys.
Very similarly, one of the best comments a bank president said to me is, ‘The worst loans are made in the best times’.
Yes, that’s an old and time-honored banker adage. Very true. The version I know is: Bad deals are made in good times. But bankers keep forgetting it during the good times.
The problem is, we can’t obtain a resolution any better than a couple of years by just observing an increase in a chart. Not unless we develop some quantitative model, such as “a 45% increase in margin within 4 years has always led to a correction”.
And if we could be wrong by up to a couple of years in our selling and hiding, then a lot of people would point out how expensive it would be to miss the final froth, just to avoid losing the final froth! Why not just buy a protective put, a long call plus treasuries, or enter a trailing stop loss order, they reason. Just pick any limited-loss positioning.
And unless the pivot is right around the corner, they’ll be right. We can assign probabilities, but any reasonable chance of another year in the bull market justifies a hedged long stock position. Which is just what we should expect to be doing if we weren’t scared.
Of course, if a pattern existed, people would notice it, bet on it, and create a self-fulfilling prophecy. They’d exit the market before each other, pulling ahead the bear market, and eliminate the pattern. Thus a pattern cannot exist – at least not an easy to play one.
We were talking to the lady at the Woolworth supermarket checkout and she said she was fed up with her job. We asked what she would rather be doing and she said psychology. I suggested she concentrate on investor psychology. (Apparently, it’s now called Behavioral Finance). I think there is a better chance of getting a well-paid job in finance than with retail psychology or real estate psychology.
It’s interesting that Wolf used the word “mania”. This is a psychology issue about herd behavior. Investors have been talking about it since Charles Mackay’s book “Extraordinary Popular Delusions and the Madness of Crowds” (1841). More up to date, there is “Irrational Exuberance” by Robert Shiller about the dot-com bubble and the first housing bubble. We have been here many times before.
graph – …just for fun, throw in Hofer’s ‘The True Believer’…
may we all find a better day.
I heard on the radio that gold is expected to be Australia’s second biggest export by value in 2025/26, behind iron ore and displacing natural gas. I hope the government is taking their share. After all, it’s our dirt being exported.
graph – I was puzzled for a second, then realized it’s a common contemporary misperception of my handle (although I do have a brace of step-nephews residing in Queensland). The ‘(AUS)’ here refers to the ‘Army of the United States’ drafted component (suspended since 1974), vs. the ‘RA’ or ‘Regular Army’ enlisted component of the force. Best to you!
may we all find a better day.
Could this be the ultimate Alfred E. Newman (What me worry?) market moment?
As of today, I’m clean and neat. Gold positions included.
I did much better that S&P500 for two years in row, so no regrets.
We’ll wait and see.
Peace and love …
I’m guessing that stock buybacks also have a big influence on the push to keep stocks high as well. But then with so much profit, what are the big boys going to use it for if not that.