Had a setback. Over 11 million gig workers on unemployment insurance. But four states, including Florida, still can’t process federal PUA claims.
By Wolf Richter for WOLF STREET.
This unemployment crisis is shape-shifting, and some states are still trying to catch up with the torrent of unemployment claims, and some states still haven’t figured out how to process unemployment claims under federal programs, including Florida. And so, after three weeks of improving, the data tracking the unemployment crisis got worse.
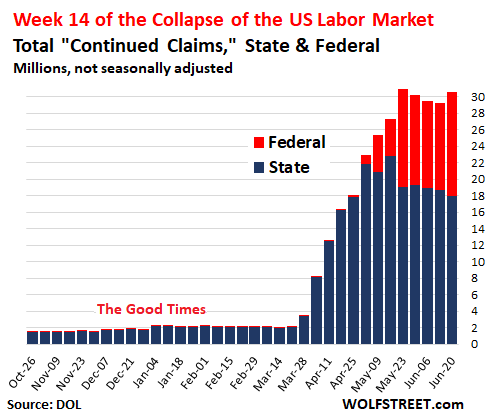
The total number of people who continued to receive unemployment compensation in the week ended June 20 under all state and federal unemployment insurance programs combined, including gig workers, rose to 30.55 million people (not seasonally adjusted), according to Labor Department data this morning. This is up by 1.3 million people from the prior week (29.26 million), and the second-highest ever, just below the record during the week ended May 23. V-shaped recovery not now:
Even while workers in restaurants, bars, retail stores, hotels, hair salons, etc. are getting called back to work, it’s corporate jobs that are getting axed now. Layoffs at small companies happen quietly, and we rarely see them in the news. But layoffs at big companies make the news, such as Macy’s announcement today that it will lay off 3,900 staff in corporate and management areas, even as it’s bringing back store employees. This is one of the ways in which the unemployment crisis is shape-shifting.
Torrent of new state unemployment claims continues.
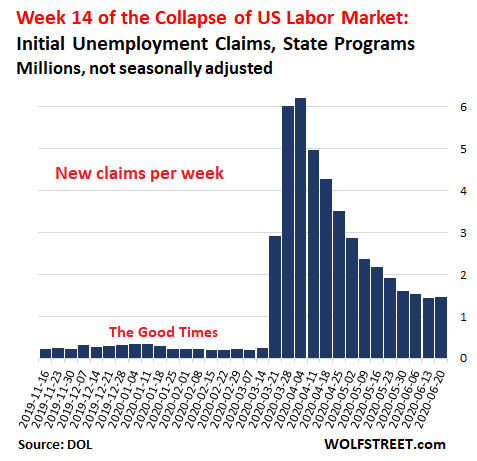
Not seasonally adjusted, 1.457 million initial claims under state programs were processed in the week ended June 20, up from 1.433 million initial claims a week ago. These are newly laid-off people who filed their initial unemployment claims that week. While a fraction of the 6-million range in late March, it is still more than twice the magnitude of the spikes during the prior unemployment crises in 1982 and 2009.
The number of people who continue to claim unemployment benefits after having filed their initial claim under state programs at least a week earlier are considered the “insured unemployed.” These “continued claims” under state programs fell to 17.92 million in the current week (rom 18.65 million in the prior week).
This decline in continued claims under state programs shows that more people who’d received state unemployment benefits were called back to work than people were newly laid off.
Federal programs: continued unemployment soars.
Under Pandemic Unemployment Assistance (PUA), which covers gig workers, 728,120 initial claims were processed by 46 states in the week ending June 20.
Four states still have not figured out how to process these federal claims – down from six states last week. Eventually, they will figure it out, which will boost PUA claims. These four states are:
- Florida
- Georgia
- New Hampshire
- West Virginia.
In total, 11.046 million gig workers continue to receive unemployment compensation for at least one week under the PUA program, up by 1.76 million from 9.374 million a week earlier. Gig workers now account for 36% of total state and federal unemployment rolls.
Under Pandemic Emergency Unemployment Compensation (PEUC), which covers people who have exhausted all rights to regular state and federal unemployment compensation programs, total continued claims fell to 851,983.
But 14 states have not yet processed any claims under the PEUC program, including, Florida.
Other federal unemployment programs include those that cover federal employees (15,339 continued claims) and Newly Discharged Veterans (12,483 continued claims).
Why I use “not seasonally adjusted” data?
I switched to reporting only not-seasonally adjusted data for unemployment claims weeks ago for three reasons:
- Seasonal adjustments were not designed for a crisis of this magnitude, and the results went haywire, with far larger unemployment claims in March and April than realistic.
- The Labor Department revises seasonally adjusted data heavily the following week, and what you reported the prior week is then wrong. Not-seasonally adjusted data is not revised the following week.
- The Labor Department does not seasonally adjust unemployment claims under federal programs (PUA, PEUC, etc.). To add them to state claims, all data must be “not seasonally adjusted.”
What does all this mean?
Despite the deterioration in “continued claims” under state and federal programs, I’m still fairly confident that in sheer numbers of UI claims, the unemployment crisis bottomed out in May. But there are some complicating issues and shifts….
Seasonal factors. A small part of the damage we saw today was due to seasonal factors – meaning they’re real layoffs but they happen every year during this week in June – according to the Labor Department. Based on seasonal factors, the Labor Department “expected” an increase in initial claims of 53,913 from the prior week. The actual increase was 24,346 claims. So in the DOL’s theory, and rounded as it does, this week’s initial state claims showed a seasonally adjusted “28,000” improvement over the prior week. Be that as it may.
The shape-shifting crisis: Retail and restaurant employees, and some hotel employees, are getting called back while corporate jobs are disappearing. This trend will continue. Big companies, including airlines, have already announced layoffs for the coming months.
States and municipalities are slow in laying off people, but the process has started. Budgets are in terrible shape, and everyone is counting on a federal bailout. But layoffs or shortened work hours, or partial furloughs (such as four days a month) are now being worked on around the country. Some of them have already happened. Many of them are well-paid jobs.
Beyond the official Data Chaos: Now there are 30.55 million people officially getting paid unemployment insurance, and they remained unemployed, and they’re looking for a job, according to the DOL today.
There are many people who are eligible for unemployment insurance whose claims have not yet been processed, including by the four states that have not yet processed any PUA claims and the 14 states that have not yet processed any PEUC claims. So the total should be well over 30.55 million people.
If all claims had been processed under all programs, the total on the unemployment rolls might be over 31 million. This would amount to over 19.6% of the labor force. In other words, the unemployment rate based on those on those receiving state or federal UI would be 19.6%.
In addition, there are people who lost their work who are not eligible for any unemployment benefits. And when they’re added to the total unemployed, the unemployment rate goes over 20%.
This is far higher than the nonsense the Bureau of Labor Statistics reported for May (13.3% without error, and over 16% with error). The BLS has simply fallen off the deep end with its unemployment reporting.
The entire market of 3,451 stocks minus the “Giant 5” is down 1% from Jan 2018. But wow, the volatility! You would have been better off with a despicable freaking savings account. Read… Wild Ride to Nowhere Since Jan 2018: What the US Stock Market Looks Like Minus APPL, MSFT, AMZN, GOOG, FB
Enjoy reading WOLF STREET and want to support it? You can donate. I appreciate it immensely. Click on the mug to find out how:

![]()
To be honest, based on all the facts, one thing is certain. The Real Estate will go up. Probably to the Moon and Back.
I’m saying first before a RE.
Dow 700K!!!
Everyone needs to buy now before being priced out forever!
“Even though we are far from seeing an end to the pandemic, home prices are on the rise. Applications for home mortgages shot up 12.7% last week, and according to recent reports from from the National Association of Realtors the pent-up demand for homes combined with historically-low interest rates and a lack of inventory means prices are expected to climb over the next few months…I’ve specialized in selling homes in this area for over 20 years, and I fully appreciate the impact that this Covid-19 situation has had on our market.”
Quote from an email I received on 6/19/20 from a realtor in Cambridge, MA. Could be true for Cambridge, not sure about the rest of “this area”.
San Diego homes in the 500-700 range lasting only days on the market with multiple offer scenarios and bidding wars.
Just wow….
“I’ve specialized in selling homes in this area for over 20 years, and I fully appreciate the impact that this Covid-19 situation has had on our market.”
You know, as long as you’re able to make more money what’s not to appreciate about 140k dead and 30M+ unemployed. real estate agents, please lump them in the same group as greasy used car salesman, loan officers from GFC.
“Even though we are in the middle of a pandemic, home prices are on the rise. Applications for home mortgages shot up 12.7% last week according to a survey we just made up, and according to recent reports from the people who never even saw the last bubble in real estate happening and generally lie about everything, the National Association of Realtors says pent-up demand for homes combined with historically-low interest rates( now in their second decade) and a lack of people willing to sell and go somewhere else to overpay for a roof over their heads, must mean prices for greater fools are expected to climb over the next few months…I’ve been ripping off people in this area for over 20 years by continually asking more and more for essentially older run down crap shacks that any one with an IQ over 1 would know are the largest source of malinvestment a country has ever seen , and I fully hope the impact Covid-19 has on prices only make them go no where but up and up.”
“I am not a crook.” Quote from Richard M. Nixon and freely available by public domain for use as an official campaign slogan by every head of state for the last half-century. For details on the benefits see the pallets of U$ cash in Saddam’s RE-listings site.
SuzeB,
“Applications for home mortgages shot up 12.7% last week,…”
That’s outdated. Yesterday (Jun 24), the MBA published its new reported, and mortgage applications fell 4%.
So the white collar job carnage is starting now. Then you have this Freaking market, so predictable. 1.5M new filed worse than expected and still trying to bounce off from negative today…Let the reality disconnect go on as long as possible.
As for housing, good luck to those people FOMO bought just now because they either don’t think the job loss will affect their high paying white collar job or they got Trust funds to burn through. Either way with so much uncertainty and we’re still barely in the first or second innings , just boggles my mind why someone will want to sign a 15 to 30 years commitment when you can’t even see the landscape 6 months out.
“…just boggles my mind why someone will want to sign a 15 to 30 years commitment when you can’t even see the landscape 6 months out.”
Well, like Evel Knievel was, some people are just adrenaline junkies. If this economy doesn’t qualify as adrenaline raising, I’m not sure what does!
Perhaps you could show us an example of a period where unemployment was 20% and real estate increased in value….. Or is this time different?
Well, real estate has to go up, because if it doesn’t, the end is here. That is, if Anything(stocks, bonds, real estate) goes down in the ponzi economy, TSHTF.
March 26th, 2020, Carlyle Group alumnus Jerome Powell sez……
“there is nothing fundamentally wrong with our economy”
(among other things) …Record levels of private, public, and government debt, record unemployment, record high stock market, record low interest rates (in perpetuity, eff the savers), but yea, nothing “fundamentally wrong with our economy”. I wonder how long before Wall Street rings the dinner bell for another handout. Perfectly normal.
Trump, Powell, Pence, Pelosi, Mcconnell, Schumer, and everyone on Wall Street are parasites. It’s them or us.
Anyone working on a vaccine/medicine against those parasites?
Yes, it is called Socialism.
The vaccine is worse than the disease
I also wonder how much of the work from home thing is just treading water waiting to see how things will develop. I ride my bike through acres and acres of suburban office complexes that are leased by Nike. They are all painted Nike colors , have flags and each building has a name like “just do it.” Since the the first shutdown they have all been completely empty, with only an occasional janitor or window washer. There has been no return trickle of spaced out workers. I am assuming that all these employees are working from home because Nike has not announced any layoffs. Maybe they are waiting to get todays earnings report out of the way before they start the layoffs, but it sure seems strange to me.
As an employee of a company who has multiple buildings empty and all employees working from home, I can give my take on the situation. It’s more likely those buildings will stop being owned/leased by Nike. What companies are finding out is that having their employees working from home is a financial benefit. They move the real estate costs to the employees – their homes. if a company can do business with employees working from home, they can reduce overall costs by cutting real estate costs.
Yes, they are treading water waiting to see how things develop. If work from home works out long term, expect a lot of open commercial real estate.
What? Still no funding for Crapco and Buildco to dismantle the worthless junk piles and start construction of what is needed? Will we beat these swords into plowshares, or just use the metal to make chain link fences to contain the hoards? Bad News II, coming to a theatre near you? Uncertainties are rising. Expectations do not correlate.
Just look at Worldometer. It’s coming back.
How anyone can look at that and not see before your eyes, we have the worst response and worst healthcare system, escapes me. It’s not like it’s even a close call or something. We LEAP off the screen as worst.
That’s why we have to stop all the testing. If we don’t test for it, it’s not there and then we will have the mostest bestest system in everything…like we always knew we did.
That’s why it’s our patriatic duty to go to the malls and shop. Or buy online but still go to malls bucause it’s not there because it’s only showing up becuase too much testing.
We should have never tried to “stop it” in the first place, what hubris.
There is no “stopping it”.
Mr. Knoss,
That’s a moronic statement. No one tried to “stop it.” The strategy has been from day one to SLOW the spread (for very obvious reasons).
The problem with trying to slow it… as we are seeing … is that the task is Sisyphean (i.e. never-ending)
The second governments loosen things, the virus comes screaming back.
Meanwhile, the economy hurtles towards the abyss….
Keep in mind, there is no vaccine for SARS 20 years on.
We are probably already past the point of no return given the number of businesses that have been vapourized.
I too remember, “Two weeks to flatten the curve”.
In my state this became two more weeks, two more weeks, two more weeks, two more weeks… and so on. Weeks turned into months.
This is not healthcare, it is civilization sabotage.
Willy Winky, as we advance our understandings of what was (and still mostly is) an unknown new virus, we can improve the treatments we administer, and, who knows, we might even get a vaccine at some point. And, for a society, what is the point of the whole show if we don’t actually bother to look after each other..?
The simple fact is also that we still don’t know, and we likely won’t know for many years yet what all the effects of infection are. There are e.g. several very serious conditions that have been suggested may evolve years after the original infection occurred.
When it comes to new infectuous diseases that appear we have to be extremely humble in our approach. But as in most things our insufferable arrogance is our weakness.
Agreed on the slowing concept. Now we have to come to realize
1. that ultimately more than half of the human race will ultimately get infected
2. that there is no slightly effective treatment available today, including hospitalization
3.fear of death by virus is exaggerated in the press
I’m not sure what data is being referred to.
The US is on the high side in terms of bad medical outcomes per capita but it’s not the worst in any category in per capita terms as far as I can tell.
Sweden is an interesting case. They only did partial shutdown and public policy response. Their death rates were higher than most European countries, but not as high as the highest.
It is very difficult to analyze the data.
wkevinw,
Death rates in deaths per million pop. Sweden’s rate is rapidly rising, as is the UKs (infamous for its “herd immunity” approach before lockdwon). The UK has already blown past Italy and Spain. Sweden will blow past Italy not long from now:
1 San Marino 1,238
2 Belgium 839
3 Andorra 673
4 UK 637
5 Spain 606
6 Italy 574
7 Sweden 518
8 France 456
9 USA 383
10 Netherlands 356
I have to say these numbers can be misleading. For instance: The Netherlands only counts deaths confirmed as a result of C19 (tested), while Belgium counts all deaths surplus of what was ‘normal’ in former years, as related to C19. Hence the higher number for Belgium. I can’t say anything about the other countries.
Wolf,
One of the problems with numbers like these is that there is no agreed-upon standardized way of counting COVID deaths. For example, in the table you see Belgium having more than twice the number of COVID deaths of the Netherlands, whereas the statistical “excess deaths” registered over that period are comparable in the two countries. This has been the subject of intense debates over here,
The anomaly is largely explained by the difference in counting methods between Belgium and the Netherlands. Whereas Belgium counts every death where COVID is remotely suspected, the Netherlands count only cases where COVID has been officially diagnosed. Source:
https://www.nu.nl/coronavirus/6053011/waarom-het-aantal-coronadoden-in-belgie-zo-groot-is.html
(in Dutch but Google Translate helps)
As long as these huge differences exist, one has to be careful comparing the numbers between countries, as there may easily be a more than 100% plus/minus inaccuracy, so one would be comparing apples and oranges.
As far as I can see, the only way to get a grip on the real differences between countries is by comparing the statistical “excess deaths”, which obviously is only possible after some time. Say, beginning of 2021 for the 2020 numbers.
Until that time, personally, I reserve judgment on how bad- or well countries are doing in combating COVID.
I guess I picked the wrong week to move to San Marino.
Exactly. We have a minimum age, we need a maximum age to run for President.
Did you think up that yourself?
The hospitals in Houston ICU units are currently at 97% capacity, with not testing alleviate that?
The mortality rate here is much better than in the hard hit parts of Europe. It’s true that there are an increasing number of cases. It’s also true that the size of the initial part of the pandemic was vastly undercounted both here and in Europe. You will notice that deaths in the US are still declining even as cases are ramping up.
Wolf it is V-shaped. It just happens to be upside down – /\.
There is a wide range of possibilities between “V” and “h” recoveries.
Don’t forget the Q-shaped recovery
Looks more like a WTF-shaped recovery.
DOD is downsizing, most since Cold War ended, and a reference which goes back to the economy in the 1970s, post Vietnam, post impeachment, post loss of faith in government. Fed lowered rates to offset the unemployment surge. Inflation in RE and gold and gasoline. Where’s Jerry Ford?
You cannot have inflation in gold. Gold is the standard. That statement makes no sense but yes the price of gold in dollar terms will go much higher
Sadly, I think pandemic fatigue has set in and the majority of people are willing to write off 1%-5% of the population.
COVID could get far worse, mainly for the old, but unemployment is a much more imminent threat to the young.
Brings new meaning to the “Generation Gap” concept!
In most jurisdictions the current mortality rate from COVID, measured in deaths/day/million-people, is in the same ballpark as influenza. Some places less, some places worse. We don’t like the flu, but we cope with it ok. But very few people are equipped to cope with a NINJA lifestyle. (No Income, No Job or Assets).
I see it a lot. Comparing the number of deaths by C19 while in lockdown, against the number of deaths by the flu without lockdown. Now start comparing both without lockdown. The numbers for C19 will be horrific.
To add: the rumour of the first case that someone has contracted C19 a second time, after being confirmed as ‘cured’, allready appeared .(@peakprosperity last week)
Don’t know for sure if this is confirmed as true, but if it is true we will hear about more cases pretty soon.
The young and less advantaged will return to work, often in unsafe working conditions. Few people have personal experience with Covid. Gaps on the assembly line, gaps at the bar. Exposure fatigue sets in, you choose work, and forget recreation. Savings rates go up, money velocity goes down. The Fed monetary pump causes the spread to widen until the financial system locks up. Lack of flow equals a liquidity crisis. Money disappears faster than it is printed. Small banks offer competitive deposit rates. Fed gives up on zero bound promises to buy ton of ten years, market front runs them. More jawboning, Fed doesn’t buy debt, until collapse in secondary bond market is complete. Government shuts down again. President writes new stimulus checks, SSN checks are late. Employment surges to pre-virus tight labor market levels, only counting those whose jobs not permanently ended. Quarter of all blacks die; virus, riots, despair. Virus as genocide. Dem candidate chooses Rep as VP to heal the nation.
You realize 2.5% of the population would be 8,750,000 people? Herd immunity way, way, way (technical term…) before that.
The theory of herd immunity is pretty much a sci-fi concept – it may work, it may not. So far the immunity of those infected was marginal at best.
That means your reply is ‘marginal at best’?
If immunity only lasts 3-4 months, herd immunity will never be achieved.
Florida and the three other states have never processed the claims so the unemployed could receive the additional $600 per week? What’s the deal with Florida with their vote counting and bookkeeping? Are they having continual Sun Stroke? Gargling with bleach? Sharknado?
A few years back the state govt in FL fired all their IT workers and hired H1Bs mostly from India. I guess they saved money.
Imbeciles.
This is the entire problem with the misuse of H-1B. The people who deserve the blame aren’t the ones who got the H-1Bs, they are as much victims as the people who lost their jobs. After all, at the end of their tenure, they just get kicked out for the next pool of seekers from India.
It the decision makers who thought this would be a good idea that needs to be fired.
They’re processing claims under state programs (though they may still be behind), and therefore the people getting UI under state programs would get the $600.
What they’re not processing are claims by gig workers and others that are covered under separate federal programs, but not state programs. Over one-third of all continuing claims are by gig workers, and in Florida and three other states, they’re still not getting their money.
Wolf,
For the states that haven’t figured out the Federal portion of the rules, are the unemployed going to get benefits backdated? Because doesn’t that program end in July? (I may be mixing things up here since there seem to be a few different programs)
I certainly should hope so since it would be horribly unfair otherwise.
I hope so. This whole thing is weird. How can a big state like Florida not process these PUA claims three months into the crisis?!
Its all by design. If people can’t file for unemployment then they cannot receive unemployment and this reduces costs for companies. These issues have been noted as far back as 2015.
Its 2020 and Florida is using paper forms.
Even with paper forms, if the state’s unemployment office had been adequately staffed, trained, and equipped before the crisis, it would have been able to catch up with some hiring or transferring of staff.
Using paper forms and, what, quarantining them for 2 months?
Back in the 1970s you could order stuff by paper mail, on paper forms, and expect to receive the shipped product in 6-8 weeks…
Florida can’t even ship a bank credit in 13 weeks… Shame on Florida.
There’s something rotten in Tallahassee!
MCH,
There is no filing due date on PUA claims (at least here in CA). Someone could file tomorrow with a claim start date back in March and the government will make all payments in arrears back to the original claim date (provided the claim is approved). This includes the $600/week bonus for all claims dated from March 29 through July 25.
PUA claims are currently scheduled to end December 31 but this observer fully expects Congress to extend benefits into 2021. Remember after the GFC in 2009? Congress enacted multiple extensions to UI benefits. Ultimately provided insurance to a maximum of 99 weeks.
Well, at least there is a degree of fairness to it then. The problem is that people are going to find out just how hard it is to glue Humpty Dumpty back together after this.
I would say that 2020 is the turning point year in terms of global power balance. The inevitable decline of this country has hit an irreversible point. Brought on mostly by its own efforts.
As to the replacement, that’s going to take decade or more to figure out.
MCH,
Fairness with UI benefits? Depends on one’s definition of ‘fair’.
Each state his its own rules and maximum benefits limit. Here in CA, one cannot survive on basic unemployment insurance. Was a casualty back in 2009 and the maximum weekly benefit amount was a whopping $450/week. On the other coast, NY and MA had max limits more than double that.
Yet here we are over a decade later and the max unemployment insurance benefit in CA remains $450/week. Evidently, inflation doesn’t enter into the equation for the folks at the Employment Development Dept.
This $600/week bonus is unprecedented and explains why so many remain at home on the couch. Minimum wage in CA is currently just $12/hour. So if a burger flipper making the minimum working 40 hours/week lost their job due to the shutdown, CA weekly benefit would be just $240/week. But throw in the extra $600 on top of that and now you’re way ahead of the game. No payroll tax deductions either. Pretty sweet deal. Expires July 25, unless Congress extends.
But what’s fair about PUA benefits? None of these gig workers has paid a dime in unemployment insurance premiums yet they too get basic benefits plus the $600/week bonus.
As usual, our feral leaders inside the Beltway do everything they possibly can to destroy small business owners.
Wolf,
Thanks for the weekly update. I went through the GFC in Florida and the media never talked about the millions unemployed in Florida. They only mentioned them when benefits were extended, even though, almost nobody qualified for the benefits, we didn’t. It was a truly terrible time and the worst affected were barely acknowledged. This is why I started commenting, because the news about people like me wasn’t getting out.
Time to take it to the streets.
Petunia,
As I mentioned elsewhere here, I just don’t understand how a big state like Florida can be so lackadaisical in processing unemployment claims — especially under the federal PUA program, which Florida doesn’t even pay for. Paying the unemployed is good for the economy and local businesses and landlords and taxes. It just doesn’t make sense.
That’s in addition to the personal/family trauma that not receiving unemployment benefits can cause.
Not receiving Unemployment benefits can in some cases be a plus.It forces you to get serious and find work whereas being tied to a benefits program can make people lethargic and unmotivated. I realize that isn’t always the case but I think you get my point
I’d be getting serious not just about finding work, but about voting out every incumbent on the ballot in November.
Are you speaking from personal experience?
Maybe somewhere in Denmark or Sweden it is true, but not in the USA for sure
Wolf,
Florida has been totally controlled by Republicans since 1996 – state House, Senate, and Governor. They don’t want any of that tax money spent on freeloaders, er, the unemployed. All those old retired people living in Florida who keep voting Republican have got their unemployment pay for life – Social Security – from the Federal guvmint.
Gandalf,
Yes, almost totally since ’96 is true, but that is not all of the story: FL has been a very corrupt state for a lot longer than that, no matter which party was in office or in control.
When asked why the mobile home industry was able to get away with such incredibly easy construction code for so many years, the guy who started the contractor licensing program in FL told me that back in the 50-60s, that industry installed 8 new ”doublewides” in a square in tally each time the legislature was in session so the state reps and senators could and did go there 24/7 and get ANYTHING they wanted, and all totally free!
Read almost anything by Hiaasen to find out more about the incredible ownership of FL guv mint by the developers, or John D. MacDonald for an older take on the subject, both right on the money!!
Despite Tech getting all the glory, the biggest drivers of employment growth across the U.S. since the 2008 crash has been the health care industry , partially driven by Obamacare and the higher education sector driven by government backed student loans. Both these sectors are facing huge headwinds in the Covid crisis and will certainly see growing job losses for some time to come.
Also driven by the huge number of aging boomers with lots of money to fleece. I imagine Healthcare in America is a racket. I’m so glad to be out of that stress mill
Fleece costs a lot of money these days!
Healthcare will be fine, it’s an unregulated racket where they just say “give us all your money or you die.”
The only thing that can stop the healthcare monopoly is socialized medicine. But that won’t happen in time for boomers. For boomers it’s just highway robbery where they hold your life hostage and then give you the “freedom” to pay them whatever they demand.
Unregulated? You don’t know anything about healthcare, it is the most regulated industry of it’s size by far.
The stock market goes up because the Trump nightmare will soon end.
These clowns are going all out to ensure this bubble will be the biggest you have ever seen in your lifetime. Volcker rule just relaxed so now banks can do more more of their funny business, things that brought us to the grind before GFC…good times, I mean what can go wrong with that? At this point, why even have the SEC? They have been toothless all these years anyway…let’s just disband SEC and disguise it as ultimate freedom for the people and in the good spirit of self regulation of wall street, cause we all know how well self regulation or “doing the right thing” works out for private companies and financial industry.
The head of SEC has been nominated to be head prosecutor of Manhattan. Can he do both jobs at once? Rhetorical question
The idea is to make sure that neither job gets done. That’s how I read it ?
Extremely efficiently.
He won’t be recusing himself from current investigations, so he will just close them. Job done.
Look how fast Flynn’s case went away once Barr got involved.
The problem with the previous guy, he was getting the wrong half of the job done!
Coming from the balkans I feel more and more at home in the US.
Yes, the same guy that used to defend wallstreet banks… lol
What we learned after the close today is that the Volcker Rule relaxation was to offset the sting of the stress test results and ensuing lockup of dividends to provide better loan-loss reserves.
Still seems to me that the robbers are the ones who work IN the banks.
No, it goes up because of the FED propping everything up and not allowing the free market to do its job and clear the dead wood from the system
Sure, it will…
Trump for better or worse has taken the country down an interesting road. He has forced the US to confront its own failings like no other president in recent memory.
Now people can’t lie to themselves and say everything will be alright… the chickens have come home to roost.
There’s simply too much uncertainty to be able to predict the outcome in other than general terms.
We are only a few months into this pandemic and whether or not a successful vaccine can be produced or not is up in the air.
The odds are against it, something like the ‘flu vaccine might be possible where producers make a guess about which strain will show up each fall.
However we it will take months and likely more than a year to produce sufficient quantities to make a difference.
And if Covid-19 does what the ‘flu did in 1918-1919 it’s “Katy bar the door.”
There will be huge effects on CBRE and high rise residential properties, rents are already falling substantially in Sonoma County as short term rentals turn into long term rentals and we will see a spike in foreclosures due to Job losses and business failures.
That’s pretty much going to be true across the USA.
A “V” shaped recovery is not going to happen, the question is how bad will it get?
No one CAN know at this point, it’s simply too early.
Very bad seems highly likely and horrific is not out of the question.
We do not have a functioning Federal Government and that’s not just Trump.
Of these 30 Million Unemployed (So far) most had low paid service jobs and no reserves.
Many will become homeless if our glorious and beloved leaders do not pull their lips off of their donors A$$e$ and do something about this issue very soon.
It’s an election year, there’s a pandemic on, the populace is scared and angry.
Add a few Million newly homeless to the picture and the odds of extremely serious social unrest are 100%.
Real Estate again.
Median prices down at least 25% if things go reasonably well.
How soon?
I don’t know, sooner is likelier than later, however I flat do not know.
I’ve been watching my market daily for 15 years and for the first time I do not have a good “Feel” for what’s happening.
Be lucky, stay safe
“horrific is not out of the question” haha yes agree.
I see it like a rotten chair, you don’t notice the rot until it collapses. At the root is the unfortunate fact that the working class lost the class war, for a generation workers have had little to no leverage to demand a decent share of the wealth they create. It has been papered over with debt and propaganda. C19 has in my view simply brought forward the next 5/10/x years of pain to the here and now.
Re “We do not have a functioning Federal Government and that’s not just Trump.”
Actually, it functions very well in handing out newly printed money to those it favors.
But as for actually addressing the nation’s issues, I would agree.
Here’s your “V shaped recovery”:
\_______/
We-are-truly-screwed.
You think blacks and their ‘syncopates’ are rioting in the streets now? Wait until Americans start to get medical bills for Covid.
The First Step in recovering from the virus, is Medicare For All, free at the point of service. M4A would free businesses from the cost of health insurance coverage and help commercial and personal financial survival.
Been in the mkt since ’82 and gone thru more than one BEAR. This bull mkt is the most SURREAL of my lifetime built on, nothing but debt and leverage. Mkt is disconnected with the Economy on the ground, thanks Fed’s ill thought out monetary policies. DEBT as a panacea in solving the financial problems is going to be challenged by the events controlled by Corona virus, here after.
Fed cannot give money but only Congress
Fed cannot create jobs or make earnings grow up!
Durable goods orders surged … evidence of growth? Helicopter money got dumped on some people more than others. Stocks rallied again.
David Hall,
Here’s your “surge” in durable goods. They’re down 18% from a year ago
GOTTEM! xD
Gonna cover the Jerome Fireside Chat called the H1 this week?
Some interesting developments today in HY I want to share…
Not gonna cover H.4.1 today. Total assets dropped for second week in a row, but not by as much as last week.
Next week is going to be big, with MBS falling off and swaps falling off too.
Also TALF is back but only a little-bitty bit this week for the first time since the financial crisis. They just got it going. Maybe more next week.
So next week, we’ll have more fun with it, and I’ll cover it then :-]
Awesome!
I have a week to see if my observation of HY this week holds and makes it worth while sharing then :P
Who needs Comedy Central?
TALF “Take All Losing Financials” off our hands please.
I am seeking a federal loan using as collateral, a promissory note from a guy up the road who says he will buy my broken down, Yugo that has a seized engine. I have jumper cables BTW.
From Investopedia
“TALF, was a program created by the U.S. Federal Reserve in November, 2008 to boost consumer spending in order to help jumpstart the economy. It did this by issuing loans to banks using asset-backed securities (ABS) as collateral. The collateral for these securities was made up of auto loans, student loans, credit card loans, equipment loans, floor plan loans, insurance premium finance loans, loans guaranteed by the Small Business Administration (SBA), residential mortgage servicing advances, or commercial mortgage loans.”
“loans guaranteed by the Small Business Administration”, well, alright then! Isn’t that kind of like, circular?
I figure PPP/PUA is running out of gas so closings are happening again. Very little reason to stay in business with the pandemic not over. Also shows how overrated UC’s are in terms of spending and hiring in the long run. Ditto state budgets whichs shortfalls are shrinking again as reopenings occur.
I have an honest question,.What is the definition of “Bottoming Out” ? Is it when the rate passes through a certain,value as it is approaching Zero or is it when the number of jobs lost offsets the number gained? Or, is it neither. The acceleration of gravity on a mass “bottoms out” at terminal velocity but the mass remains falling unless countered.
When the number of unemployed (for example, the number of recipients of UI) no longer increases — but when it stays flat or decreases.
At the present rate of dropping unemployment numbers, when will we be down to twenty million unemployed? 2022?
Yeah, good question.
Bottoming out is simply hitting the low point of the curve. It can happen at any number, after which the curve trends up.
Like a dead cat bounce? ;-)
More seriously, I came to this site to day to look for any information on stimulus for the general population, not for FIRE, but aside from the overly complicated unemployment benefits and PPP, there was only the $1,200 last month (or really what’s continuing been slowly mailed out)
If the Republicans really wanted to get President Trump re-elected or if the Democratic Party really wanted some more votes, they would have made that stimulus monthly until sometime next year, and even increased it to $2,000.
Instead, the darlings have done not much to actually keep the economy rolling. If there are no jobs, there are no jobs and they can only come back if there is money actually being used on Main street and not just pumped into FIRE. Without direct stimulus the economy will just keep sputtering and perhaps just go out and most people around me probably know that.
So Congress and to a lesser extent the state governments are deeply unconcerned, or ignorant, or incompetent, or actually believe that the police and the military will be able to keep the population explodes when homeless and hunger really increase.
I’m not sure which option is less frightening to me.
Doom:
Sounds like space! There is no top or bottom for that matter!
An answer that provides no satisfaction!
It seems “Netflix and chill” runs deeper than I ever imagined.
Market is up despite the bad news today including poor employment picture. I believe it is the bad employment picture that makes the market go up, because Mr. Market knows that it will continue to get (increasing) help from the Fed, the worse the economy gets. Of course, very little gets to the unemployed on Main Street, last stat I’ve seen says average people have got about 20% of the bailout money while corporations and Wall Street have gotten 80%.
I think you nailed it Augusto and it will not end well New Zealand properties are looking better and better to me
Its been like this every freaking Thursday for the last 2 months, it is getting old and predictable. Yes we know the ever so wise forward thinking stock market is so sadistic, the more unemployment filed it hears the more cause for a rally. Would be refreshing to see a reversal in this trend soon to at least show there’s tiny bit of connection to reality.
Amazon, 7 days to full employment.
Good luck trying to get a white collar job in 7 days, 7 weeks or even seven months. Govt. jobs are great but the hiring process takes forever.
Amazon will hire you within 7 days and fire you just as quickly as they hire you. If no one is watching, Amazon has destroyed the concept of a labor union. I work for an Amazon DSP “delivery service partner”. I am not an “Amazon employee”, however, I answer to Amazon for everything that I do.
Municipality, County, State and Federal have not even started rolling with cutting back on expenses. 2021/2022 are going to be very ugly financially ??
What is the correlation between states with voter suppression and states with long lines for unemployment benefits?