Stalled Economy Performs Wealth Miracle, reports the Fed
One thing is working in this economy that has been stuck for years in a slow-growth mire: the inflation of asset prices. And the Federal Reserve, which has been engineering this miracle so adroitly, just released its latest progress report.
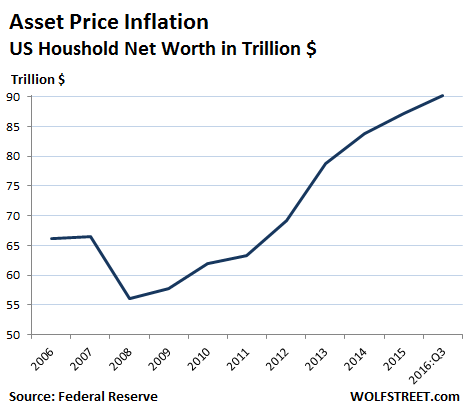
It reported today that the net worth of household and non-profits – they’re lumped together – rose in the third quarter by 1.8% or $1.59 trillion, to a record $90.2 trillion. That’s up 6% or $5.2 trillion from a year ago.
That 12-month increase of $5.2 trillion is larger than the GDP of Japan. Just by inflating asset prices. Why even bother to work? We’ll get to that in a moment.
Total household net worth is now nearly five times the size of US GDP. In 2007, at the top of the prior bubble, household net worth was $66.5 trillion, or about 4.5 times the size of GDP, before it all blew up.
This chart shows the fabulous and ever increasing wealth of US households, which surely must be a result of a wondrous high-growth economy that is hitting on all cylinders and is making everyone rich:
That $1.59 trillion increase in household net worth in Q3 included:
- $494 billion in gains from stocks that households own directly, or indirectly via pension funds and the like.
- $554 billion in gains from real estate holdings.
- $331 billion increase in bank deposits (savings accounts and CDs).
Total household assets, before debts, were valued at $105 trillion, so about 5.7 times US GDP.
In turn, households carried $14.6 trillion in debt, which grew in Q3 at an annual rate of 4%, with consumer credit jumping 7.5% and mortgage credit rising 2.9%.
Over the third quarter, the S&P 500 index rose 3.3%, so that helped. But that’s like so October 31. Since then, the wondrous “the-economy-is-terrible” Trump rally kicked in, and those households holding the most stocks will have done well so far in Q4.
Wisely – nay, ingeniously – the Fed doesn’t offer any data on the distribution of household wealth. But from other data, including from the Fed itself, we know that the vast majority of households own few or no financial assets.
In fact, according to another report by the Fed, we know that 46% of adults do not have enough money to cover a $400 emergency. They’d have to sell some furniture or charge it on their maxed-out credit card or just forget about it. Similarly, a survey by Bankrate.com found that 63% of Americans don’t have enough savings to pay for a $500 to $1,000 emergency.
This is the economy of today. The vast majority of that $90.2 trillion in elegantly inflated household wealth is distributed to a small percentage of the wealthiest households, which have gotten vastly wealthier in the process.
For the rest of the Americans, for vast majority, there are only a few crumbs here and there, if any: even if they have 20% equity in their home, the lucky ones, and that home is worth $200,000, it amounts to $40,000 in equity. If 50 million households (of 124.6 million total households in the US) are in this lucky position, it amounts to only $2 trillion, a drop in the $90.2 trillion bucket.
Stock prices and real estate prices in many metros have long surpassed prior bubble records. In the Fed’s infinite wisdom to inflate asset bubbles no matter what, to refuse to acknowledge asset bubbles when they balloon into full maturity, to avert its eyes when they get so huge that it’s hard to see anything else, and to re-inflate them after they implode under their own weight… with these tactics, the Fed is in part responsible for the reasons this economy is no longer functioning as it should.
There is a price to pay: an asset bubble in real estate creates housing cost inflation that saps the majority of consumers and their power to spend on other things. But no problem for the Fed. They should just borrow the money they want to spend.
Ironically, and with impeccable timing, just today, Gallup released a 120-page report on the US economy – and what’s wrong with it. It’s titled, “No Recovery.” It shows, among the many ills of this Fed-designed economy, that on a per-capita basis, GDP growth has been shrinking for decades, has gotten crushed since the Financial Crisis, and is now down to a measly annual rate of 0.5%:
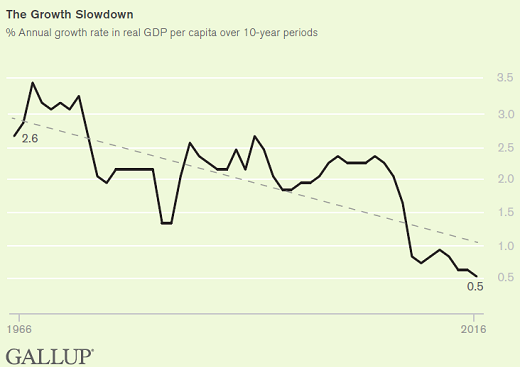
GDP per capita is what inviduals in the real economy actually experience. It’s their slice of the economic pie, their reality. For many, that slice has been shrinking for years, even as it has been growing for those that the Fed has singled out and coddled.
There is hardly a better chart to show that blowing asset bubbles is NOT helping the overall economy, no matter how the Fed, economists, other entities, and much of the financial media twist and turn it, though it has been very successful in enriching a relatively small number of households.
But the hard-working households with no savings to pay for emergencies get a feel-good illusion. Read… OK, I get it: Companies Clamor for Cheap Labor, Fed Delivers
Enjoy reading WOLF STREET and want to support it? You can donate. I appreciate it immensely. Click on the mug to find out how:

![]()
So where do we go from here?
Will there be another 2000/2008 type crash that will reset asset prices? Or will this just grind on, settling into a new feudalistic order that future generations will have to battle against?
I hope for the former but fear the later.
Something tells me that Marxism will be fashionable again.
In some respects it already is. Das Kapital has been selling well on Wall Street for some time.
The problem is the Far Left is still dominated by aging Leninists of numerous persuasions, still hopelessly out of touch with anything that could be called “reality”.
Crashes are soo Yesterday,we have arrived at virtual Nirvana,you can virtually make it whatever you want it to be. besides,just look at what Mr Obama has done for the working Class and the African American Community! he sure showed those Banksters who’s Boss. We are all equal now,so don’t worry and buy any dip in the market.I highly recommend CMG,the Burrito Joint,it’s on Sale for only 369.00 per share,a no Brainer! sorry,sarcasm is all i have left at this point…happy trading and don’t forget buy some Gold,it’s Insurance….
I feel your sarcastic pain!
Are you sure that ought to be posed as an either/or question? “B” could easily follow “A.”
Groucho: To answer your question we have to contact the BIS, Federal Reserve Banking cartel, World Bank and IMF. Unfortunately I do not have a contact or phone number for any of them.
Can’t wait to see what the Barry Soetoro supports have to say about this.
“That 12-month increase of $5.2 trillion is larger than the GDP of Japan. Just by inflating asset prices. Why even bother to work? We’ll get to that in a moment.”
===========
So, why even bother to work? The Fed should simply print more money out of thin air and send everybody a check every week. Hey, this economy thing is so simple!
Ish buddy,
Of course you are right !
You must remember this proposal, MINT A $1 TRILLION PLATINUM COIN ? See the link :
http://economy.money.cnn.com/2013/01/04/platinum-coin-debt-deiling/
. . . . and distribute the proceeds pro-rata to each of the 100 million American households. Pro-rata because the $10,000 will mean almost nothing to each millionaire household. But it will mean the world to us 99 percenters. Meaning you and me, of course.
I could use the $10K to pay off my last remaining loan (exclusive of my mortgage that will be paid off when I am a 95 Y.O. ) .
In fact, Treasury could mint a $1 Trillion coin every month for a year, to help get America back on its feet again.
I could really use an extra $120K to improve my life !
( But still, it would not dent the mortgage much at all )
( /sarc if that is not obvious )
SnowieGeorgie
Ishy, you got the game all wrong. It is Monopoly! The only time you get your $200 is after you pass go.. Otherwise you have to wait till someone wins and then the money is collected, passed out again and the game starts all over..
I just passed go but then landed on Park Place with 4 hotels and got ripped.. Then I ended up in Jail.. Not doing so good with my lowly Utilities and St James Place.
Germany tried the printing money route and managed to wipe out the savings of most of its residents in the early 1920’s. The Great Depression hit Germany a few years later. First came the US stock market crash in 1929, followed by the Smoot-Hawley Tarriff of 1930, the collapse of a large Austrian bank in 1931 and 25% unemployment in Germany in 1932. As William Shrirer noted in his book on the Third Reich some 55 years ago, such times were heaven sent for Hitler. But I doubt that Trump has read the book and I doubt that the wealthy members of AIPAC have connected the dots either. In the mean time, let the good times roll, if you are fully invested in the stock market.
one has to add that some people also got filthy rich from the German hyperinflation – which also contributed to the sentiment of the Third Reich.
You are quite right. Large businesses which had issued bonds or had borrowed heavily from banks got to pay off their debts in near worthless money. Read about Germany’s hyperinflation here: http://www.pbs.org/wgbh/commandingheights/shared/minitext/ess_germanhyperinflation.html
Yea! I could use some of those printed dollars! We should jsut be allowed to buy a money printer!
I remember trading the market in the 6o’s from 1966 to 1982 the DJI coundn’t crack through and hold the 1000 level.
Now it goes up 1000 pts in a week! It took 14 years to get through 1000! Wow! I just wish i had only gone long just once!!
The wealth effect in action, but only for the already wealthy. Cheap money has had its effect on many of the assets where it’s been focused. The question, as always, is when will it ran out of gas?
“…only for the already wealthy.”
G. a., I am not “Wealthy” by most measures, but my assets have increased in price (“Value” who knows? For that matter, who even knows the difference between price and value).
How? Avoid borrowing, buy wisely and hang on.
I was kinda kidding…. But alluding to Ben Bernankes “wealth effect” that gets people spending and borrowing….
“For that matter, who even knows the difference between price and value”
Value is the usefulness of a product or service to a buyer. Price is the financial reward to the seller for providing the product or service.
Simplistically, the value of anything is the price somebody is willing to pay for it.
That said, the price of freedom keeps going up, but the quality keeps deteriorating.
https://despair.com/collections/retired/products/liberty
The price of many commodities rockets up and plunges down on a regular basis. Thar doesn’t mean that the value does the same.
“FED reported today that the net worth of household and non-profits – they’re lumped together – rose in the third quarter by 1.8% or $1.59 trillion, to a record $90.2 trillion”
FED reports fake news for the purpose of controlling the narrative, similarly fake as Saddam Hussein had WMD, Hilary had 99% of vote, Obamacare will lower the cost of healthcare, Saudi Arabia is an ally, Trump is a racist klansman, and on and on….. FAKE NEWS!!!
it will run out of gas when interest takes a big enough bite out of what is it “interested” in.
there, i let y’all in on a big ol’ fashionedy secret like thing.
The asset price bubble is mainly in residential real estate which carries with it the liability of increasing real estate taxes. This bubble is extending the ATM for local govts to keep spending. I looked at the prices for the houses on my old street in FL and they are up 50K-100K per house since last year. The house I live in now is up 30k. I now expect the taxes to go up on all these houses and also the wage expectations of every local govt worker. Unless you are cashing out the bubble is not your friend.
Petunia, am LOVING your comments esp on the own-to-rent stuff that Wolf is breaking stories on the reality on the ground.
wanted to tell you i’m reading and LOVING Chris Hedges’ new book, UNSPEAKABLE (James read it this morning and loved it and read passages to me). it’s interview style (w/David Talbot, formerly of Salon). Now James is reading “TRIBE” by sebastian junger and they fit well together.
i told James, “see? electricity is being discovered at the same time all over the place!”
Chris Hedges is our household’s major hero and as i’m reading about his bad ass youth, i realize, “we really ARE born this way.”
so to all you other bad asses out there who’re lost and needing a reminder on why and how virtue is its own reward, and a way to defy all this dead evil crap, read Hedges’ new little book, UNSPEAKABLE.
Thank you Kitten for reminding me and other about Chris Hedges(who my 19 y.o. Son turned me onto. Loved his debate with Robert Reich on Democracy Now a few months back regarding the presidential campaign. UNSPEAKABLE I will get it! And YES Virtue is its own reward,thx
Unless I am mistaken, taxes go up only when a property is sold at a higher value or there is a general reappraisal of property.
Property tax is based on the assessment. As nearby properties increase in value so to does yours and as a result the assessment increases. Also, the rate Tax/Assessment may also vary, your state/county may increase the tax despite the assessed value hasn’t changed.
California is a little different, based on proposition 7, this might explain why the state is broke? Anyway, the system you described sounds a little like prop 7 but I’ve forgotten who qualifies or if anyone does anymore.
Bottom line though, if there are no jobs the owner may be forced to sell and prices tend to fall fast when everyone’s headed for the exits..
In Florida they used market value anywhere I lived. It can go up or down every year but is capped by some percentage, which I now don’t remember, it could be 3% per year.
You are thinking of Proposition 13, passed in 1978. Even with the protections offered by Prop. 13, the state continues to collect lots of taxes. Its state income tax tops out at 13%. The sales tax rate can be as high as 10%. The oldest baby boomers (born in early 1946) are now subject to the Required Minimum Distribution from their non-Roth IRA accounts and the related income taxes. In the next few years, the state will receive a windfall from these income taxes.
I think you’re talking about Proposition 13, an amendment of the Calif. Constitution, enacted in 1978. It drastically limits how property taxes are figured and collected, to where people and companies who’ve owned their properties for decades pay very little property tax, while their neighbor, who just bought, pays property tax out the wazoo.
Its not a bad thing, it stops municipality’s taxing lower income people, out of their homes and neighborhoods.
When they brought there, they could afford to live there.
They dint ask rich people to come and gentry-fie their neighborhood’s.
Or speculators to come and drive prices through the roof, otherwise they would no longer be living there..
“people and companies who’ve owned their properties for decades pay very little property tax, while their neighbor, who just bought, pays property tax out the wazoo.”
Nothing wrong with that. If people don’t want to pay taxes, then they shouldn’t have to. Besides, all Amerikans have the right to buy the tax laws they want, so there’s no excuse.
Everybody knows that people shouldn’t be taxed to pay for roads and schools and military imperialism. The government should pay for that.
/s
@Petunia,
In Florida, residential and commercial property taxes are the result of the accumulated ad valorem rate set by your city, county, school board and other special districts multiplied by the property’s value as set by the county Property Appraiser.
The Property Appraiser is a separate elected official because elected officials hate raising the ad valorem rate, and they used to just have the PA raise the value instead to get more taxes. So the PA became a separate official decades ago.
Florida also has the “Save Our Homes” amendment to the constitution which limits the overall ad valorem increase to the lowest of CPI or 3%. That can be overridden by a supermajority of the elected officials in a taxing district.
It depends on where you are at, even down to the township level. When I lived in urban Arizona, my real estate taxes went up every year due to a price level adjustment made to assessed valuation. Here in small city Illinois they don’t make those kind of changes very aggressively.
You forgot to mention, increased property taxes will be passed on to the renters.
Not necessarily. People are downsizing now all the time. When the rent goes up they move or double up. The numbers for individual household formations went down during the financial crisis and are not moving up much from what I can see. Every family seems to have adult kids living at home or moving back in.
The taxes will not (fully) be passed on if there is more supply than real demand at the actual price level. Maybe that is the case in some of the US, but in general I think that every renter who ‘downsizes’ is replaced by someone else who rents the property and pays the higher taxes …
“Every family seems to have adult kids living at home or moving back in.”
And you believe this is because workers get paid too much. And even more strangely, you believe Trump is somehow going to fix this by gutting workers to enrich the wealthy.
Cutting your pay by 80% should make you competitive with Indian and Chinese workers. That will solve everything for you, won’t it?
Stop the generalizations. You know what about who lives at home? Not much.
You dont know how much city workers will make.
Your entertaining though.
Walter and GSX,
I have a relative that has two adult children at home, one is a pharmacist with a full time and part time job, the other is a school teacher in a rich area. The kids both live at home and will be there until they pay off the loans they took out. This may take a few years. In a normal economy both would have bought apartments and moved out. Now they are stay until they marry.
Those kids are in better shape than some of their friends who don’t have jobs, just parents paying their loans.
Petunia: “I have a relative that has two adult children at home, one is a pharmacist with a full time and part time job, the other is a school teacher in a rich area.”
Everybody knows that teachers are overpaid, so they’re probably just wasteful spendthrifts. All we know for sure is that if they weren’t lazy and otherwise morally deficient they wouldn’t have this problem.
After all, the policy of the incoming administration is that if people are poor it is their own fault. Don’t you agree?
“You forgot to mention, increased property taxes will be passed on to the renters.”
Quite right. Landlords don’t pay property taxes. Renters pay their property taxes for them. Also their mortgages and payments on the Rolls.
Petunia,
Here in Australia we have “rates” – those things that you Yanks call property taxes.
Mine have tripled since I bought my house. The price of the house hasn’t quite tripled yet, though.
For those fortunate to own a really, really expensive house or multiple properties they also get the privilege of paying ‘land tax’ as well.
As the number of people getting older keep straining the ability of the government to pay for them, the government here has been changing the rules for the old age pension: too many assets or too much income and you get a reduced amount or nothing.
So far the family home has been exempt from the calculation, but there is another insidious way of getting old people out of their houses: rapidly raising rates.
If you are on a fixed income or have limited liquid assets it becomes harder and harder to pony up the amount needed.
If your property increases in value from $300,000 to over $3,000,000 in 10 years and you are 75 years old on that fixed income, well guess what………..
The only solution is sell the house and then because you now have too many assets you lose the pension.
I have no doubt that the next round of ‘find the money’ will be directed at including part or all of the family home in the assets test for the pension here.
And when that happens all hell will break lose here.
That’s why you hold them in company’s owned by trusts, then you only have to transfer the trust every once in a while about 80 years which can be done by collapsing 1 into anther with no tax liability’s, any everybody is better off as all property related expenses become deductible. and company ;losses deductible against personal taxes in some cases
Today, to own property in the ANZAC market, you need a second income stream even if it is not a completely profitable 1 and teh ability to write off/claw back all associated costs and property costs, or it is simply not worth it long term as they slam you at Pension/Retirement time.
The best gift for children before they move into higher Education is a company owned by a trust.
Dosent matter if the company only imports a box of fishing line and makes 10% on it, its still, a trading entity and you can write of claw back Much.
The second you privately purchase property in the ANZAC States, the State and Munis own you.
Doesn’t the assets test for the pension take into account the value of the private trusts???
If they aren’t set up properly, yes.
It is possible to organize them, so that you get get from them, without being a beneficiary, which is not calculable for pension’s.
It is not necessary to do that when they are settled it can be done later so spreading the cost.
But musty be done around 10 years or possibly earlier than the pension application date.
If you set it up properly, you personally own nothing, except debt’s, and rent property from a company, owned by the trust.
They rarely look into the shareholders of the company you rent from
They rarely check that you actually pay the rent.
You cant be a direct officer of either. But can indirectly exercise total control.
Asset test only investigates direct control.
Obviously you have to be very careful and sometimes a little ambiguous when completing the asset test.
This level of ambiguity will not take you into the realms of fraud or false declaration’s.
Hint when you get from then entity’s, you actually Borrow from them.
Nobody ever checks the payment terms, and payments of the loan/s, in detail
My impression is that creeping fascism is fastening a stranglehold on Australia. Complainers will be “taken care of”.
No in Australia its Unionism which generally turns into Dictatorial Communism/Socialism.
Worse most Australian unions are like the American ones corrupt.
Thats where Juliar who now teaches in the US, got her start, and her dirty money.
https://en.wikipedia.org/wiki/Julia_Gillard
Wolf with all these numbers to get a REAL picture
Cut out the top 10% of the population and what they own earn.
then look again.
d, the upper classes want to massively reduce the ;living standards of the working classes so as to make Australia “competitive”, oh say, to about the level of neighboring Indonesia. The strong unions are about the only standing in the way and so the Murdoch controlled press furiously denounces and slanders the unions and prints endless disinformation about them worthy of a Goebbels. Meanwhile, the fundamental rights of the Australian people are being insidiously undercut and a future police state is being prepared. Australia used to be in the top ranks with regard to human rights but no longer. You are obviously a dupe programed to spread deceiving propaganda.
I used to be a union delegate. I know how corrupt Australian unions are.
In Australia you cant do anything, with out union pushed licenses, and union pushed, OSHA, and other ticket clipping agencies, staffed by overpaid union employees, clipping your ticket ( extracting a fee) every step of the way.
Friend of mine went to work in a mine in WA, was given a job to change tracks on an excavator.
He was half way through it after 4 hours, when a union delegate walked up and asked him what he tough he was doing .
He then told told him “it takes three days to do this job, so its going to take you 2 and a half days to change the other track, or you are going to have an accident mate”.
Unions have a place. Just like policemen.
Unions in Australia, ceased to be useful, or helping anybody but themselves, long ago.
Self-interest drives everyone from the banker to the union rep.
“Self-interest drives everyone from the banker to the union rep.”
Yes the second unions start doing other, than looking out for the interests of the worker.
They cease to be part of the solution, and become part of the problem.
In Australia and America in particular, they are a BIG part of the problem.
The UK had more than its fair share of union problems in the 1970s.
Again unions got out of control and had too much power.
Today its bankers that have got out of control and have too much power.
Both have a useful role to play, but stop doing what they should be doing and start looking after their own interests.
It’s a difficult one to solve, human nature is the problem.
“Today its bankers that have got out of control and have too much power.”
I think you better have another look at the activity’s of unions in that country currently and what they are promising/threatening for the future
http://www.dailymail.co.uk/news/article-4031262/The-wreckers-man-calls-Corbyn-Messiah-union-rail-strike-led-Harley-riding-Rick-Wakeman-lookalike-tattoos-knuckles-promised-TEN-YEARS-passenger-misery.html
At least they won’t take down the global financial system.
“At least they won’t take down the global financial system.”
England is an sdr nation.
if the unions kill the English economy so sdr status, that would make the chinese SDR status % larger increasing the risk to the sdr and the Global financial system.
So not direct but indirectly the unions may do just that.
As a major banking issue in china is most definitely a when.
If the chinese dont treat the petulant child P 45, with more leeway and care than they do their pet in anti US goad in DPRK. The financial and trade world is heading for a big everybody loose session.
Time for china to level the playing field, and give some back. Globally not just to the US. They don’t want to.
My bumper sticker “End the Fed” elicits all kinds of questions. My responses is “Google It”. I’m not gonna waste my G.D. breath answering a bunch of skeptics. To my fellow commenters, I thank you because otherwise I’d doubt my sanity.
???
Good for you.
You know the truth, but be VERY CAREFUL or you will be banned from many sites. Oh, don’t look into “Demographics”……..don’t go down that rabbit hole……….Nor look too deep into the Income Tax (related to your FED buddies)…..nor……or the Invasion of Europe……
If you assume all leaders are greedy and self-serving with no sense of ethics or country, what’s happening in the world today makes a lot of sense. I think the only good person in the world is my momma.
Also, the only persons worse than corrupt leaders are spineless leaders that knowingly shirk their responsibilities (Yellen and Bernanke?).
Hint Jamie R Gorelick
Schlumberger director 2004-2009 https://www.justice.gov/opa/pr/schlumberger-oilfield-holdings-ltd-agrees-plead-guilty-and-pay-over-2327-million-violating-us
https://www.wilmerhale.com/jamie_gorelick/#!0
Ha Ha Ha ! ! ! I can’t stop laughing ! This is the best yet !
The Ekonimee is a Magic Tracks commercial ! ! !
Barely sane
Dec 8, 2016 at 10:52 pm ~ Ha Ha Ha Love it !
Better watch out Wolf……. They gunna label you a fake news site……
Whooo Yooo I can quit work today ! !
How many zeros in a trillion…..?
Ah- who cares I’m Rich ! ! !
,
they could start labeling all official financial websites as ‘fake news’ …
“they could start labeling all official financial websites as ‘fake news’”
–THAT’S FUNNY
“For the rest of the Americans, for vast majority, there are only a few crumbs here and there, if any: even if they have 20% equity in their home, the lucky ones, and that home is worth $200,000, it amounts to $40,000 in equity.”
Asset gains have nothing to do with how much equity the owner has, the gains are always relative to the value of the home because the debt (if any) isn’t influenced by rising home or stock prices. And because many home owners use huge leverage, the effect is very real.
In the nineties in my country many ordinary people (think government workers with maximum mortgage) made more money from owning a home than from working. And it is starting to happen again, although most people have very little equity in the home (the standard mortgage starts at 104% and many have avoided paying off as much as possible so they have maximum leverage). So yes: why work??
Of course, the gains are mostly ‘virtual’ and to cash out one has to take out a bigger mortgage (probably easy with the current low rates and ultra-lose policies) and assume the money never has to be paid back, sell and emigrate to a less bubblicious country, start renting at the right time (almost impossible) or downsize (in my country this isn’t profitable because the larger properties often have more value for money; but maybe works in some other countries). None of these are easy options so yes it is mostly “housing inflation’ but still, some people – definitely not just the elite – play the game and are very good at it.
Up to now the only ones who are really feeling the pain are savers, and in some cases pensioners. Those with large debts or most of their capital in RE/stocks have done really well; it really depends on ones financial situation and not just on statistical ‘household wealth’.
“Asset gains have nothing to do with how much equity the owner has”
Epic fail.
Equity is the value of an asset less the value of all liabilities on that asset. When value goes up, so does equity.
strange, I try to post a reply and repeatedly get this warning:
“A potentially unsafe operation has been detected in your request to this site.”
nhz, if you keep seeing this, contact me by email (contact tab).
second try:
I probably didn’t express myself clearly (I’m from a non-english country, sorry …). What I wanted to say is that equity gains due to rising home prices do NOT depend on how much equity people have in their home. The gains (in absolute value) are the same whether they have 0%, 20% or 100% equity.
However the % equity in the home DOES matter for the relative gains. Someone with 0% equity uses far more leverage and so they can profit extremely from a housing bubble. Even more if – like in my country – all the downside risk is for the taxpayers.
In my country someone could buy a median home in a hotspot with a government-sponsored 103% mortgage, sell the home 1-2 years later and pocket 40.000 euro tax free (with current price rises) and even go back to renting in the heavily subsidized social sector if they fear prices will decline again (for renting in the social sector one of the requirements is that one has less than 50.000 euro equity, plus median or lower wage). These ‘poor’ people can only win of they play the housing bubble game.
IMHO both these points contradict the suggestion in the story above. It’s not the elite that profit, some of the people at the bottom can profit hugely as well.
You are making a good point, but it is too subtle for most Americans to see. When they turned America into a service economy, they also turned us into economic gamblers and leverage was the ticket into the game.
If you point out that Goldman Sachs uses leverage to magnify their financial position, most people get that. If you tell them they are doing the same thing, they don’t see it, because they don’t see the same magnitude.
“Someone with 0% equity uses far more leverage and so they can profit extremely from a housing bubble. ”
As long as they can or do sell near the top.. Once the top is reached and people know it is the top, few buyers are willing to buy and those who are often can’t qualify as the prices fall faster than the listed/offered prices. Everything has to be justified and appraisals follow the market up and down.
This whole game of speculation is just that, speculation and not investing. And things can happen really fast today with so much liquidity looking for the next best thing. Losses of equity/assets can happen just as fast.. Just look back 8 years. When things are this volatile, look out.
I have seen this more than once in my life and it is ugly. People get trapped and then go under taking all their wealth with them.
@economicmirror:
mostly agree with you, nobody knows when the top is in and it is all speculation.
However … you don’t need to know when the top is in if the government has your back and will pass any loss to the taxpayers, like they do for e.g. the biggest banks but also for many small speculators at the bottom of the housing pyramid who have been trained over the years how to take advantage of their ‘disadvantaged’ position. Probably my country is a bit worse than the US in this respect, but I remember countless stories from the last US housing bubble where the small fish lived for many years in a home way beyond their means without paying the mortgage, while their neighbors were paying through the nose trying to protect the little wealth they had. And this all gets dressed up as ‘I’m brilliant’ when home prices go up AND ‘I have been had’ when prices decline; privatize the gains, socialize the losses. The little fish understand this principle as well as the bigggest banksters.
If people or companies cannot lose they are likely to make outrageous bets, the result is the current e-con-omy.
“Up to now the only ones who are really feeling the pain are savers, and in some cases pensioners.”
I am both and, believe me, I am feeling no pain!
It all depends upon how one adapts:
http://lenpenzo.com/blog/id22017-how-i-live-on-less-than-40000-annually-ralph-from-west-virginia.html
With savers I mean people who strongly depend on a savings account (because they don’t have other income source). Of course they feel the pain, maybe less so in the US than in Europe though …
There is no way one can adapt to savings rates going down from 4%
less than ten years ago to less than 0.3% nowadays, the capital in real terms is simply vanishing at increasing rate. Also, in Netherlands and some other EU countries savings are taxed by what the US would call a ‘wealth tax’. Irrespective of the real rate the bank pays, you pay 1.2-1.6% tax each year. Most of my costs are taxes and other payments to the government that I cannot avoid, and as you know such costs increase every year until I totally run out of money; then suddenly the government will start showering me with money (if there is still something left then which I doubt).
Property Tax means you can never own your property. You do not and can not own your home. You rent/lease it from the State.
There should be no taxes on your home. None.
Also, who are those who own these Trillions? Try finding out. Really, does anybody want to take a chance and get the NAMES of these Families? They exists, but they hide very very very well, while their front “men”, Politicians, Soros, etc. do the public dirty work against you.
“Property Tax means you can never own your property.”
It seems to me that you have a strange understanding of US property rights. Just because you have to pay taxes on your property doesn’t mean you don’t own it. If you don’t pay your taxes, or if you don’t pay your mortgage, well, there are consequences. That’s all part of “ownership.”
It seems to me that this “strange understanding” of U.S. property rights is a symptom of the trend in our Zeitgeist toward anarchy – all governmental functions are sub rosa.
With all due respect, you have a strange understanding of “ownership”
If I own something (truely OWN it, with no debt, etc), I owe nothing on it and nobody can take it.
If I don’t pay my property taxes, the STATE takes the property, which only shows they OWN it and I just lease it (Property Tax) from them. We call it “tax” rather than “renting from the State”.
No STATE can take my drum set. No STATE can take my personal library. Why can they take my home?
Only people end up paying the “tax”. Property can not pay tax. So why not just tax directly “the people”, rather than the charade and tricks and threats and use of force.
In my mind, Property Tax and Income Tax are both immoral and dishonest.
I’m with you on this one. If they can tax it and confiscate it, it isn’t yours.
“No STATE can take my drum set. No STATE can take my personal library. Why can they take my home?”
That rather depends on the nature of the state and the nature of your crimes, now doesn’t it?
“In my mind, Property Tax and Income Tax are both immoral and dishonest.”
Got caught, did you?
Land property is never really owned anyway. It is created by the Universe, not man. You are just the caretaker while you hold the deed. Property is exactly what all taxes should be based on.
“Only people end up paying the “tax”. Property can not pay tax. So why not just tax directly “the people”, ”
Because the rich won’t pay and the state doesn’t have enough enforcers to deal with the accountants and lawyers of the elite so a property tax gets them to at least pay some of the costs to maintain their lifestyles.
I think a VAT tax should be used and property and sales and income taxes thrown out.. Just take a little of ALL transactions.. The state gets what it needs but then it is harder to keep them in line.. Oh if it wasn’t for the nature of humans to be sneaky greedy Aholes… Oh well, nothing really works does it.
Between taxes and zoning/building regulations, you may own it but you can not do what you want with it. The state or county mandates everything about your *ownership*. What that means is you do not have any freedom concerning your property except what the state mandates to you.. and then they charge you taxes and fees and permits.
Sure. And to go down this path a little further: property owners are sitting ducks. Hence Prop 13; Californians got tired of being sitting ducks. Watch the pension crisis play out in Chicago, Dallas, and many other cities. Property owners are now experiencing what it means to be a sitting duck.
Live in Calif benefit from Prop 13 but get slammed by everything else in Calif.
What administrations do globally and more importantly the exorbitant rates and pensions they pay their staff are a big problem that needs to be solved.
In the Philippines over 25 % of the tax collected, simply evaporates.
State employees area global probl;em not just a US one.
@d:
Agree … in my country property taxes are next to nothing (very deliberately … the government gets their cut the moment you buy, because they control 95% of the land through zoning, and prices are outrageous). But homeowners are sitting ducks anyway, they just haven’t realized it yet.
My own small city is number 2 in the country for debt per citizen, all thanks to speculation with land that they planned to build on while the population in the area is shrinking (despite the flood of foreign migrants…). Even 10 years ago everyone with a bit of financial insight could see bankruptcy looming but the city is still spending on breads and circuses like there is no tomorrow, with new accounting tricks every year to keep the Ponzi going and bankruptcy avoided for yet another year.
But at some point, the citizens will have to pay up and I don’t think the homeowners (many of them local/state government workers with 0.5-1M euro homes, often retired at 50-55 with pensions worth several million …) will escape.
If you add it all up, tax for a self-employed person in Europe is probably over 90% of income by the time you get to spend it :-(
If you don’t pay your taxes, well, there are consequences. That’s all part of “ownership.”
The consequences should not enable the State or munis to take the land.
We have Ethnic tribal groups, whose land is protected.
If they dont pay land related taxes the state or munis can not take the land, further finance entity’s or anybody else, can not seize the land in lieu of debts.
They own their land.
Everybody else lease their land from the local muni and state.
With varying wrights,
If you dont pay the lease aka “land tax” they take it back.
The state should not be able to seize land due to unpaid land taxes.
If you dont pay for the services the state provides the state should simply stop providing them.
The only thing they do for the land tax is take away the garbage.
Its cheaper to dump it commercially.
Look, they can’t and don’t “just take the land.” That’s ludicrous. They put a lien on your property, and YOU can’t sell it before the lien is satisfied. That’s where it ends most of the time. Eventually, if this drags out for many years, it may lead to a legal process. But by then, the lender is usually foreclosing on the property due to default on the mortgage, and the lender has to pay the taxes.
“Look, they can’t and don’t “just take the land.” ”
They can and do Globally. This is not only a US issue.
Yes there is a processes, but ultimately, they can and do, take land for taxes, making people homeless, with not way to feed themselves, as they no longer have land to grow food on.
They should not be allowed too.
There are plenty of ways for the state to make people pay what is reasonable without making then homeless.
It is simply state terrorism and extortion.
In some states in Africa, they us the illegal planting of wild tomatoes on public land, by people who have had their land taken by the state, as a positive economic indicator.
Native title protection came about in NZ, to prevent municipality’s, aggressively and quickly taking native land for Excessive land related taxes. Which they were doing.
Most people who own native land pay the taxes as not doing so, gets you bad credit.
In some parts of the world, property ownership is transferred to the gov’t while management is granted to a particular family for a hundred years, or indefinitely. I’ve heard this has been discovered in the UK but quickly buried out of sight of the peasantry. ‘Historic sites’, parks, nature preserves…. legal tax dodging schemes. So, I’m quite sure not everyone pays property tax.
1) Please note that assets are priced in “Federal Reserve Notes” (FRNs), as it says so on the dollar bill in my wallet. The value (and assoc. purchasing power) of said notes is no longer based on an underlying store of value (such as precious metals), but rather the monetary base. Thus, the Fed controls the value of the fiat (by decree) currency. Since the monetary base has been growing since 1913, the value and purchasing power has been declining since then. The U.S. dollar is now worth “a few cents” on the dollar (normalized to 100 cents). This known as “inflation” (an increase in the monetary base, not the resulting price increase).
2) It makes sense then that household net worth is a large number, since priced in inflated FRNs. However, priced in commodities or precious metals, It’s not such a high value.
3) This calc. does not include the Federal debt and off balance sheet obligations (e.g. “entitlements). In our debt-based economy, one must include both assets and liabilities. Once honest and complete accounting methods are used, well then, I think we’d see a much smaller number.
4) Wealth is “the annual produce of the land and labor of the society” – Adam Smith, “The Wealth of Nations”. This is not the same as “the annual asset inflation and debt creation of your local CB”. GDP captures some of the first metric, but not completely, since it includes gov’t. activity (a non-productive contribution to the “economy”.
Summary: Everyone “feels” wealthy in an appreciating asset bubble, but not so much when the bubble bursts (as they always do). Based on the current low labor participation rate, high levels of gov’t. transfer payments, etc., are we really “wealthy”? And yes, this is related to income inequality as well. In my view, “the emperor has no clothes.”
‘Please note that assets are priced in “Federal Reserve Notes” (FRNs), as it says so on the dollar bill in my wallet.’
It’s their money. They’re just renting it to you, even though you can’t actually afford their price.
Rather prescient of Mr. Jefferson, wouldn’t you say?
Napoleon Bonaparte
“When a government is dependent upon bankers for money, they and not the leaders of the government control the situation, since the hand that gives is above the hand that takes. Money has no motherland; financiers are without patriotism and without decency; their sole object is gain.”
President James Madison
“History records that the money changers have used every form of abuse, intrigue, deceit, and violent means possible to maintain their control of governments by controlling money and its issuance.”
President Abraham Lincoln
“The money power preys upon the nation in times of peace and conspires against it in times of adversity. It is more despotic than monarchy, more insolent than autocracy, more selfish than bureaucracy.”
Nice, but it sort of misses how the banking cartel, in the mindless pursuit of sheer avarice, managed to arrange for two world wars, and counting, that killed off hundreds of millions of people and, quite incidentally, consigned two billion people to the tender mercies of Soviet, Chinese, etc., totalitarianism.
Proving, of course, that dedicated psychopathic kleptomaniacs should not be allowed to handle money, and certainly not in vast quantities. That sort of blind devotion to almighty money has civilization set to chase itself off the well-known cliff, and it makes no difference that the governing classes are mostly in on it.
It’s a pity but there’s nothing I’m going to do about it, so I’m just going to sit back and watch it happen and do a nice review of it afterwards.
” The value (and assoc. purchasing power) of said notes is no longer based on an underlying store of value (such as precious metals), but rather the monetary base.”
The value wasn’t based on an underlying store of value even when the “monetary base” was supposed to be precious metals. Very, very few transactions were performed with gold or silver coins. Most transactions were performed with bank notes or similar marks of credit.
And, being dishonest, there were always far more bank notes floating around in the market than precious metals to back them up. So the country was constantly going through booms and busts as notes were created and then folks would make a run when they found out the bank was in trouble.
This became a bigger and bigger problem as the economy became more integrated and more banks were effected. Hence the need for the creation of the federal reserve to regulate paper dollar issuance and enforce adequate reserve maintenance.
Of course, we could just nationalized banking and had the treasury perform this function. But then we wouldn’t have this wonderful set of parasites feeding off of us.
Using the household wealth and number of households given in the article, the average wealth per houshold works out to about $725,000, which is less than 5% of the size of Mitt Romney’s IRA account back in 2012. If you are looking for where a lot of the wealth is based, start with the 500 zip codes that have the most expensive homes for sale, as listed in a recent Forbes article.
Hoarding waiting for the other guy to take a risk!
Central Banks and the wealth effect.
Real wealth comes from the real economy where real products and services are traded.
This involves hard work which is something the financial sector is not interested in.
The financial sector is interested in imaginary wealth – the wealth effect.
They look for some existing asset they can inflate the price of, like the national housing stock.
They then pour money into this asset to create imaginary wealth, the bubble bursts and all the imaginary wealth disappears.
1929 – US (margin lending into US stocks)
1989 – Japan (real estate)
2008 – US (real estate bubble leveraged up with derivatives for global contagion)
2010 – Ireland (real estate)
2012 – Spain (real estate)
2015 – China (margin lending into Chinese stocks)
Central Banks have now got in on the act with QE and have gone for an “inflate all financial asset prices” strategy to generate a wealth effect (imaginary wealth).
The bubble bursts and all the imaginary wealth disappears.
The wealth effect – it’s like real wealth but it’s only temporary.
The smart people are financing against this imaginary wealth and buying hard assets that they are insulating from creditors.
When the wealth effect implodes the real unpaid and unrecoverable and unenforceable debts will still be there.
that is going to have to be accounted for.
Just wondering what you are writing about… i.e. real assets?
The only real assets that do not have storage or ownership costs are PMs when held in small quantities. In large quantities they have lots of risk. They can also have costs when you least think so. Government can and has demanded you turn them in or face criminal penalties and they can force transaction costs upon us. Real estate has lots of holding costs. Food, storage costs. Other metals, same thing and uncertain future exchange costs. So, what is it you think you (we) can save our selves with?
Your post indicates you respect state rules and regulations.
I dont.
So our methods are incompatible.
So each to his own.
Everything you say about state abuse of it’s powers is correct.
Buying PM at the current CB inflated prices, is a fools game.
Today the more fiat you amass the bigger the problem you have.
The US is not the place to have anything that is not close to 100 % protection financed. As when it comes up short it will get draconian as will Europe and probably England. Taking the land is one way to attempt to put value back into their fiat.
Rural Australia and canda are probably still reasonably safe with low land taxes. And low risk of complete confiscation as they are so large, with such low populations.
These days the more you have the harder it gets to protect it.
Pm’s can frequently be hidden, almost in plain sight. With a little ingenuity.
When life gets difficult Lead, copper, tin brass and various alloys have much more use than gold so increase in value and a become very liquid. so today scrap is possibly tomorrows PM. As long a syou buy metals at the correct buying prices(Bottoms) they are never a loosing proposition
Who lifts up the 250 kilo steel plate the windmill stands on, that has grass growing over its edges that looks like its been there for years. Unless they KNOW whats under it.
How mang 250 KG slabs of concrete in pathways, actually move quiet easily, if you go about it the correct way??.
Live in a dwelling that says money, with things in it that say money, have problems.
Thats 1 reason why muslims advocate non externally ostentatious dwellings.
Unless you know who warren buffet is and where he lives, you would not pick his wealth from his residence.
POTUS Elect 45 has a front door, worth more than Nigel Faranges house.
The debt situation is totally unsustainable at the moment.
It just has to get to the point where we are forced to face the problem.
“It just has to get to the point where we are forced to face the problem.”
Its past that point, we have lost the western antarctic ice shelf and glaciers Greenland also is going into the sea. So south east Asia goes under 1.5 to 2 Billion people will lose their land and food sources.
The only hope is to reduce global population by more than that, before it completely happens.
The Mekong delta rice and sugar cane field’s are already going saline. The sugar cane is to salty to feed even to cattle again this year.
The people who could and should, do something about it, are to pig headed and self interested, to try.
There will be a big we should have done just before they land at the bottom of the cliff.
Sad part is, they will take most economies with them.
When the people here like myself, and others better skilled, can see what is wrong.
Excessive debt (Particularly NPL’S) mass unskilled asset-less illegal immigrants. Combined with uncontrolled Population Explosions in certain nations.
How can those running the place not.
We are coming close to the conflict point of ever expanding population and credit based Economic System, running into planetary sustainability.
Soylent green could be the future, of the remnants, of humanity.
Unless some painful changes are made. SOON.
Those changes have to be made in places like india and china, as well as Washington and Brussels.
Further
http://www.bbc.com/news/world-latin-america-38235094
And Antarctic is weird as west Antarctic is evaporating whereas east is stagnant so the deniers say east isn’t evaporating there is no problem.
http://www.bbc.com/news/science-environment-38256932