This peculiar creature of an inverted yield curve.
On Thursday, the US Treasury yield curve sagged further in the middle, producing an ever more beautiful middle-age sag, so to speak, that first started taking shape late last year.
The chart shows the yield curves on seven dates. Each line represents the yields from the 1-month yield on the left to the 30-year yield on the right, on that date. The steep green line coming up from the bottom represents the yields on December 14, 2016, when the Fed got serious about rate hikes — the steep slope, with short-term yields a lot lower than long-term yields, is what a yield curve in normal-ish times is supposed to look like. The beautifully sagging red line represents the yields today, May 30:
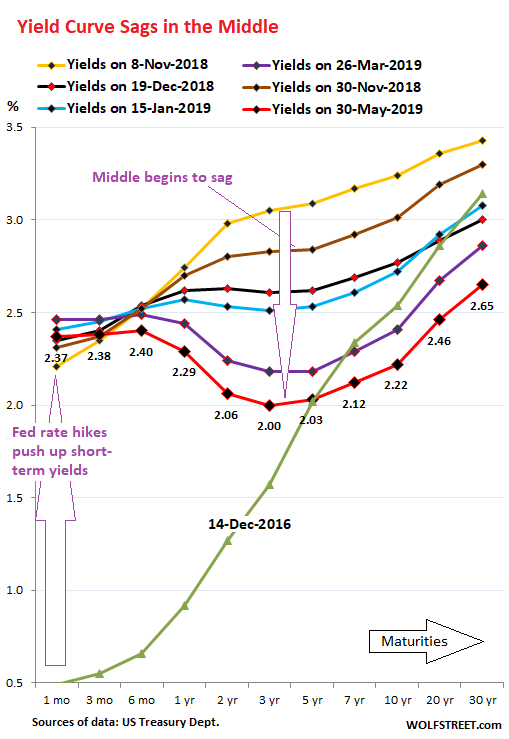
The entire portion of the yield curve from the 3-year yield through the 10-year yield has now dropped by over 1 percentage point since the peak on November 8, 2018. Some more standouts:
The 3-year yield inched down to 2.00%, the lowest since January 2, 2018, forming the low point of the middle-age sag. On Nov 8, it was at 3.05%.
The 10-year yield dipped to 2.22%, lowest since Sep 18, 2017, and below 1-year and shorter maturities; but it remains above the 2-year yield and in this cycle has not inverted with the 2-year yield yet.
The 1-month yield ticked up to 2.37%, from 2.35% yesterday, which had been the bottom of its range, and as is to be expected, right in the middle of the Fed’s target range for the federal funds rate (2.25% -2.50%).
The 6-month yield had been anchored since late October at round 2.5%, with only slight variations. It now too has dropped out of this range and hit 2.38% over the past two days but ticked up to 2.40% today.
The 30-year yield dropped to 2.65%, the lowest since Nov 7, 2016. This is getting pretty nutty, when you think about it.
What began in November with a flat spot between the 2-year yield and the 7-year yield has now turned into this full-fledged middle-age sag as the Fed raised rates one more time in December, thereby pushing up short yields, even as the longer yields came down, but with the largest decreases in the middle.
The yield curve is inverted through the 3-year yield (red line in the chart slopes down to the 3-year yield). But it is still not inverted from 3-year yield to the 30-year yield (red line slopes upward).
This leaves the yield curve inverted in an odd way, with a sag in the middle, and depending on which classic inversion pair you look at, the yield curve is either inverted, or it is not inverted:
- The 3-month-10-year is inverted: 10-year-yield (2.22%) lower than 3-month yield (2.38%).
- The 1-year-10-year is inverted: 10-year-yield (2.22%) lower than the 1-year yield (2.29%).
- The 2-year-10-year is not inverted: 10-year yield (2.22%) is higher than the 2-year yield (2.06%).
The past six recessions followed the 1-year-10-year yield curve inversion with a lag of about 12-18 months. The inversions occurred where the red line (1-year yield) is above the blue line (10-year yield). Click on the chart to enlarge:
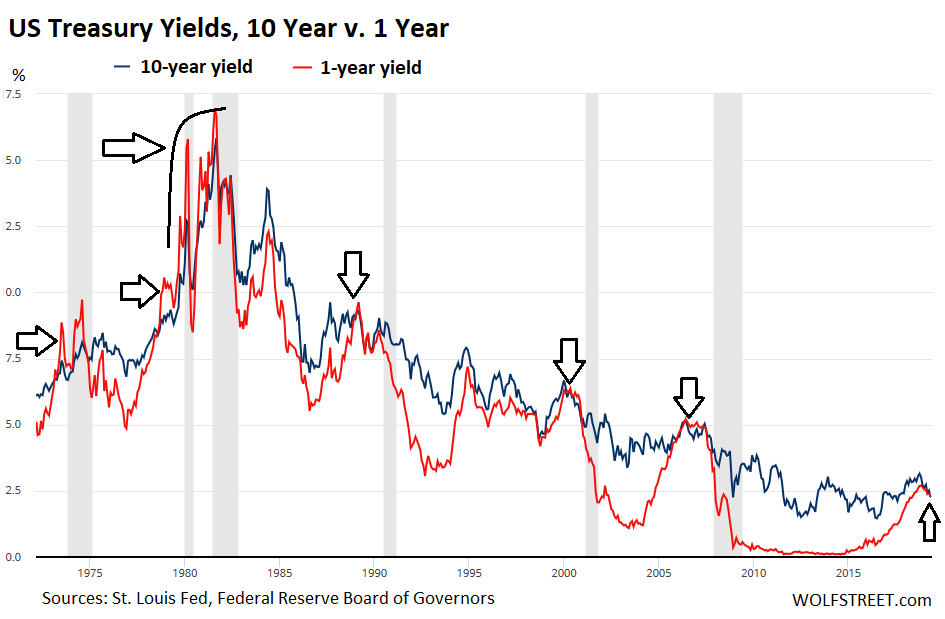
But the oddity remains: Historically, the 2-year-10-year spread inverts well before the 3-month-10-year. Not this time. Over the past six months, the 2-year-10-year hasn’t moved any closer to inverting. Today’s 16-basis point spread is about the same as late last year, despite the bottom threatening to fall out in the middle, which makes this inverted yield curve a peculiar creature with a growing middle-age sag.
Enjoy reading WOLF STREET and want to support it? You can donate. I appreciate it immensely. Click on the mug to find out how:

![]()
Could this be a supply and demand issue with the dynamic of the Fed roll off of treasuries as well as MBS and how Treasury is choosing to “refinance” it?
I don’t know if you have noticed, but the large amounts of SOMA reinvestments when the large scale asset purchases mature and are rolloved tend to lower yields a lot. This is happening a lot more now since QT is almost over. You have record high reinvestments by the Fed.
Interesting point. I made be reading you wrong but I think among other things you are implying that when QT comes to an end, the long end of the curve is going to start sagging more and we are going to see a more complete and normal (as opposed to the odd “middle age sag”) curve inversion. I hadn’t considered that before, but it makes sense.
EFFR over IOER. NOTHING else matters
The Fed has lost control forever. Game over.
Sheesh, Ppp, what kind of stuff are you reading?
Here’s my money market chart:
When the black line (SOFR75p30s [marginal lendees]) makes a new floor around 0bps… game over…
https://ibb.co/bd7j3cG
I think you need to explain this. Why is it game over if the 75% percentile of overnight repo in SOFR trade at the yield of 30year bonds?
Will anyone be lending? Considering that collateral required is about 102% and trade at a discount, the probability that people will trade for a loss or nothing is nill.
Nothing like standing on the brakes in the economy with new tariffs every week or so.
But we’ll all be rich with what NATO, China, Canada, and Mexico are paying into the Treasury.
Good times, good fun..
Months of self-inflicted wounds.
We had the same yours curve shape at the end of 1993 die to massive leveraged interest rate products reflecting insane bullishness on falling rates. The Fed put an end to this with rate hikes in early 1994 to burst that bubble (not to slow the economy!). And burst it did. Bankers Trust at the heart if Structured Rates Products at the time suffered and was sued by clients the World over as they were losing hand over fist with Bankers Trust Structured Rates Products. Remember the Procter and Gamble law suit! At Bankers Trust we essentially invented credit derivatives at the time to restructure defunct Structured rates notes. It was the beginning of the credit bubble. My point though is that the present yield curve simply reflects irrational exuberance after the Fed stopped hiking and it transcends I to the below investment grade / Leveraged Loan Market in the same madness. This curve (and credit spread) are a bubble indication and will blow quicker than people think. It is unsustainable as it is the result of Bullmarket psychology gone awry and destinies to implode cataclysmically as it did in early 1994
The great bond massacre was only a sidebar to lower rates the massive expansion of credit markets and underpinning of obscene stock market valuations. 94 was the crash that turned into a rally, but it was always a crash. 16 is similar. Now we are closer to the end of the credit bubble than the beginning. The bull market psychology has ended. Before there was too much money there were not enough stocks, so they were bid higher ruthlessly. Now the money bids them up, relentlessly without passion, and without regard for price. When they tire of buying other peoples stocks they buy their own. Bonds have always been the catalyst, the money in ‘moneyness’. Now they are losing altitude, the Fed could hockey stick rates to give the illusion of replacing lost value to it’s money, but its futile. They are still in the bad spot of offering a ten for two twenties at the repo window. Keep rolling that over and see where you get.
Just rack up the defense spending – it’s only a paltry 2.5bn a day, it needs to be much more – job done, stockmarket take-off. Jobs, jobs, jobs!
“And soon, very soon — after the victory of our movement — we will defend all the migrants in the American continent and all the migrants in the world,” Obrador said, adding that immigrants “must leave their towns and find a life in the United States.” He then declared it as “a human right we will defend.”
That evil Trump. Shame on him.
I think there are 2 things that we agree need to be accomplished.
1) Slow down the stock equity and housing bubble. Tariffs seem to be accomplishing this.
2) Reduce the deficit which tariffs should also accomplish.
Should I credit Trump or the Fed?
Hoover implemented Smoot-Hawley tariffs during the beginning of the Depression and it was a disaster. What happens when tariffs are introduced during the boom times created by Obama?
Well at least now the 6mo CD pays more than the 6mo t-bill, last week the t-bill paid better, now the CD is just slightly better,
I suspect that must have pissed off the banks that t-bills were paying better than CD’s, now at least banks can get financing on the short-term.
So tell us who exactly would buy the 10yr? I know there is a ton of ‘stuff’ tied to the 10-yr, so artificially keeping it low helps the ‘economy’, but I’m sure most people on earth are buying this short-term gov debt. Especially given +10 years out could be post-reset and who knows how safe this stuff really will be?
Given parity like now, I would prefer a mix of CD’s ( china, … india, … better US banks ), over the insecurity of ‘ussa gov debt’, but a few weeks ago t-bill were paying like 10 basis points over the same time-frame on CD’s.
How safe is safe these days Wolf? Given that banks are insured $250k, but we all know the that only covers that first 1% of claims ( pool reserves ), of course the FED could create infinite fiat to make good on t-bill’s,
IMHO the reason that 6mo t-bill is so high, is that this is what is required to attract ‘real capital’ abroad, and nobody on earth ( outside USA ) would dare buy long term USA debt. So, it doesn’t really matter what the long term is-is, other than for political reasons.
There is a difference between the foreign government and private buyers.
I can see the government buying short term just to park the dollars they need to service payments and exchange, but the people like in Japan and Europe have excess savings that are looking for yield and can go long term.
What’s with the y-axis? Or am I reading it wrong?
The Y axis is the yield on the particular note.
Yes. I know what it represents. I mean the numbering. Maybe it’s my phone. It looks like it goes from 7.5 back to 0.
It does go from 7.5 back to zero. It should be 10.0, then 12.5, etc., not zero.
If they are ready to throw a deliberate match on the system- a US credit downgrade is long, long overdue.
Portugal just issued “panda bonds” denominated in Chinese yuan. This is just the beginning.
No it is not.
Those bonds can be purchased inside ccp china with cny/rmb and sold outside ccp china for anything. Until ccp china jumps them.
Portugal has the cheapest EU passports going, buy a 350 K euro house get an EU passport and is attracting a lot of ccp chinese who want to anything but CCP chinese.
ccp china HATES cny/rmb bonds it does not control for the simple reason they get used for currency flight.
The biggest takeaway on the chart is that the interest rates keeps trending down. As wealth has been concentrating over the past 30 years due to tax breaks for the wealthy, demand in the economy has been falling. To prevent GDP from tanking, they have to keep reducing rates so the middle class can incur more debt and spend, which only exacerbates the wealth concentration problem. It’s a downward spiral until something breaks.
What chart are you looking at to see rates trending down? Maybe you see the gnats and miss the camel. The interest rates the FED sets were ~0% year after year until 2016.
Not surprisingly, the tax structure actually favors both ends of the wealth distribution. It is those in the middle that have a weak voice. They are not being helped by the tax structure at all, but they are being helped by employment and wage trends.
You have to look at the long term trend. Rates have gone gradually from over 15%. There’s been a slight increase lately in the short end, but the long term trend is about to continue lower assuming the Fed continues its rate suppression and its wreckless plan to avoid recession at all costs.
The interest rate rise of late is the gnat. The camel is the long-term trend that has been pursued by the Fed.
Fed policy mean everything here. Will the Fed allow a recession, which is needed for long-term economic health, or will the Fed continue printing money and suppressing rates (which will lead to a bigger recession later).
What I see is that today people are placing bets that when they buy that 3yr bond today at 2% yield that they expect to be happy because by the last year of that the Fed will have interest rates back down near 0%. Lock in a 2% rate before the Fed goes back to ZIRP. It is also interesting that the wisdom of the market is saying that over the next 10 years that 2.25% rate will look good. If you were expecting short term rates to hold steady at 2.5% or go higher, you wouldn’t lock your money up in a 10 year bond that has a lower interest rate than what you can get today short term. But again, if the Fed is closer to ZIRP on average over the next ten years, that 2.2% won’t look so bad.
And despite this, people still want rate cuts?
This shows that the FED should do a rate hike, like right now.
That is what the Fed has done historically, i.e. keeping raising rates and further invert yield curve right into the next recession. The average time span between the last rate hike and first rate cut has been only a few months, i.e. quick policy U-turns. Powell has used a diffrent playbook.
In an ideal world, the FRB (Fed) would now start selling their UST with 1-20 year maturities until the yield curve becomes monontonically increasing.
Would that not be great? Just punch Wall St in the face! Walst St has been buying down the mid-long end to front-run the FRB *and* to signal to FRB what Wall St wants. If FOMC decided to teach Wall St a lesson that would be one hell of a show. But I’m not holding my breath.
I’m wondering if the FOMC plan to unload (outright sell) some MBS could have the same effect? that is, if they really follow through on it.
That is what I have been thinking too. The FED should target the sales of new bond issuance by maturity towards some idealized yield curve: selling maturities evenly across the curve when it is near ideal, and focusing heavily on selling towards the maturities of bits inverted or even sagging towards inversion as these issues occur. I am all for that as a new FED mandate … not that my opinions have any effect on anything at all in these regards.
If the FED sells MBS they should have it all on Wheel of Fortune so that they randomly offer their MBS. My guess is that a large portion is in default several years ago.
Another recession predictor that historically worked even better:
A recession is just about to start (within 1-2 months) when the following condition is met: a yield curve inversion (the 3m-10y is used most often as a reference) persists for at least few weeks and suddenly the curve steepens: i.e. the inversion disappears and the longer maturity yields again more than the shorter maturity. Sometimes that coincides with the FED starting to lower rates.
This can be noticed too in the last graph from the post.
History never exactly repeats itself but it many times rhymes.
More debt seems to be driving interest rates down, not up like Milton thought.
Central bank zombies in action or not?
…CB zombies who all happen to be alumni of particular institutions in Wall Street/City of London who enjoy access to all the cheap cash in order to fuel the speculation which continues to drive inequality.
Important to identify the REAL root cause.
+) Economists tend to focus on yields and not principal. When bonds in the aggregate exceed new issues by a very large amount, yields cannot reflect the change. When you add supply to anything, you dilute its value. For three decades bond prices rose along with supply, while the market could still set yields, now the process works in reverse. To make matters worse we are pushing for lower rates, while China holds their nuclear option, which means nothing if there is a buyer on the other side, (If this is Tuesday it must be Belgium). Does it matter if you have to pay interest to yourself? Take those bonds off balance sheet? It might help revenue? In a deflationary crash there is no bid, no matter where you set the yield, or buyers lowball at auction. The crisis is at hand, the market has more confidence in stocks and corporate bonds.
ci vi e
Banks have tightened credit to reduce risk. Some banks are already in trouble with credit card and subprime auto loan delinquencies. They lent to people with bad credit histories. The net interest margin disappeared and banks are hungry for yield.
People who walked away from mortgages before have been buying houses again. If their mortgages go underwater they might walk away from their obligations like they did before.
Along with everyone else in true non-recourse states that held on last time and then felt like a sucker when dumb financial behavior was rewarded.
Fortunately the sales volume was lower than 2006 and so there as fewer mortgages exposed until prices fall a ton.
The SPX correction is 33% of the move from from Dec 2018 low to May 2019 all time high.
I’d like to see a trial sale of thirty billion of the crud that supposedly backs social security and medicare.
What ever happened to price discovery?
QE.
Depending om your theories you have a further 8 to 28 years to get QE effect of of just the Treasury system. Let alone the rest of it.
Think of all those 20 30 50 year loans at fixed low interest, made with QE cash, and what they brought, and how long the effects of that, will remain in the system.