Unless there is a sudden catastrophic event, hiring trends don’t go from awesome to shitty in just one month.
The Labor Department reported this morning, as part of its nonfarm payroll data trove, that only 20,000 jobs had been created in February. This was a shitty number. About 100,000 new jobs are required on average per month to absorb the growth in the labor force. But here is the problem I have with this number: Unless there is a sudden catastrophic event, hiring trends don’t go from awesome to shitty in just one month.
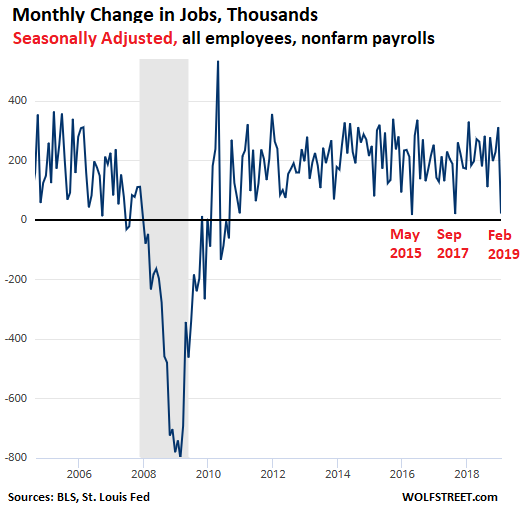
January was “awesome” with 311,000 jobs created on a seasonally adjusted basis, while February was “shitty” with only 20,000 created. This happens occasionally, these large month-to-month variations in an overall unchanged trend. It could be factors such as hurricanes, or government shutdowns, or just statistical quirks. What you get is a shitty month sandwiched between two good months. The last two times this happened:
- Sept 2017: +18,000 jobs, between Aug +187,000 and Oct + 260,000
- May 2015: +15,000 jobs, between Apr + 211,000 and Jun + 282,000.
The chart shows just how noisy even the seasonally adjusted data for month-to-month job creation is, but with longer term trends clearly visible, such as when things went to heck from 2007 through the Great Recession:
The job market is heavily impacted by seasonality. This includes the plunge in jobs every January as retailers shed seasonal employees. Every January, around 3 million jobs are lost from December. This is visible in the “not-seasonally-adjusted” data. Here are the past four Januaries, not seasonally adjusted:
- Jan 2019: -2,897,000
- Jan 2018: -3,098,000
- Jan 2017: -2,877,000
- Jan 2016: -2,975,000
After the big and expected job losses every January on a not-seasonally adjusted basis, there is a big bounce every February, with around 1 million jobs created. This February was at the low end of this range, as was February 2016:
- Feb 2019: + 827,000
- Feb 2018: +1,237,000
- Feb 2017: +1,030,000
- Feb 2016: +831,000
Since these seasonal changes are known and largely predictable, seasonal adjustments attempt to iron them out. The chart below shows the same data depicted in the above chart of month-to-month changes in jobs, but on a “not-seasonally-adjusted” basis.
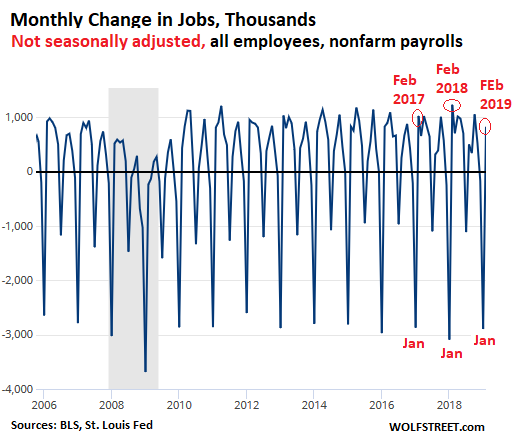
In this chart, there is so much seasonal variation (noise) that it is hard to see even huge trends, such as the millions of jobs lost during the Great Recession. For example, in January 2009, 3.69 million jobs were shed, instead of the normal range of just under 3 million. That made a difference of 690,000 more jobs lost than normally in January (the Labor Department reported that on a seasonally adjusted basis, 783,000 jobs were lost that month).
The data trove of the jobs report is obtained from two types of surveys: one survey that goes to households (“Household Data”), and the other that goes to businesses (“Establishment Data”).
I have been compelled to participate in both types, as representative of our household and as representative of my WOLF STREET media mogul global empire. These are huge surveys. If I remember right, the household survey said that it went to over 100,000 households. And when you as company representative or as household get the notice that you have been randomly selected to participate in this survey, it comes with clear language telling you that you’re compelled to participate. This keeps the statistically important random selection intact.
Businesses receive the survey in randomly selected locations. For example, an Amazon fulfillment center in the Central Valley might get the survey, and it has to reply with data from just its fulfillment center. If Amazon’s A9 Search in Palo Alto (Silicon Valley) gets the survey, it has to respond based on the data at that location. This is how the jobs report separates out Amazon’s warehouse workers from its software and hardware engineers and its retail employees.
Other data in the jobs report indicated that nothing catastrophic has happened in February.
The tidbit about the 20,000 jobs created in February comes from the seasonally adjusted “Establishment Data” of the jobs report. That part of the data also shows that hourly earnings rose 3.4% from a year ago, the biggest year-over-year increase in 10 years, to $27.66 per hour.
The seasonally adjusted Household Data reported some positive tidbits, for example:
- The headline unemployment rate, narrowest definition, declined to 3.8%.
- The labor participation rate, at 63.2%, was flat with January and improved from 63.0% a year earlier.
- The number of employed rose from January to February by 255,000, to 156.95 million.
- The employment-population ratio, at 60.7%, was flat with January and improved from 60.4% a year earlier.
- The number of unemployed fell from January to February by 300,000 to 6.235 million.
So for the lousy headline number – “20,000 jobs created” – to become a trend of a real slowdown in hiring, we will need to see a couple more month of lousy data. This happened in 2007. The data still spiked and dropped month-to-month, but it was a trend of lower spikes and bigger drops until the bottom just fell out. So if we get lousy “jobs created” data in March and April, peppered with other lousy jobs data, it would be a sign that hiring is slowing down. But for now, the data is inconclusive, as they say.
Enjoy reading WOLF STREET and want to support it? You can donate. I appreciate it immensely. Click on the mug to find out how:

![]()
Fixed now. Please delete my earlier comment.
Up and down for everyone. 2 months ago Canada’s report was poor and many so-called experts were openly wondering if Canada was entering a recession? (Zero hedge, etc) Today’s report was 56,000 jobs. If adjusted for the comparative economies, the same number for US would have been 560,000 jobs.
“Canada’s economy added 56,000 jobs in February, and most were full time, Statistics Canada reported Friday.
Economists had been expecting a flat showing for the month, with a little over 1,000 new jobs. But the numbers blew past those expectations thanks to a surge of full-time jobs.
A total of 67,400 full-time positions were added during the month but 11,600 part-time jobs were shed, accounting for the 56,000 net total.”
Am I celebrating with glee? Nope. I’m just glad my kids are doing okay with decent jobs. It could continue and it could go sideways. Everything is so haywire and uncharted anything is possible these days.
59k/67k of the jobs created were in Ontario. What the hell happened there? Did uBer or Lyft just get approved?
And still the interest rate trepidation continues. If rates cannot be raised with such seemingly stellar figures, then when is the right time?
Canada population is not 10 times more. It is around 8.5 times. It used to be 10 times 25 years ago.
And yet….Canada pumps out a surprising 55,900 jobs the same month.
And with those canadian numbers maybe a rate hike to come with the awsomeness
Poloz is hinting at a rate cut to save the housing industry and make the banks more profitable. This will raise the price of housing in the GTA but the Vancouver area will continue to fall. No one can afford a house in either place so cutting rates just like in 2015 will destroy what’s left of the Canadian economy.
Canada since recession has created less number of jobs per capita. It is not 10 times the population. But 8.5 times. In 2010 their unemployment rate was lower. Now US s lower by 2%.
Just slow growth with WAGE INFLATION. That means rising rents which will drag property prices up very slowly.
Rent seekers smell blood.
Stag(less jobs)Flation(3.4% wage +) put FED in a AWESOME position. If they ease, wage flation up, if they tighten, even less jobs.
I work in medical imaging in a coast to coast company. A few months ago they began eliminating positions and reducing inventory.
You are right. I would not panic. Wake me when the unemployment rate is at 4.75% as it was in July 2001 and October 2007. Then i can start to worry about my “at risk” stock portfolio.
Besides, even if the S&P 500 corrects, it will not be a big deal as it will climb again because our Administration, Congress (Large Corporations), our Central Bank and Wall Street want it to continue climbing. It is about the only thing ($$$) that they are all in agreement on.
Thank You Kindly.
I hear many whine about the risk of today’s higher debt-to-GDP ratios and how this means there is great risk today. What I don’t hear about is the viewpoint that higher debt ratios imply slower growth, hence lower inflation, and hence no need to prick the asset bubble with Fed tightening. The new normal may be one recession after 25-35 years of expansion because higher debt levels make it easier for the Fed to steer the economy. The great moderation may not be a misguided idea after all.
Every bear market, there is ALWAYS this “hitch”, the “hope” and I think this time , the hitch is the “central bankers and governments will NOT allow price to go down and they will ALWAYS save the day”. With that, they will sell you down the river of hope.
OMG, Wolf, are you saying they were shitty to begin with, and it’s been masked all this time. *Starts panicking and hyperventilating*
WHERE IS THE SELL BUTTON.
Seriously though, I bet all of the real economists and experts realize that this is just noise. But this makes for a great headline by the media, and the best part is this is self perpetuating, generating instant sell off on Wall Street (because they need an excuse, OMG the jobs number suck, we’re all going to hell), which in turn generates the inevitable headline: “Wall Street falls this most this week, or month, or quarter, or whatever.” More headline to click bait people or sell newspaper (OMG, I just dated myself).
Then on it goes. Wonder what next month’s unemployment numbers will look like. If it is in line, then the media will have a field day with “corroborating evidence.”
Unemployment and Jobs numbers are always manipulated. The BLS factors in things like adjusted death rates. They don’t know so they just plug a number in. It’s a guestimate. The numbers also don’t accurately reflect those able to work but disillusioned and no longer seeking work. Those Underemployed that can only find part time minimum wage jobs. Those 55 & older now subject to blatant age discrimination in the work place. There a lot of young workers with a collge degree making barely over minimum wage. Barely enough to survive. So these numbers are always bunk. Just like GDP they’re ficticious.
Absolutely.
I applied for one entry level job that their HR department had padded out with a long list of desireable qualities, qualifications, and experience that I actually fitted. You know the stuff – job is pushing a cart of spares around a jet engine plant, a degree in jet engine design is desirable. In fact I’m pretty sure I was the only person in the entire region who did fit it. Didn’t even get called for interview. Reason? Over 50.
And yes I did explain why I wasn’t going to disappear after 3 months if something ‘better’ turned up.
My objection to all of this is the quality of the data. Whilst bits of it are best practice (like the random household surveys) what actually counts as employment, and what the quality of that employment is, and who counts as unemployed, renders the whole thing functionally worse than useless. For example, just because people haven’t applied for a job in the last 3 weeks does not mean they aren’t looking for work. There’s an almost endless list these days of good reasons to not bother applying.
It’s the same as the hedonistic adjustments to inflation; it’s all BS designed to pretend that things are fine when they are awful. Furthermore, it is actually worse than useless, because after a while it becomes necessary to make policy decisions to keep the fake numbers looking good, rather than the correct policies which should be to fix the real problem that the fake numbers were intended to hide.
Classic Wolf using facts reason and logic to make sense of the world around us, has he ever considered that sometimes we just want to be mad?
I’m mad all the time :-]
Not me! God put me above all that …
??
I fixit Mr. Howard
https://ibb.co/pPCVg2K
The thing is ….. The “data” that we’re provided by our rulers is probably on a par with China’s government “data” .
Totalitarian oligarchies in any country never speak the truth. They don’t have to.
I understand your skepticism Marco however as government auditor I can assure you there are standards in place to avoid the worst of it.
I beg to differ Howard!
as a person of integrity ( You) might be doing a great job at your role,
But all I need here is to recall your attention to Wolf’s article about the amount of (Credibility ) that the US
Government have garnered in the previous survey!
Remember there position in the ladder?
Last!
Imagine that! Even F&$@n FB did better!!!
Dept of Liebor + Bureau of Lies & Scams = Everything is Awesome!
I agree no reason to panic. IN fact the U6 number was fantastic.
They just make the figures up as they go along. Once the DXY index hit a new high and Europe gave up on raising interest rates just like clockwork the jobs report comes in low to kill the U.S. dollar. The converse is also true if the U.S. dollar gets too low.
Polls showed HRC was going to win with a landslide.When a small employer is ordered by the state to servitude compelling them to respond they might not be as accurate as they could be. Apple Inc. could and did defend itself against servitude, Most of us cannot,and perhaps we respond in kind. Thank you Wolf for staying at this in order to use even suspect data in a useful way.
It may be contrary but does the economy only add jobs when growth is below average? The labor market has been described as overheating, this should be a positive sign for the Fed. They backed off the rate hike program and the job market cooled down. If the economy moves toward recession they have taken the right steps.
Could the Fed create more uncertainty and confusion in financial markets with it’s transparency and forward guidance on policy and interest rates? Would it be better to just set the rate with no comment or drama/guidance?
For example the Fed’s constant guidance helped get us into and remain in the current bubble, and it’s recent not-hawkish-called-by-some-as-hawkishness and it’s subsequent flip flip from this so called hawkish guidance caused market ups and downs.
Which is not to say it’s actual policy caused what it caused.
So, instead IMO at each and every meeting, the Fed should have an interest rate. Weather it be up or down from it’s prior meeting, it should be the one the and only interest perfect rate that right and correct. No guidance, none what so ever. Each change of rate will more perfect than the prior.
Like HAL 9000 the Fed should stick to the line:
“The current interest rate is for all practical purposes perfect and will remain perfect. There can not be a mistake if it’s calculation and there never has been. The interest rates we make have a perfect operational record. They have never been know to be wrong or to be processed in error. There is no more perfect guidance than knowing that any time the interest we implement is for all practical purposes without error. If and when we recalculate a different perfect rate everyone will know about at the same time, and it will be prefect too.”
The Fed does a fine job of cleaning up the messes made by the Financial Industrial Complex. The Fed gets blamed anyway, but really, it’s like blaming the messes on the maid who doesn’t actually create them.
The problem is the FIC. It creates the messes because it has the power to run governments to serve its greed, along with everything else by derivation. The FIC needed to be brought to heel a long time ago, because now, certainly for most people, it is way too late.
Gather ye rosebuds while ye may. Years ago I made the easy prediction that someday the FIC will create messes that can’t be cleaned up, which is where you are now. First, the financial mess is on hold only through severe distortions in how economies are managed, but that hold is only temporary, as several commenters here rightly suspect. Second, the ecological mess, for which it is also responsible, is well out of control and is unlikely to be survivable by humans. All the information confirming these conclusions is readily but will not be acted upon for reasons which should be obvious.
For the world’s more full of weeping than you can understand.
Monthly numbers bounce too much and are subject to too much revision to be relied upon – but the market loves data – almost any data. Better to watch weekly jobless claims for any turn in the economy. So far they have leveled out at about 225,000. If this starts ticking up to 240-250 then maybe we have the start of the long awaited slowdown. To me, overall it looks like economic forward momentum is winding down and shifting into neutral. This will be followed in the not to distant future by moves don.
Could the government shutdown have led to the wildly gyrating numbers? It looked the January employment numbers were off the charts yet February went straight to the crapper. It’s possible that both numbers probably need to be adjusted to reflect actual employment data, with January not being as good as advertised, and February being a little better than indicated.
Complexity confounded by mendacity, multiplied by acts of God and the whole taken to the square root of citizen’s mistrust.
Thanks to Wolf . He gets it straight for us.
The part that did catch the eye of this math geek was that while a very low number for ‘jobs created’ was reported, it was also reported that the ‘unemployment rate’ went down. As Mr. Wolf said in his article, there is a number of jobs that need to be created each month just to match a growing population. Thus, if the ‘jobs created’ number is really low, then you expect the ‘unemployment rate’ to go up as not enough jobs are being created. But that rate went down? Just made me wonder if something wasn’t quite right with these numbers, especially with the ‘seasonal adjustments’ involved. Probably an ‘adjusted’ number coming next month?
Since we are now 21 months out from elections, I would not quite expect the government to be in full-blown liar mode when it comes to economic statistics. By next summer, that will highly likely be the case. But, I suppose the onset of full-blown lying about the economy starts earlier and earlier each election cycle.
Nothing to do with elections. This data trove is based on two types of surveys:
1. The establishment survey (of businesses) found that 20,000 jobs were created.
2. The Household survey (of households) found that the number of employed rose from January to February by 255,000, to 156.95 million.
The unemployment rate is based on the household survey, which showed 255,000 more people had jobs.
Funny, Just thought yesterday that I hoped you would cover jobs soon. Enjoyed the report.
Unemeployment is as low as it has been in my lifetime and I have lots/mostly grey hair. Wage increases of well over 3% is solid …the bosses are paying again. Yes, that sets the Fed’s hair on fire. People that were in the shadows for a while have been coming out and seeking/finding jobs. Good news indeed.
Though this type of news is often late cycle stuff and I get that, but still happy for all who have worked and earned the wage gains … and self esteem that comes with a job well done. Self esteem is along the road to happiness and it must be earned.
if no one has mentioned it yet, the small jobs increase was largely due to unseasonable weather during the survey reference weeks of both January (warm) and February (cold)…
basically, January “added” 311,000 jobs because the usual winter weather layoffs were delayed…
check out the MoM data for construction, leisure & hospitality and other weather impacted jobs…
https://www.bls.gov/news.release/empsit.t17.htm
Wolf,
My understanding of the US election system is that ( you’re Not compelled to vote? correct me if I am wrong.)
Under what laws, you’re compelled to participate in these Surveys?
Especially that you’re running a global Empire now :)
“My understanding of the US election system is that ( you’re Not compelled to vote? correct me if I am wrong.)
Under what laws, you’re compelled to participate in these Surveys? ”
Americans are not compelled to vote (we should be; I’ve always maintained ‘If I don’t vote I can’t bitch’). The only ‘survey’ we’re ‘compelled’ to participate in is the Census, conducted every ten years. It’s pretty comprehensive and, IIRC, contained a disclaimer that we were required by law to complete it, but I’ve never heard of anybody getting harassed for not completing it.
“Your response to this survey is required by law (Title 13, U.S. Code, Sections 141 and 193). Title 13, as changed by Title 18, imposes a penalty for not responding. We estimate this survey will take about 40 minutes to complete.”
Thank You California Bob and Wolf for clarification.
Why is there an almost preternaturally reflexive pundit push to normalize, de-nut, and rationalize/minimize egregiously shitty, ominously degenerating statistical reports (20K?! C’mon, 20K?!) as some capricious ilk of anomalous – but that outright kabuki media frottage ensues when there’s a blockbusting report, as January’s?
This jobs report was 1/10th – ONE TENTH – of the worst case Mendoza line scenario; and it came dragging itself into today with a witheringly consistent, 5-month degenerative global macro milieu – shit! China’s print of more than 21% yoy export greasy dump was less than 12 hours cold!
And for all of you utilitarian statistical mugwumps that eschew the Occam’s razor of further proving the deteriorating statistical metrics – for standing a-cheval over a picket fence of dismissive, hyper-indulgent rationalization that a shrug is as good as the statistical quiddity: well, you’d best hope the ground isn’t shifting while your still astride that fence.
autocorrect sucks. should be “you’re still astride…”
What are you going to write when March comes in with 250K? Write the same in reverse?
:-]
Hey Wolf,
Looks like Maggie’s on a roll ! :)
But I guess, I better keep quiet! :)
I contend that a jobs report will be the most trifling of statistical vagaries having any eristic relevance: it is my complete opinion but contention nonetheless that the 2017 GOPer Treasury rape vultures will have, in critical mass of roost, come home to begin the trumpCrash in earnest. Maybe the timing’s of and it’ll be a GE or DB immolation in the 3rd quarter that will precipitate it.
That being said: I find it recursively feckless to nigglingly handle the integrity, methodology, or general issuance of reports/data like fruit at a bodega. Decades upon decades of regularly issued reports and economic manifests of course are hardly rhadamanthine tablets of unequivocal objective content – but they are no more, nor less, in/valid beyond speculative analysis and punditry. Their predicability is always a Cassandra’s quandary, depending on one’s point of view.
There are *always* reasons – some postulated by more erudite analsyts (like yours) and some by frustrated rabble scribbling in the margins of commentary (like mine) – to transmogrify the *meaning* of data to fit procrustean pattern biases (most often because options are not exactly toeing speculative lines…)
But just like indomitable HFT/algo offensives, which can overwhelm low-vol markets and unerringly engineer vertiginous bull spikes after Fed-fed de facto capitulation, are never kvetched over for their part in that – the CNBC Mikado goes ballistic and misoneistic when those very same mathematical gremlins become apostatic at programmed positioning impediments, heading for unpredictable nadirs.
My only point is that an unimaginably catastrophic print like 20K is INDEED an unimaginably catastrophic print.
Was I scraping the slag of the financial blogs for bits of bearish gold when that 304K print hit? Sure. But in the context of the utterly corrupted buyback money-laundering Ponzi; the obfuscated CB omnipotence; the proto-fascist incest of Scummotrump’s unprecedented jawbone propaganda; the pernicious degradation of actual price discovery since the Great Bush Recession targeted Treasury socialism; and the apperception from the 2008 clusterfuck that metrics don’t matter until they do – I took what I thought was a ridiculous jobs print in stride.
So, will I rewrite my contention that numbers matter if a 250K print next month appears? No. I will flip the same intuitive coin of probability for my continuing bearish thesis should the macroeconomic sluice of really dismal miasma concomitantly proceed apace with it.
EVERYBODY has pattern biases and prejudicial statistical spelunking to explain and understand the validity of their positioning in a weird, seemingly fun-house Fed transmogrified market. Some may take that hypothetical 250K print and splash it all over a geisha financial page as proof that it abnegates the 80% of shitty data – and that you should buy stocks so bloated with manipulation that purchase of shares requires a diuretic!
Or I may be so cognitively dissonant that I’m totally wrong about my premise that post-2008 GDP is little more than debt service on Treasury rape, with a handy dollop of leveraged consumer serfdom & technological impulse buying rutting – baked into an apple pie stalker ad zeitgeist.
But 2018 and what I perceive to be a monstrously historic 1M Head & Shoulders pattern – starting to shrug into decline today, I think – lead me to keep cash parked and continue to have my short positioning gnawed at… for now.
Thank you for making me scramble to the dictionary!!!! LOL!
Tell us what you really think. Then again, please don’t, there is nothing left to cover! :+}
Yeah…what she said….
The real reason why the job numbers dipped so much in February was as I was drawing the job chart line my Jeep accidentally hit a pothole!
Sorry about that!
The BLS cubicle dwellers were all on furlough until late January. Then after a full pay period to get back into work mode (or work mood), they slapped together this employment report.
Let’s see what next month brings.
Time for a Wolf “Panic”-o-meter: frequency of occurrence of the word panic in the headline in a given month… so far we’re not supposed to panic over retail sales (mentioned in Feb), and Feb NFP (mentioned in March)… permission to crawl the site links and pages to mine the headlines? :)
Thank you Wolf!
A sample of 0ne does not make a trend. You are correct.
However, the cautious investor(and homeowner/homebuyer) watches everything and thanks to you, we have some visibility into this.
An ideal control system response is a slight overshoot and then slight undershoot until a stable value is reached.
In the stock market, the yellow flags are flashing because the market is unstably oscillating (though not at red flag values). Trump tweets and Fed rate raising are affecting the market too greatly.
The housing market is starting its theoretical drop to an ideal undershoot and then theoretical stability. It’s too early to see how low the undershoot will be. However, I suspect it to lag the stock market and yellow flags will be flying.
I like this comment I read this weekend: Bart Melek, head of commodity strategy at TD Securities, described U.S. dollar strength as the “cleanest underwear in the dirty laundry.”
the jobs figure confirm the 16.60 million sales in cars. People use cars to go to work. since only 20,000. jobs were created it follows the figure was going to be light no work= no need to purchase cars to go to work.