The surge in energy costs is bad, but there’s a lot of inflation from other sources.
By Wolf Richter for WOLF STREET.
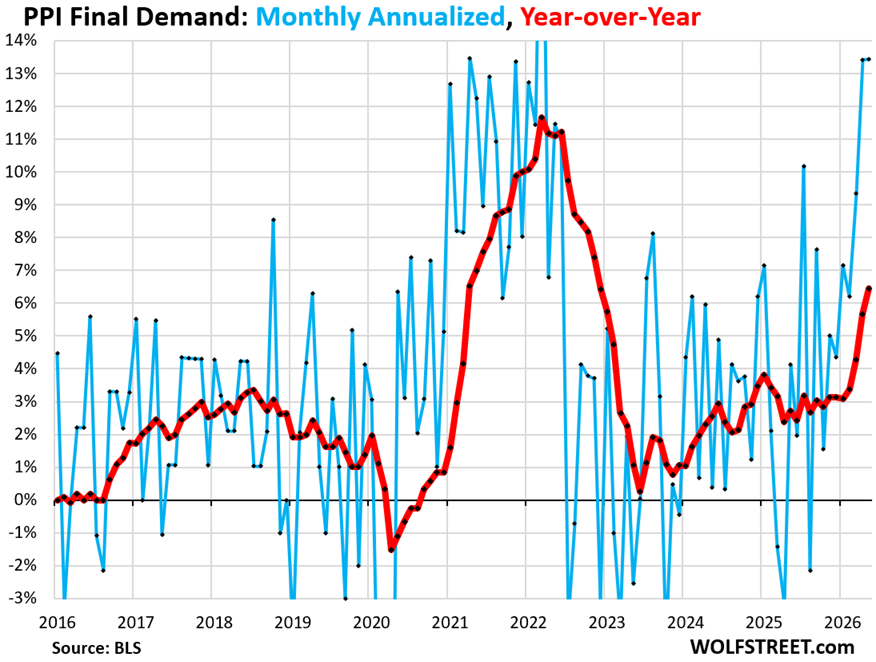
The Producer Price Index final demand (PPI), which tracks inflation in prices that companies pay each other, spiked by 1.06% in May from April (+13.4% annualized), seasonally adjusted, for the second month in a row, and both of these month-to-month spikes back-to-back were the worst since the spike in March 2022 (blue in the chart).
Year-over-year, the PPI spiked by 6.4%, the worst since December 2022, according to data from the Bureau of Labor Statistics today (red in the chart).
But it’s not just energy: The 6-month “core” PPI, which excludes food and energy, rose by 6.2%, the worst since August 2022. The 6-month services PPI, also rose by 6.2% annualized, worst since June 2022. The 6-month “core” goods PPI, which excludes food and energy, jumped by 6.6% annualized, worst since August 2022. There is a lot of inflation going on in here.
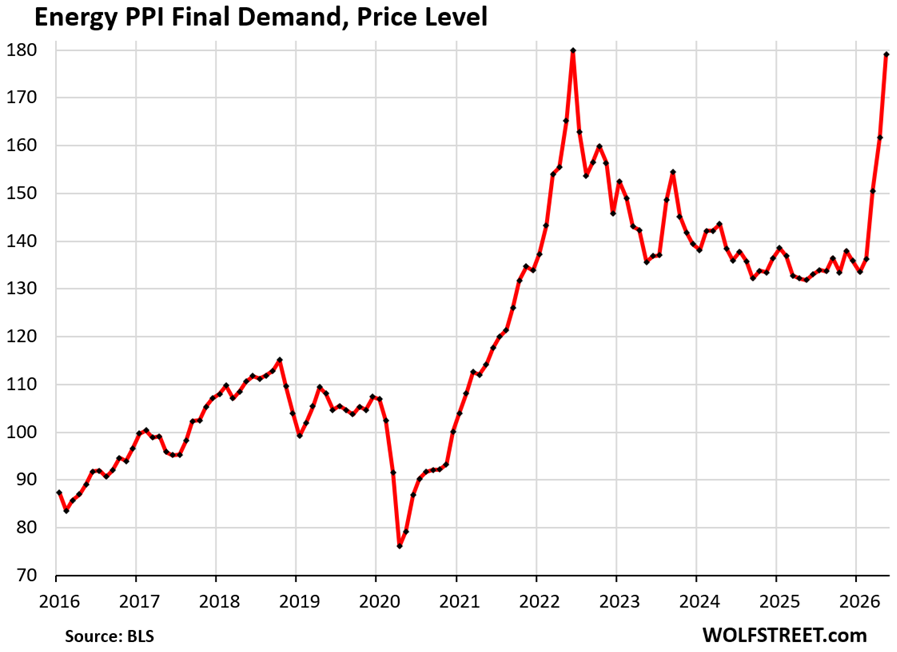
Energy.
The PPI for energy prices spiked by 10.7% in May from April (not annualized), the third month in a row of steep spikes. This propelled the year-over-year increase to 35.8%.
The chart shows the price level of the energy PPI, rather than the percentage change. The big spikes over the past three months pushed the price level to the peak level of June 2022. Note how rapidly energy prices spiked in 2021 through mid-2022, and how slow they were then in giving up part of that spike. This index tracks all forms of energy that companies pay for, including electricity, which has been relentlessly surging for years under the added demand from data centers.
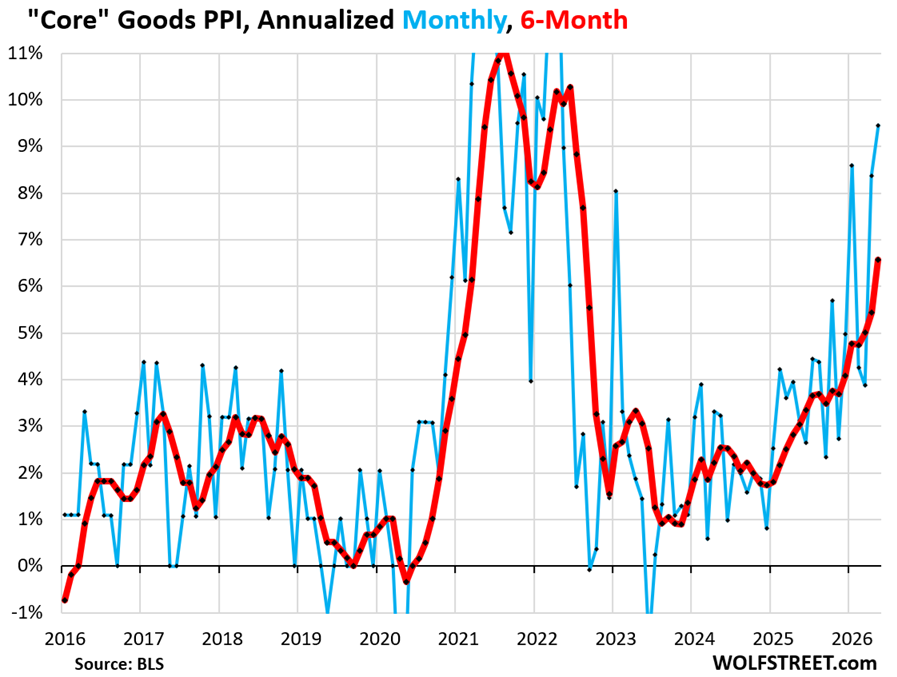
Inflation beyond energy.
The PPI for core goods, which excludes energy and food components, jumped by 0.75% (+9.5% annualized) in May from April.
The 6-month core goods PPI, which shows the recent trends, spiked by 6.6% annualized. It bottomed out in late 2023 and has been zigzagging higher ever since (red line).
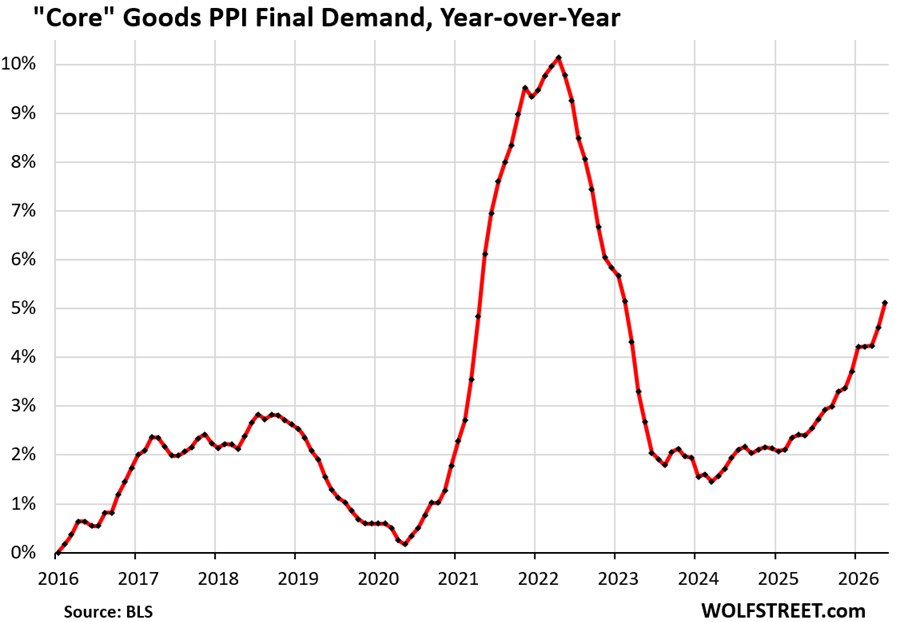
The year-over-year core goods PPI rose by 5.1%, the worst since February 2023.

These were prices that companies paid other companies. In 2025, those prices started to include tariffs that companies were passing on to each other, though consumer-facing companies had a very hard time, or were incapable of passing on those price increases to consumers without losing a lot of sales and market share. So these consumer-facing companies resisted price increases from their suppliers, and that resistance shows up in the much smaller increases that companies paid for the finished goods, as tracked by the finished goods PPI (+3.7% month-to-month, +3.8% 6-month, +3.7% year-over-year).
The services PPI rose by 0.33% in May from April (+4.1% annualized), seasonally adjusted, after the 0.73% spike (+9.1% annualized) in the prior month.
The 6-month average PPI shows the recent trend. Like the core PPI, which it dominates, the 6-month services PPI has been zigzagging higher since the August low.
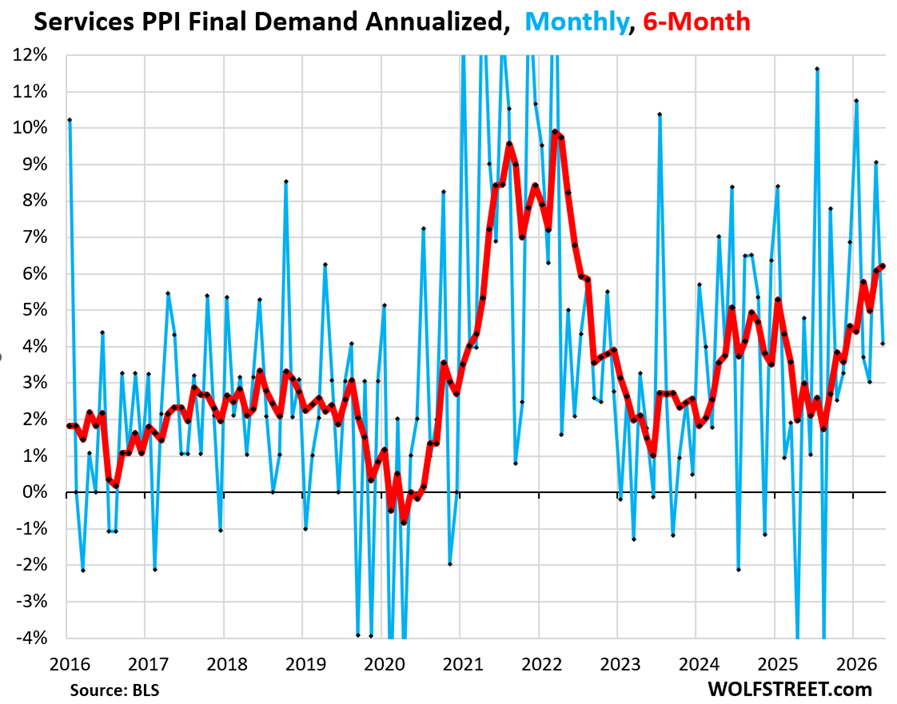
Within the services PPI:
- Trade services (19% of overall PPI) plunged by 1.1% in May from April, after the 1.3% spike in the prior month.
- Transportation & warehousing services (4.9% of overall PPI) soared by 2.6% in May from April, after already soaring by 3.8% and 2.1% in the prior two months.
- But “other services” (38% of overall PPI) rose by 0.7% in May from April, a sharp acceleration from the 0.1% increase and no change in the prior two months.
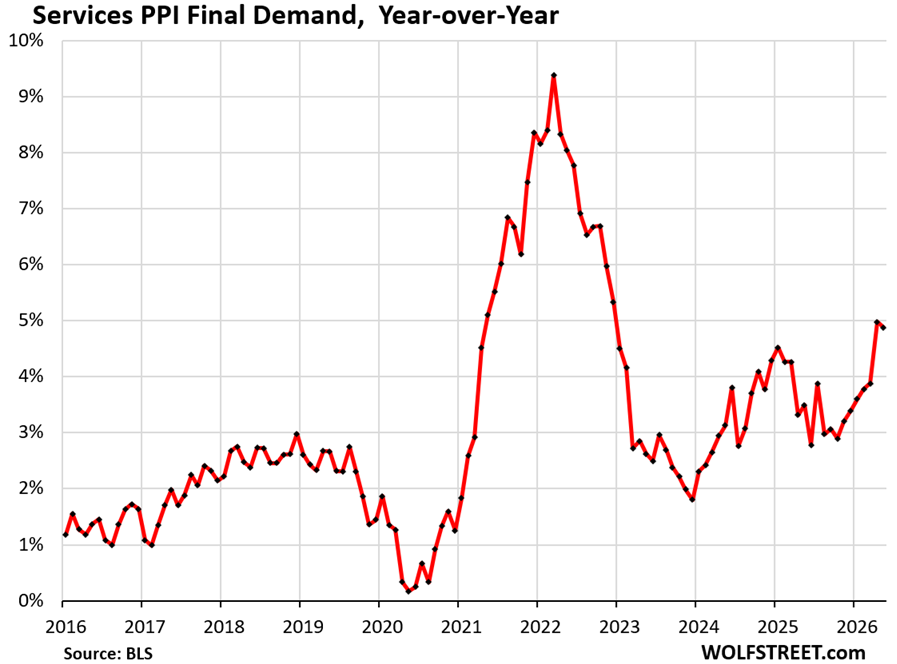
Year-over-year, the services PPI rose by 4.9%, a slight deceleration from the prior month, and both were the worst since December 2022 (red line):
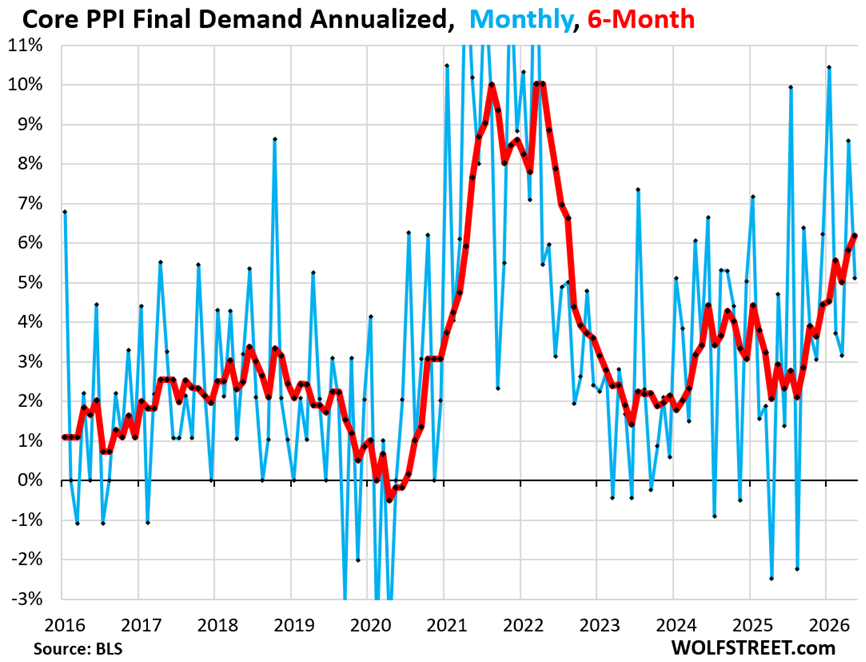
Core PPI Final Demand, which excludes energy and food components, rose by 0.42% (+5.1% annualized) in May from April, seasonally adjusted.
Year-over-year, core PPI accelerated by a hair to 4. 9%, the worst since December 2022.
But the 6-month core PPI, which captures the recent trends, accelerated to 6.2%, the worst since August 2022, and it has been rising ever since it bounced off the August 2025 low (red in the chart below).
In case you missed it: CPI Inflation 4.25%, Blows by 2-Year Treasury Yield, Closes in on 10-Year Treasury, Driven by “Supercore” Services, Gasoline, Electricity
Enjoy reading WOLF STREET and want to support it? You can donate. I appreciate it immensely. Click on the mug to find out how:

![]()
Thanks for including the 6 month inflation rates — that’s my favorite trend indicator. 12 months is too much history, and 3 months isn’t stable enough.
Typo Alert: Inflation beyond energy.
The PPI for core goods, which excludes energy and g[f]ood components, jumped by 0.75% (+9.5% annualized) in May from April.
If Hormuz opens many countries, including the US, they will fill their empty SPRs. Data centers appetite for energy will rise. Higher production from Argentina, Brazil, Guyana, Venezuela, the US and Canada compete with Iran and other Gulf states oil and LNG. The US LNG terminals are more reliable than Qatar’s. The American continent dominates. The Gulf states lost many customers, ex China, but China deflates ==> higher energy PPI.
The US is a net petroleum exporter. It doesn’t depend on the strait of Hormuz for its petroleum needs. Per capita gas consumption is way down in the US – and other developed economies. Data centers need to start making money before they continue spending it – and the stock market is running out of patience for some sign of returns from AI.
1) I can’t help but think we are not getting the whole picture about whatever is going on in the Middle East. Media reports about imminent collapse of refineries are offset by the fact of prices falling… now $85/barrel. The US president’s proclamations of imminent peace are contradicted by the people he would be making peace with, and Netanyahu’s continued conquest of Lebanon. And then when the president talks tough these two mention peace. Meanwhile, of course, we all suspect some pretty vigorous insider trading going on at the White House. Seems foolish to make a wager on anything so nebulous as this.
2) Speaking of the SPR, did anyone notice the US went into this war of choice with its SPR not yet filled? This suggests the real purpose of the war was to pump oil prices and put billions of dollars into the coffers of oil companies – top donors to the ruling party in the U.S.
3) I do not think the Gulf states will “lose customers” when peace is eventually restored. Is China, India, Europe, et. al. going to pay several dollars per barrel extra to pay millions more to ship tankers all the way from the US? No way.
You forgot to mention that Trump has attacked 3 Indian oil tankers.
He’s the classic double minded man.
Let me say it again. It’s the summer of 1973 again. Just like then, the surf was good (“The Wedge” has been going off all week – google it) and SECOND wave (of three) was just getting started…
The politicians were just as corrupt, and it would be one year before Nixon resigned, this time however, we have 120% debt/GDP…
Hedge accordingly
No one surfs the wedge any more. It is only for tourists. Too narrow. Plus who wants to hang out in Newport Beach?
LOL! For me, as a kid, this was a 5 minute walk. As I got older, I surfed around the world but found living and surfing in Santa Cruz (steamer lane) to be the best. But hey, you don’t get better by waiting for “perfect” waves. Suck it up buttercup and learn to surf everything.
I’m not suprised at the slightest. Ppi was elevated in services for quite sometime.
Gas prices are the lynch pin that woke it back up. Most of these companies don’t have a few months of reserve cash despite high corporate profits. Any opinion on that?
The medicine for inflation (economic slowdown through less deficit spending and significantly higher interest rates) is bitter so politicians are unwilling to administer it. Until there is significant turnover in a Congressional election, signaling voter dissatisfaction, inflation will be likely to continue (Google “open secrets reelection rates” for a chart of re-election rates over the years).
Howdy Folks. Right you are Lone Wolf. Last two inflation reports, CPI and this report were high enough to end a war. Well maybe end a war.
I was comparing the PPI graphs from this article with the CPI graphs from the prior article.
It looks like in 2020-2022, the PPI surge preceded the CPI surge by 2-4 months. Has anyone else taken a look at that, and is that reasonable?
For instance, the year-over-year inflation in Core PPI Final Demand first exceeded 3% in late 2020, but the corresponding Core CPI inflation didn’t cross 3% until maybe April 2021. The corresponding dates for “crossed 4% inflation” are March 2021 for Core PPI vs. June 2021 for Core CPI.
If so, this PPI data does not bode well for the next few CPI reports.
There is some but not consistent flowthrough with some but not consistent lag from PPI to CPI.
In terms of flowthrough from PPI to the PCE price index: PCE includes some components from PPI directly, such as some healthcare services, banking fees and services, portfolio management and advice, and property and life insurance, that CPI doesn’t include, so there is some direct flowthrough from PPI to the PCE price index. There are algos (the Fed has one) into which you can plug the CPI figures and the PPI figures (usually released back-to-back) and from that predict pretty closely what the PCE price index (released about 10 days later) will look like.
I overlapped annualized CPI and PPI in FRED to observe the relationship. The two factors seem to drag each other along, with PPI being the more volatile one.
https://fred.stlouisfed.org/graph/fredgraph.png?g=1WRwR&height=490
The story the charts tell is this: We’ll have 5% CPI within the next few months. Plan accordingly.
Thanks for the chart!
I was inspired to take a closer look, and looked in FRED at Final Demand Services vs. Final Demand Goods (less Food & Energy). Services leads goods currently.
Then I compared both with Core CPI. Changes in PPI final demand services do lead Core CPI, but interestingly, moves in PPI Final Demand Goods are merely synchronous with CPI.
Also, not every surge in services translates into a CPI surge. But once PPI Services and PPI Goods are both moving, CPI follows.
From 1973-1974, oil prices tripled, from just over $3/barrel to just over $11/barrel. The US was very petroleum dependent at the time, and so people and businesses had to cut back their spending and a recession followed.
Now the US is a digitally-driven economy, with productivity driven by huge data centers hosting the internet. So what if electricity is the new crude oil?
In my household, petroleum consumption and electricity consumption each represent about 2% of my budget. We are relatively frugal on both compared to the average American. But if I’m spending about the same on each, perhaps the average American is too.
Thus, the rapid increase in electricity prices paired with the rapid increase in oil prices could, in combination, create another 1973-1974 scenario, despite our more fuel-efficient land yachts.
With food inflation, for example, there is energy consumed by the truck in the form of petroleum, but there is also energy consumed in the refrigerators and freezers used to store and sell produce, meats, seafood, beverages, dairy, and frozen items. Your grocery store is getting hit by both cost increases, and will soon be passing those costs along to you.
I’ll be paying as much attention to electricity costs as oil prices. Electricity costs used to be stable, but that relationship has broken down.
I just asked Google what the average American family spends on gas and electricity and it said 5%-6% of their income so Chirs at 4% is either making a little more than average or using a little less gas and electricity than average. When I was in college in the early 80s the CA Minimum wage was $3.35/hour and gas was a little over $1/gallon ~3 gallons for an hours work. Today the CA minimum wage is $16.90/hour ($20/hour at fast food restaurants) and gas is about $5.50/gallon pretty much the same ~3 gallons for an hours work as 45 years ago (a little better for guys that work at McDonalds and even better for guys making burgers at InNOut since they start at $22/hr.).
I’m doing excellent at the % part not so much on the actual amount.
I’m going to guess the average pool is going to be really feeling it.
Then again I have a dream in the back of my head that gas and electricity go up so high that I can actually drive my Italian in the mountains on a weekend during the day without any cars in front of me. But that’s just a silly dream my wife says.
@Kracow six years ago when the schools closed for “two weeks to flatten the curve” (and CA locked down) I had a great time exploring mostly empty back roads in my little German car. You don’t need to wait for higher gas prices or another lockdown for empty roads. Next weekend we will have close to the longest days of the year so hit the road just before 5:00am next Saturday and you should have a couple hours of mostly empty roads as you watch the sun rise.
Ha! The man in the pale house is on camera saying “I love the inflation.” No joke. Look it up.
They all love inflation until it comes time vote, and voters throw them out because voters hate, hate, hate inflation.
But voters love, love, love their social media even more, and so they’ll vote for whomever puts the most ad impressions, paid influencers, and misinfo in front of their eyes.
It’s a contradiction to say advertising works, and to also think voting is the one special category where people think for themselves.
Every time I see a chart indicating PPI inflation, I wish it was overlaid with a chart showing their profit margins. The profit pumping that happened during the pandemic really changed my view of corporate America…not that it was that great before. Something has to give with the rampant gouging I see.
Who is “their”? Like collective profits (which may be a bad measure)?
It’s not corporate America, it’s also the consumer
S&P500 profit margins today are nearly double what they were in the booming 1990s:
https://dqydj.com/sp-500-profit-margin/
But some of the blame falls on consumers, for spending a larger percentage of their paycheck on the big tech economy rather than the less-monopolistic things in the typical 1995 consumption basket.
Behaviors like paying for software, AI subscriptions, a new $1,000 phone every couple of years, cloud services, streaming, touch screens everywhere, etc. goes toward pumping up the already-high margins of the world’s richest companies. These companies often call their services intellectual property, as if it were a novel, and create artificial monopolies around that legal argument. Then we happily line up to be gouged, because ads convince us that the next iphone is better than the one that was out two years ago, or that we “need” to listen to Spotify destroy the live music scene ad-free.
On a lot of that, I agree. But I find music streaming to be the greatest thing since sliced bread. Before, I bought a mix of new and used CDs and occasionally digital downloads. With streaming, I get to listen to much more new (and old) music for less money, the price of 1 CD a month!
It seems the bond market shrugged all this off today. Some really ugly charts in here yet jawboning the markets through social media posts is clearly easy to do these days to keep things artificially in check. Eventually data will start to matter again.
The ECB raised rates from 2% to 2.25% to tackle inflation. Kevin will
stay the coarse.
BOJ essentially just confirmed a rate hike today. We could learn a thing or two from them. Although our dollar is not as weak their yen.
Check what the BOJ’s current policy rate is: 0.75% 🤣
If they hike once, they’re at 1.0%, if they hike twice over the next 12 months, they’re at 1.25%. They’re just a joke with an inflation problem and a collapsing currency. I hope the Fed learns from the BOJ what NOT to do.
Japan is the big cautionary tale. First with the Japanese asset price bubble (they had lost decades), second with its insane debt-to-GDP ratio, and third with its xenophobic immigration policy and aging of its work force, harming the real economy & housing.
They had the world by the balls and then declined, and declined, and declined.
The longer short-term money flows raise long-term money flows, the broader inflation becomes entrenched. Some refer to it as the Cantillon effect.