But what the heck happened at food & beverage stores?
By Wolf Richter for WOLF STREET.
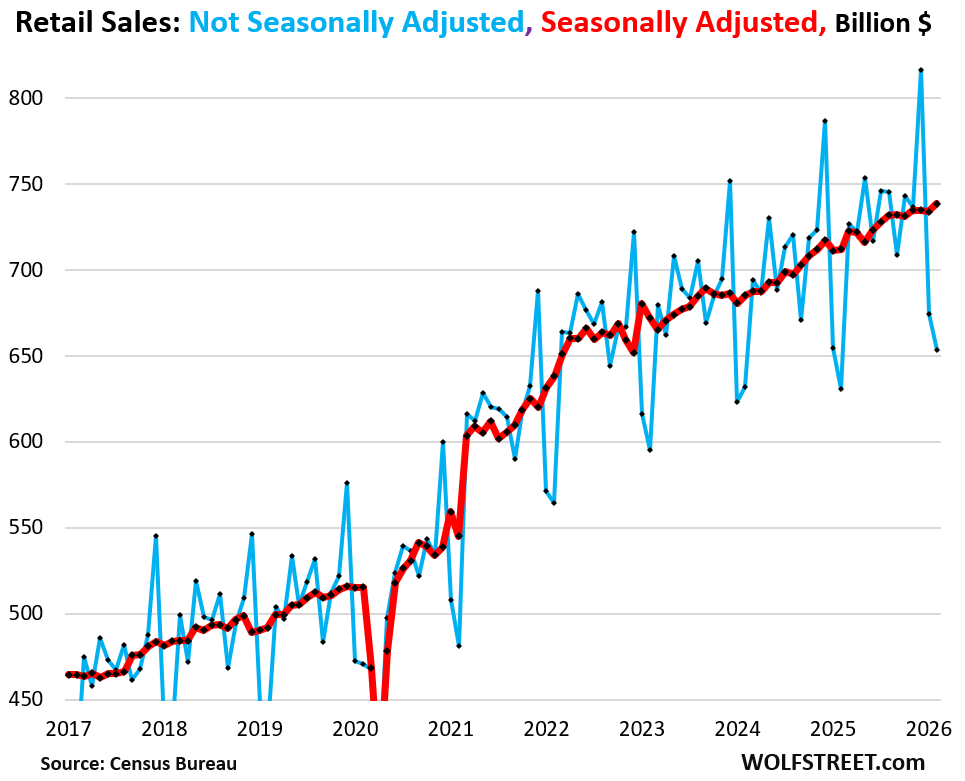
Retail sales soar in December and collapse in January and February, every year to varying extents. Huge seasonal adjustment factors are used to reduce December sales and to increase January and February sales, to roughly level them out. And that was on full display today in retail sales for February, reported by the Census Bureau today.
Seasonally adjusted, retail sales in February jumped by 0.6% from January, to a record $738 billion (red line in the chart). Not seasonally adjusted, retail sales plunged by 3.1% in February from January, to $653 billion, the lowest since, well, February last year (blue in the chart).
But year-over-year, both metrics of retail sales rose by about the same solid rate: by 3.7% seasonally adjusted (SA) and by 3.6% not-seasonally adjusted (NSA), a decent growth rate, not spectacular, outrunning by a pretty good margin the inflation rate of goods that retailers sell (most inflation is in services that retailers don’t sell).
The seasonal adjustments attempt to account for seasonal variations, such as weather, pre-holiday gift-buying, post-holiday gift-returning, differences in the number of “trading days,” and other factors. The Census Bureau’s X-13 ARIMA-SEATS software program calculates these seasonal adjustment factors, based on numerous historical data points.
But over a 12-month period, seasonal adjustment factors sum up to zero, so an over-adjustment in some months leads by definition to under-adjustments in other months.
So we’re looking at the longer trends.
The biggest categories of retailers.
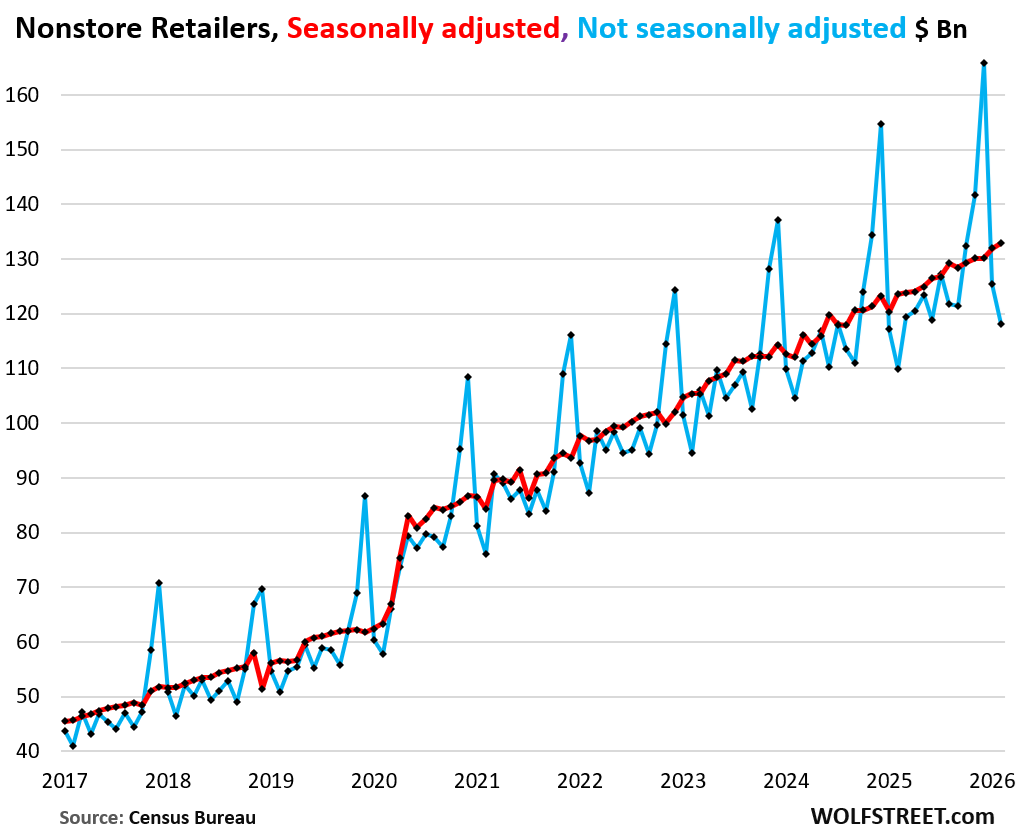
Ecommerce and other nonstore retailers (18% of total retail sales) continued to relentlessly gobble up market share, growing year-over-year at about twice the rate of overall retail sales.
- SA: +0.7% month-to-month, to $133 billion.
- NSA: -5.8% month-to-month, to $118 billion.
- Year-over-year: +7.5%.
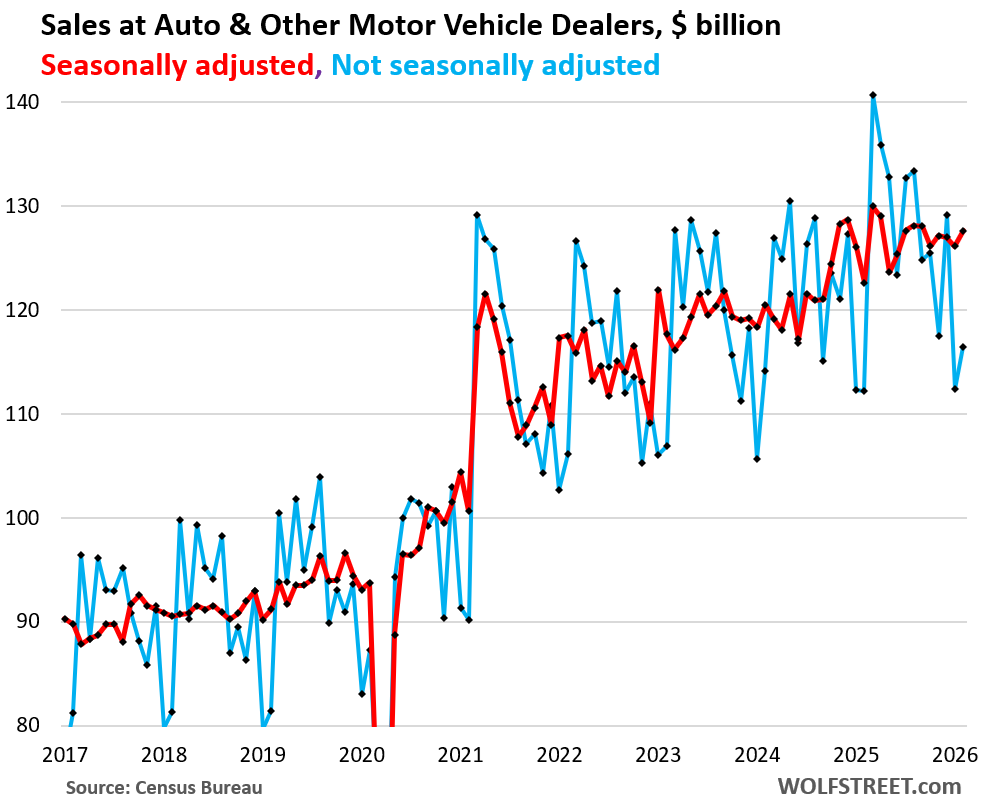
Auto & other motor vehicle dealers (16% of total retail sales):
- SA: +1.2% month-to-month, to $128 billion.
- NSA: +3.6% month-to-month, to $116 billion.
- Year-over-year: +3.7%.
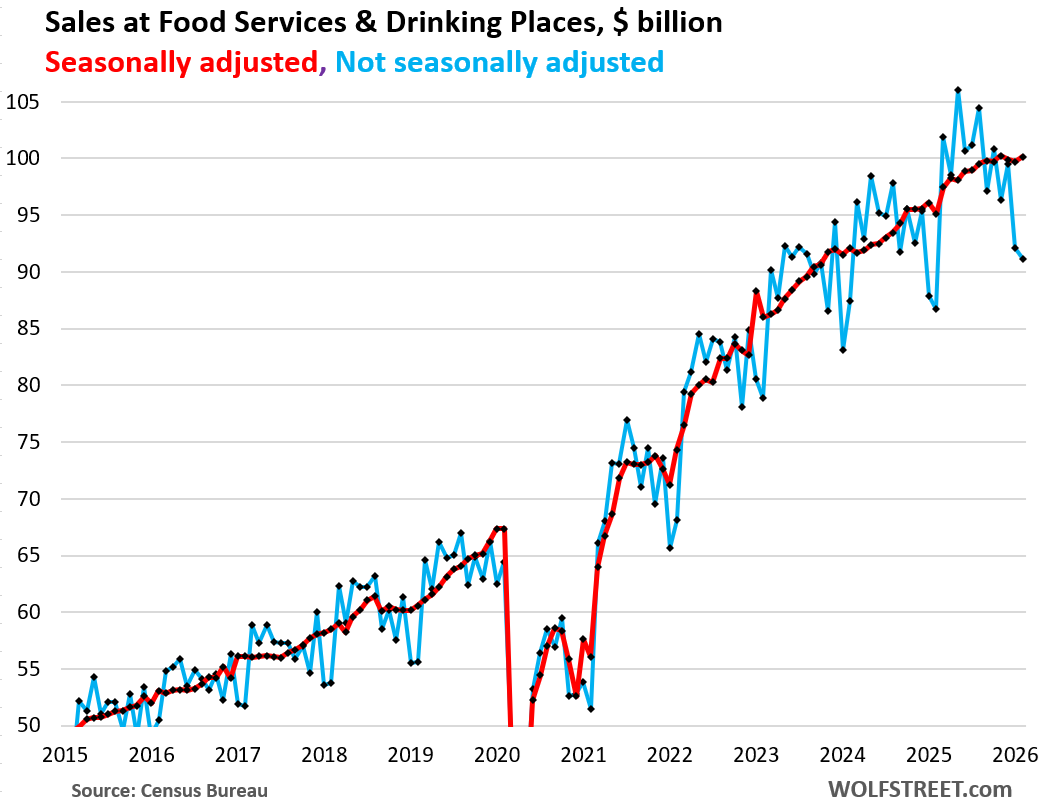
Food services & drinking places, such as restaurants and bars (12% of total retail sales).
- SA: +0.4% month-to-month, to $100 billion.
- NSA: -1.1% month-to-month, to $91 billion.
- Year-over-year: +5.0%.
Food & Beverage stores, such as supermarkets, grocery stores, and specialized beverage stores (11% of total retail sales).
- SA: -1.1% month-to-month, to $84 billion.
- NSA: -9.9% month-to-month, to $76 billion.
- Year-over-year: -0.3%.
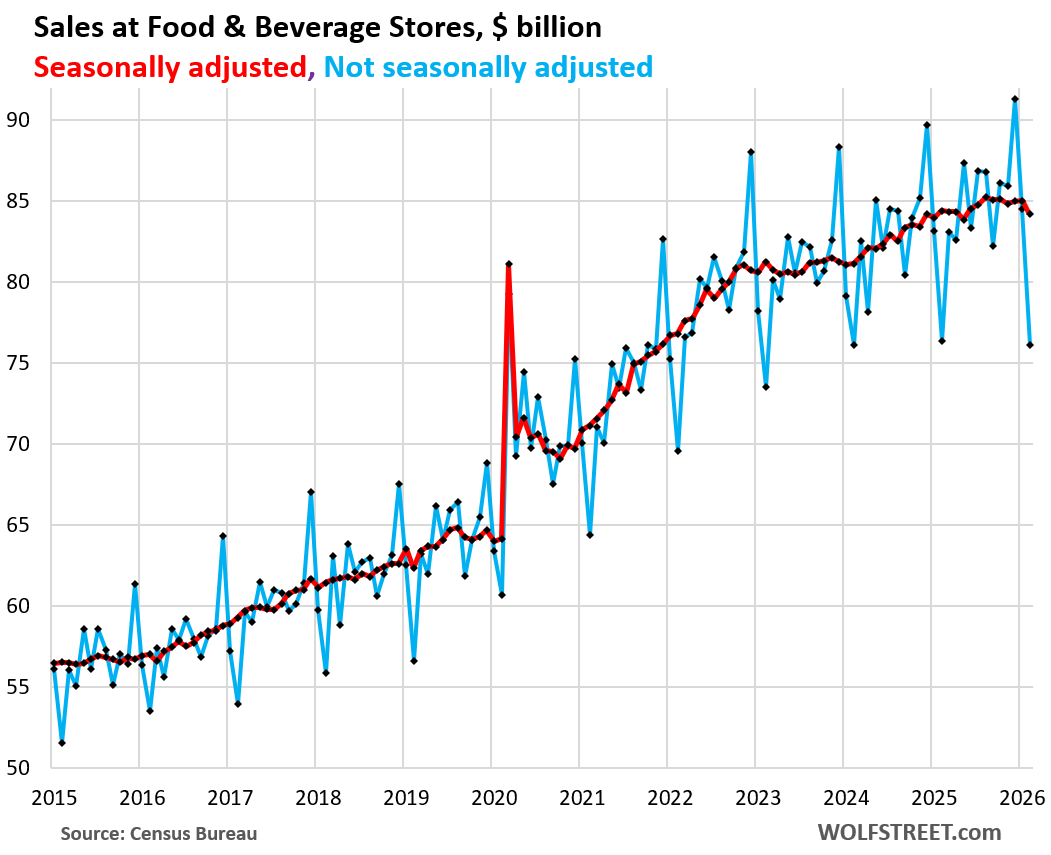
The NSA drop of -9.9% month-to-month in February at food & beverage stores was bigger than normal and pulled the year-over-year comparisons into a decline (-0.3%) from normal-ish positive readings in the prior months. So what happened at these stores in February?
It could be a one-month blip or it might get revised away.
Or it could be a sign that supermarkets are losing market share at a much-accelerated pace to other retailers selling this merchandise. Food and beverage stores have been losing a lot of market share for years to other retailers, especially ecommerce and general merchandise retailers such as Walmart, the largest grocer in the US, and Costco.
When people buy food online, it counts under ecommerce retailers; when people buy food at Walmart, Costco, Target, and other general merchandise stores, it counts under “general merchandise retailers.”
It’s not that people buy less food, it’s that they buy it at retailers other than “food and beverage stores,” and that food and beverage stores are losing market share to those retailers.
In addition, more and more food sales have wondered off to restaurants, see chart further up.
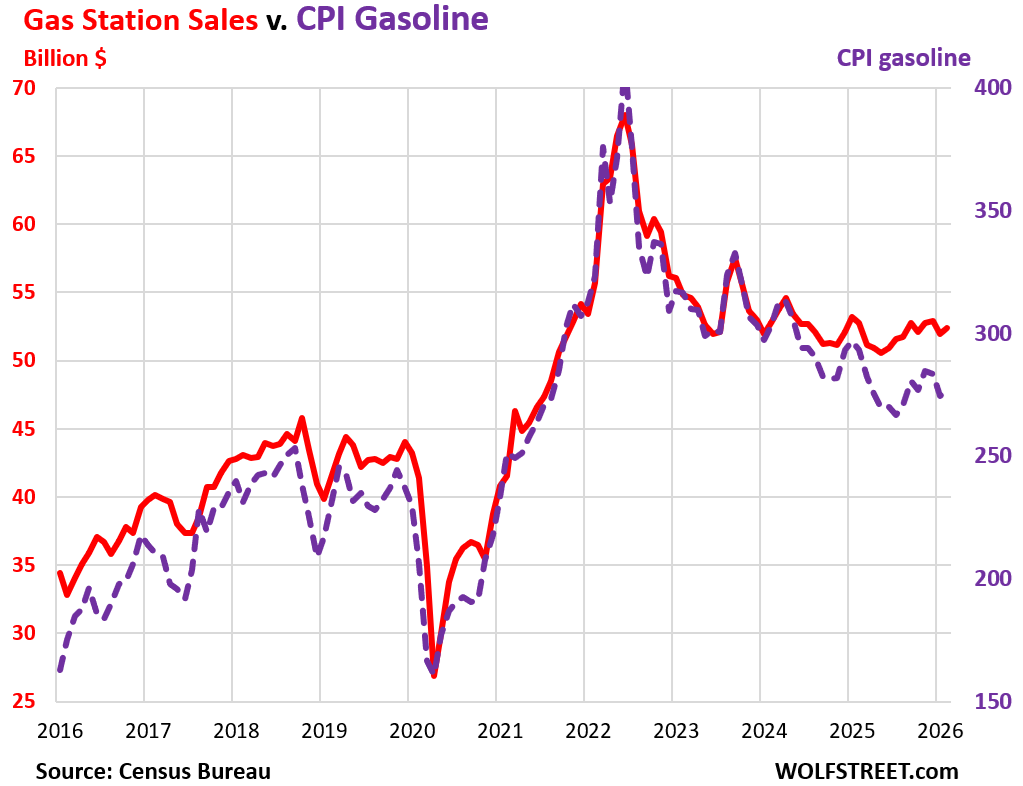
Gas station sales (7.1% of total retail sales) move in near-lockstep with the price of gasoline. Gasoline prices began to spike in March. But in February, they were still benign after dropping in January to the lowest in years.
- SA: +0.9% month-to-month, to $52 billion.
- NSA: -3.4% month-to-month, to $45 billion.
- Year-over-year: -0.7% on price declines.
The chart below shows retail sales of gasoline (red), and the CPI for gasoline as index value of prices (dotted purple).
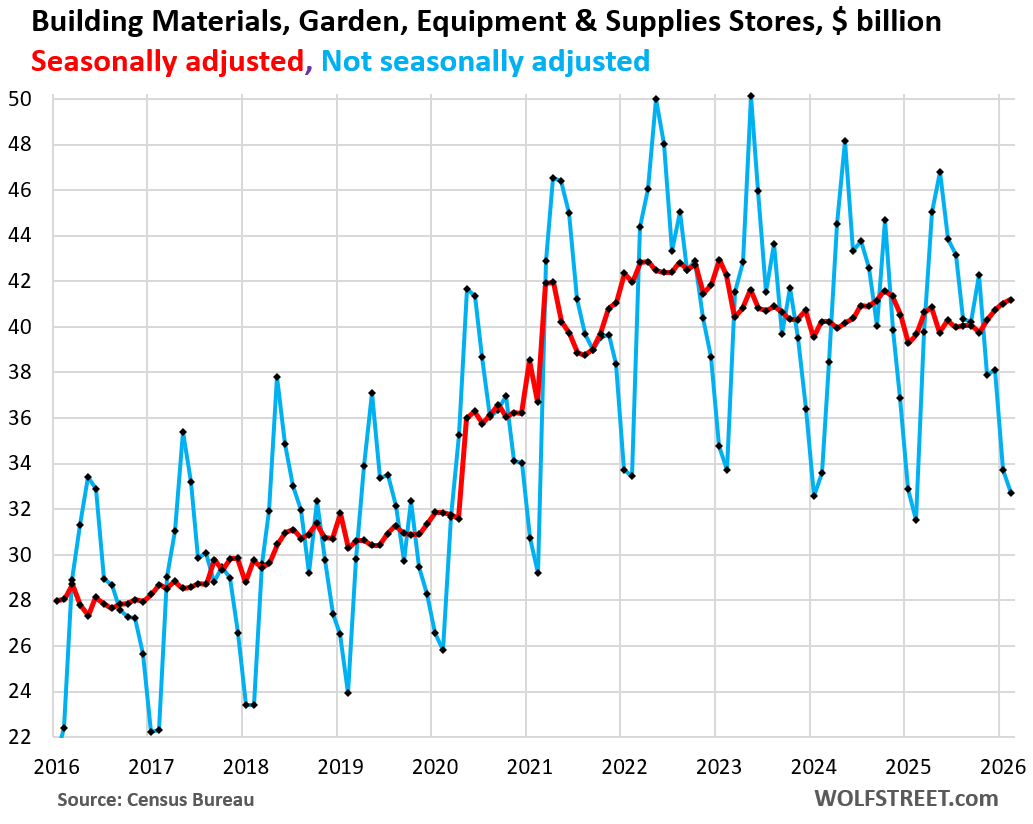
Building materials, garden supply and equipment stores (5.5% of total retail sales).
- SA: +0.4% month-to-month, to $41 billion.
- NSA: -3.0% month-to-month, to $33 billion.
- Year-over-year: +3.7%.
Sales are still down substantially from the Covid boom.
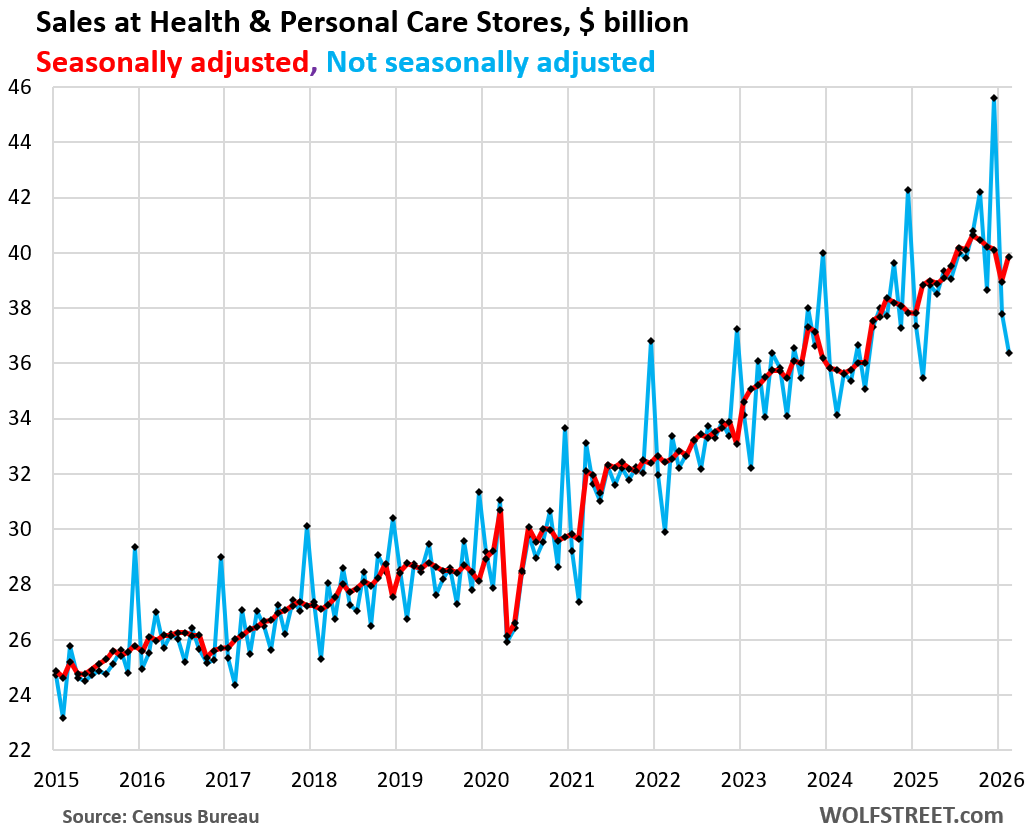
Health and personal care stores (5.5% of total retail sales).
- SA: +2.3% month-to-month, to $40 billion.
- NSA: -3.7% month-to-month, to $36 billion.
- Year-over-year: +2.5%.
In case you missed it: Where Americans Spend their Trillions on Goods and How that Changed since 2015
Enjoy reading WOLF STREET and want to support it? You can donate. I appreciate it immensely. Click on the mug to find out how:

![]()
Retail looks rather normal, tbh. Non-adjusted swings are getting slightly wider but track trendlines perfectly. What am I missing?
Cars are getting what they deserve. All new cars are pos, really. Prices have been maxed out to the breaking point, they break a lot more and are more expensive to fix, and less people need them (I know many who gave up theirs / downsized in favor of occasional Uber).
I read a financial statement some time ago from Walmart saying food sales have decreased due to weight loss drugs. I seem to remember about 5%? But the price of groceries has increased – perhaps it is almost a wash?
Walmart did NOT say that. Don’t make up stuff.
For its quarter through Feb 28, Walmart said that grocery sales are up “mid single digits” (ca. +5%). And added “Sales strength led by pantry and fresh food; reflects strong growth in unit volumes and share gains as customers value low prices and delivery convenience.”
https://www.sec.gov/Archives/edgar/data/104169/000010416926000032/earningspresentationfy26.htm
I take home a lot of portions of food at deli’s and restaurants and have free meal the next day. Grocery stores are now charging more than many places away from home. May it be that these out of the home businesses are buying wholesale and passing these savings onto the customers while grocery stores are selling at full markup?
Total Market Scale: The entire NASDAQ composite—thousands of companies—was valued at $6.7 trillion at its 2000 peak. Today, NVIDIA ($4.24T) and TSMC ($1.75T) together nearly equal that entire 2000 index.